There were three stages I went through to complete this project. First I chose what I wanted to visualize (and how), then I chose what to visualize it in, and lastly I implemented the visualization. This provided me with a clear understanding of what I needed to do at any given point in the project.
I looked through the provided datasets in order to gain an understanding of what data was available to me, and decided from the beginning that a correlation between only two or three data points would be easiest to manage during the 5 day time limit.
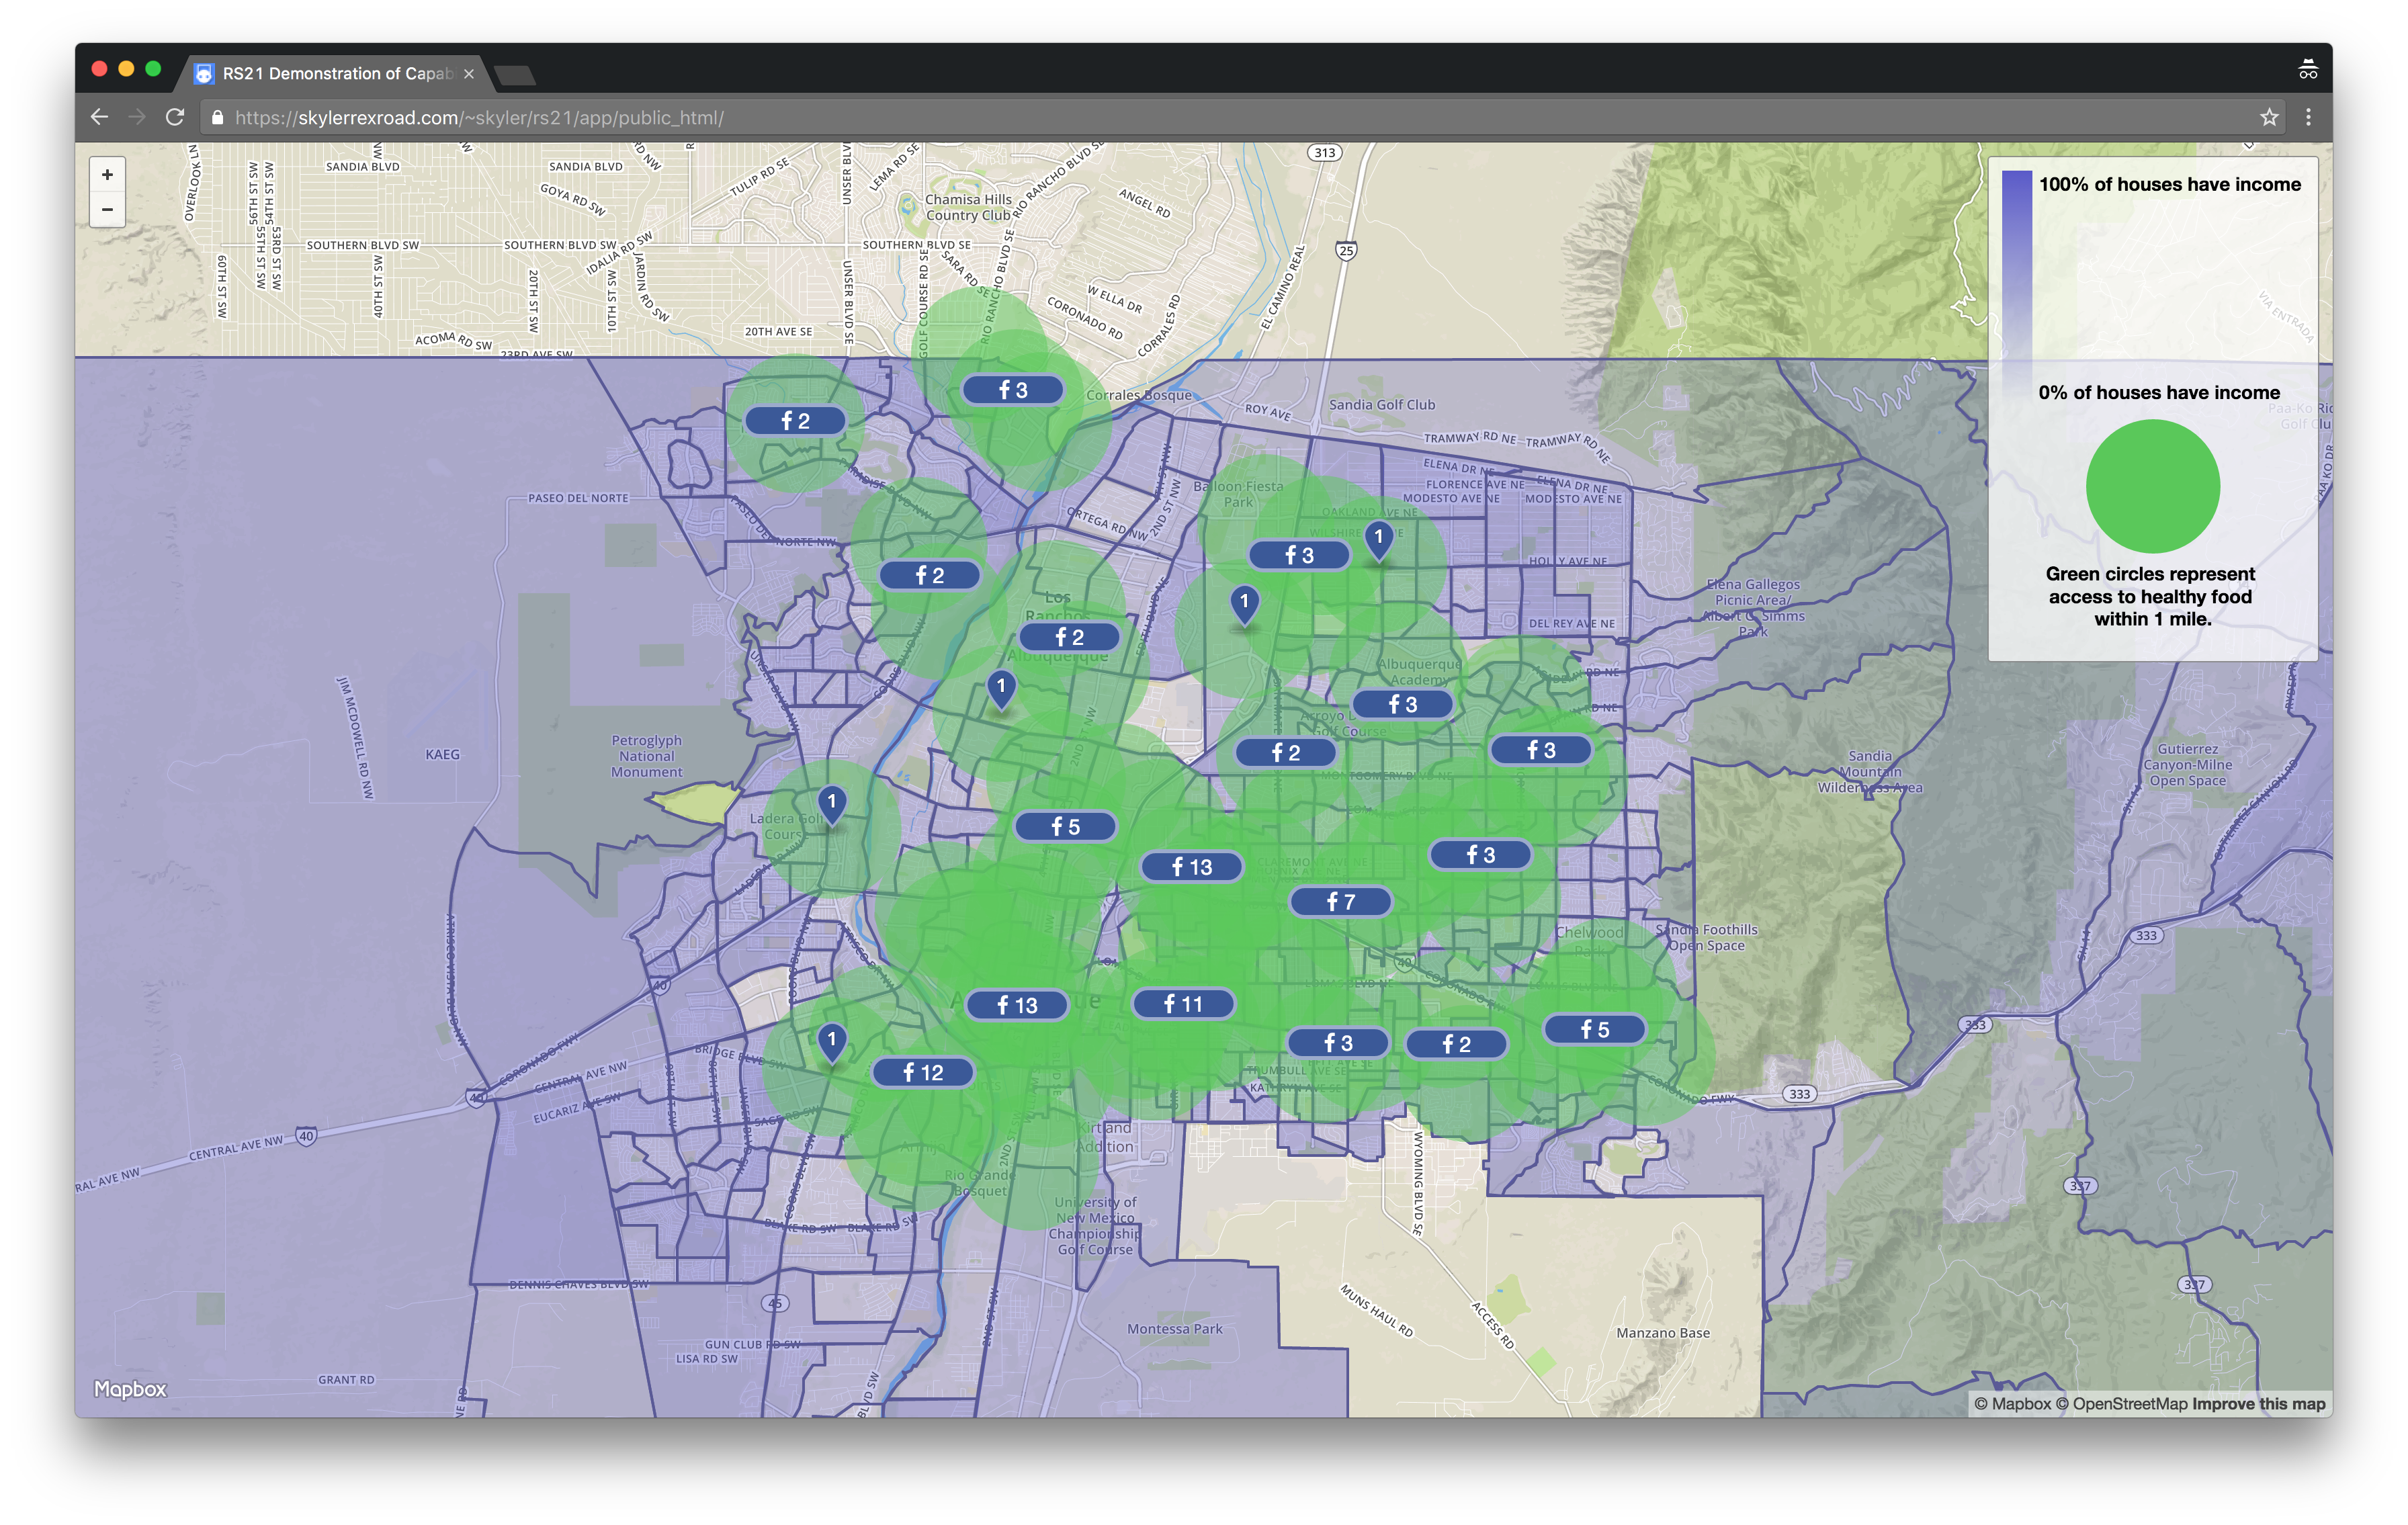
I chose to visualize food deserts within Albuquerque, and show the potential correlation between income and access to healthy food. Food deserts are defined by the U.S. Department of Agriculture as urban areas in which it is difficult to buy affordable or good-quality fresh food within 1 mile of your home. The idea is that the further people have to travel to access healthy food the less likely they are to make the trip. This has significant health impacts on communities who reside within a food desert.
Mapbox and D3 were recommended in the prompt, so I turned to them first. I'd never used either library before this project, but after reading through their documentation I thought that they looked reasonably simple and easy to pick up.
I really enjoyed learning Mapbox (and by extension Leaflet) and D3, they're powerful tools and I thought they were surprisingly easy to pick up. As I mentioned earlier, I'd never used them before and I was able to learn and implement them within the time limit of the project.
I also enjoy working with real-world data and identifying potential problems and solutions in a meaningful way. Creating visualizations of datasets is something that is extremely satisfying to me.
There are a few things that I would have done to take this project further.
-
The Facebook Places provided to me don't classify all grocery stores/farmer's markets/etc. as such (ex. Smith's is classified as a local business). This means there are several grocery stores in Albuquerque that are missing from the dataset. In order to fix this, I could pull the city's building permit and/or business license data in order to build a more reliable data set of "healthy food sources".
-
I used dataset
B19051(Earnings In The Past 12 Months For Households) to display number of houses with income as a representation of poverty level as it was the only data set provided to me that related to income. I would have rather used datasetB19052(Wage Or Salary Income In The Past 12 Months For Households) for this comparison, as it calculates average household salaries — a much better indicator of poverty or wealth. -
The census data provided to me was at the county level, but the Facebook Places were contained within the Albuquerque City Limits. For a project that would go to a client I would prefer to use datasets with the same sample area to maintain consistency.
-
If I were to work on this project in the future, I would like to pull the city's vacant parcel data from their GIS department (provided for free on their website) in order to identify places within the food deserts that could potentially be developed or redeveloped into a grocery store. Identifying the problem areas is the first step, but offering potential solutions would create a well-rounded project.

