Building an end to end machine learning pipeline that can predict the hourly demand of NY Citi-Bikes at a particular station
Implemented in New York City, Citi Bikes have become a popular bike-sharing system, providing convenient transportation for residents and tourists alike. With millions of daily customers using Citi Bikes for various purposes such as commuting, shopping, and leisure, the system has over 1500+ stations across New York and Jersey City. Ensuring an adequate supply of bikes at each station can be challenging, but data science plays a crucial role in addressing this issue. By employing an end-to-end machine learning pipeline, the usage of bikes can be tracked, and hourly predictions of bike rides can be made. This enables the business to better understand demand patterns, timely replenish bikes at the docks, and manage the distribution of bikes across different stations. Ultimately, this data-driven approach enhances operational efficiency, resulting in increased ride availability and satisfied customers.
To address the data-intensive nature of the problem and optimize processing speed, the entire application was developed using the Databricks platform. Python and Pyspark SQL were the primary programming languages utilized for coding purposes.
To efficiently handle the large volume of data and deliver timely insights, a well-structured pipeline was designed. The project plan was divided into four key sections:
- Building an ETL (Extract, Transform, Load) pipeline to handle the hourly influx of new and historical data.
- Conducting exploratory data analysis (EDA) to identify relevant features and patterns.
- Developing a machine learning model to make accurate predictions based on the identified features.
- Establishing a machine learning model registry for tracking and updating the models over time.
This approach ensured a streamlined process, enabling the team to effectively handle the data, gain insights, and continuously improve the machine learning models.
Given the scale of the data involved, it was imperative to design an optimized and efficient data pipeline that could seamlessly handle both incoming and existing data. The project utilized two primary data sources: historical data files spanning a two-year period, and live data updates received every 30 minutes. The objective was to leverage the historical data for training a forecasting model, validate its performance using the live data, and utilize the model to predict demand for the next 48 hours or more.
To achieve this, separate table structures and relations were created for the historic and real-time data. The dataset consisted of two years' worth of trip history details, two years of historical weather data (with occasional gaps), and three other data sources updated every 30 minutes. The pipeline architecture followed the Medallion format, where raw data was stored in bronze tables, and data relevant for model training was cleaned, merged, and stored in silver tables. Additionally, API calls were made to address missing weather data. Gold tables were reserved for inference and monitoring model/data. The ETL pipleine was made immutable so that no side effects occur while running it multiple times with the same input data.
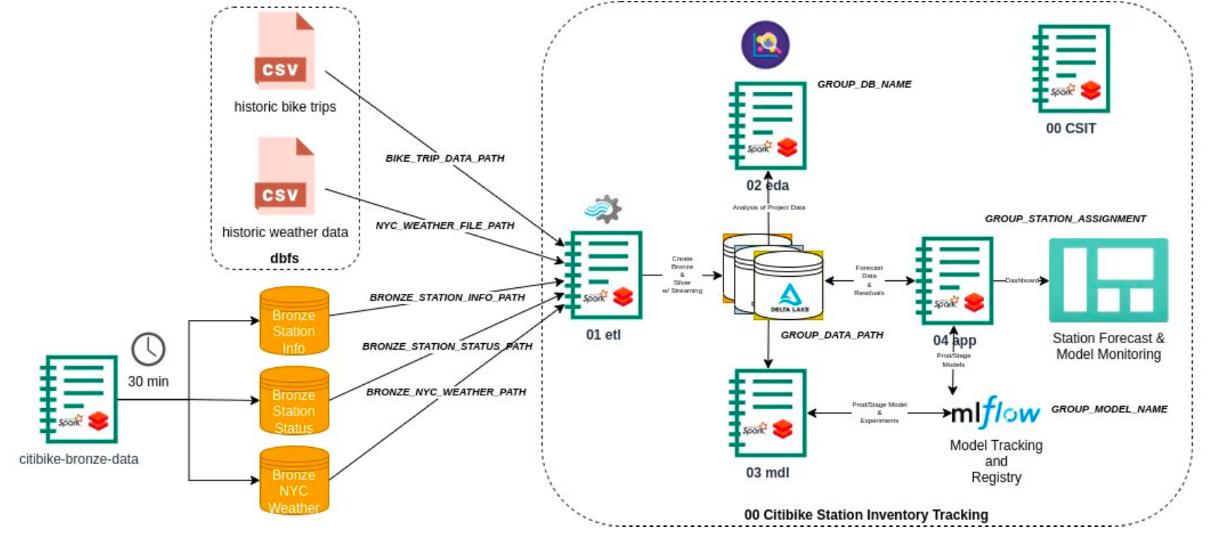
This carefully designed architecture ensured a robust and efficient data pipeline, facilitating the extraction, transformation, and loading of data for analysis and modeling purposes.
Link to Code: ETL File
Exploratory data analysis (EDA) played a pivotal role in this study as it provided valuable insights into the usage patterns and operational demand of Citi Bikes. Key findings from the analysis include:
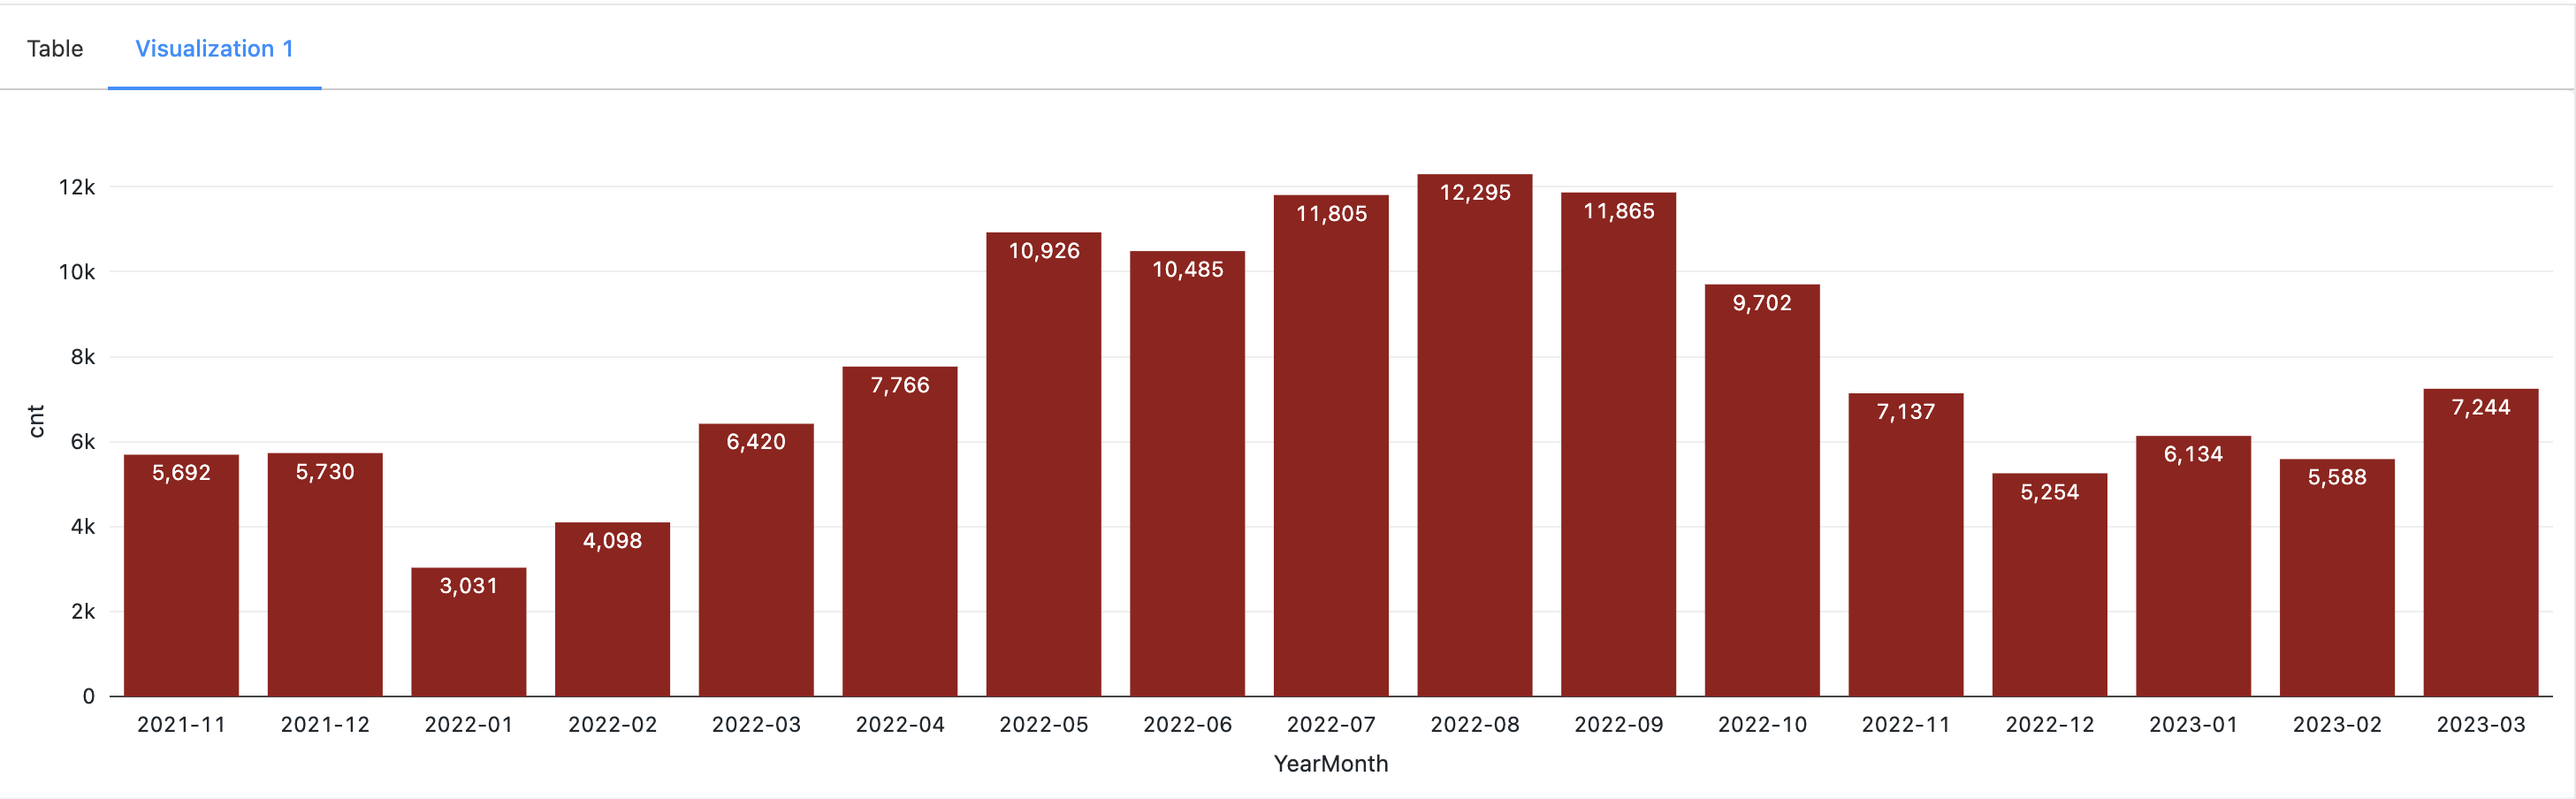
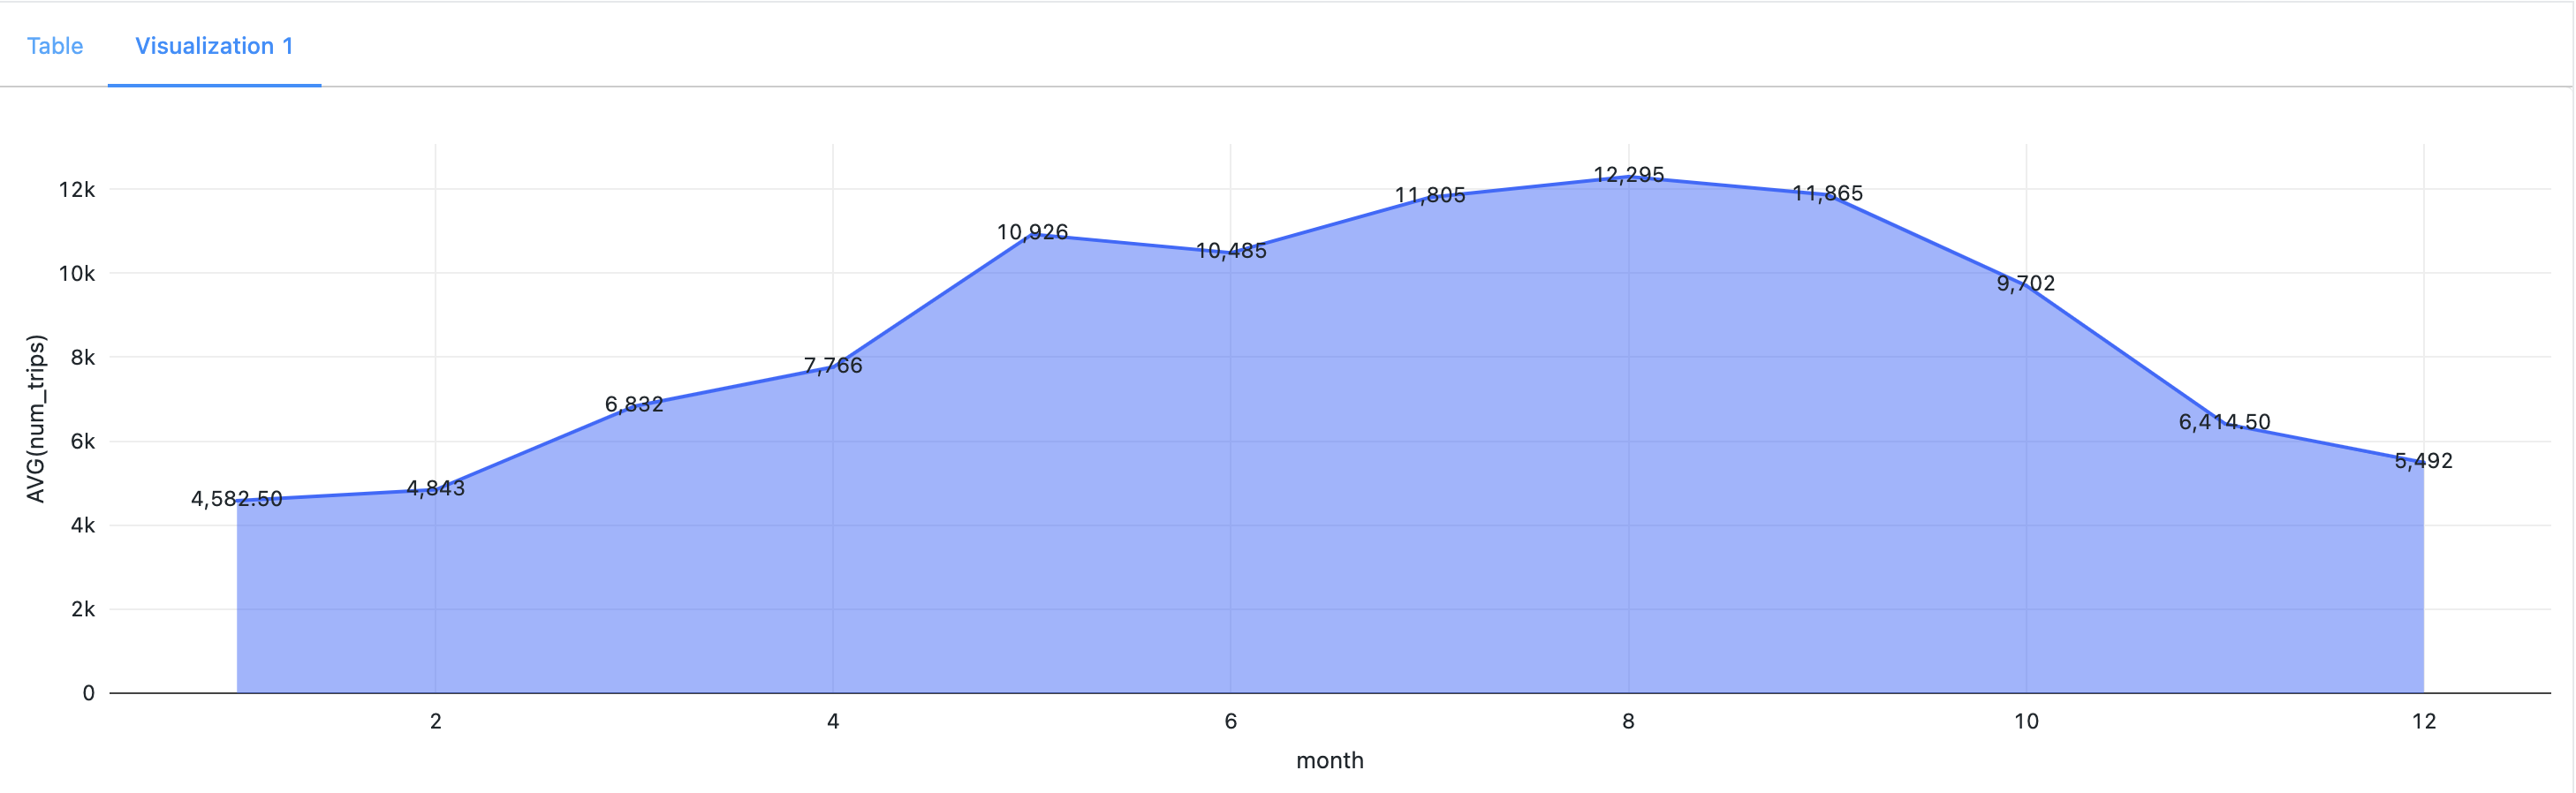
- Seasonal Variations: Seasonal variations played a crucial role in ride counts. During winter, ride counts decreased due to snowfall and unfavorable weather conditions, whereas ride counts increased during summer and fall.
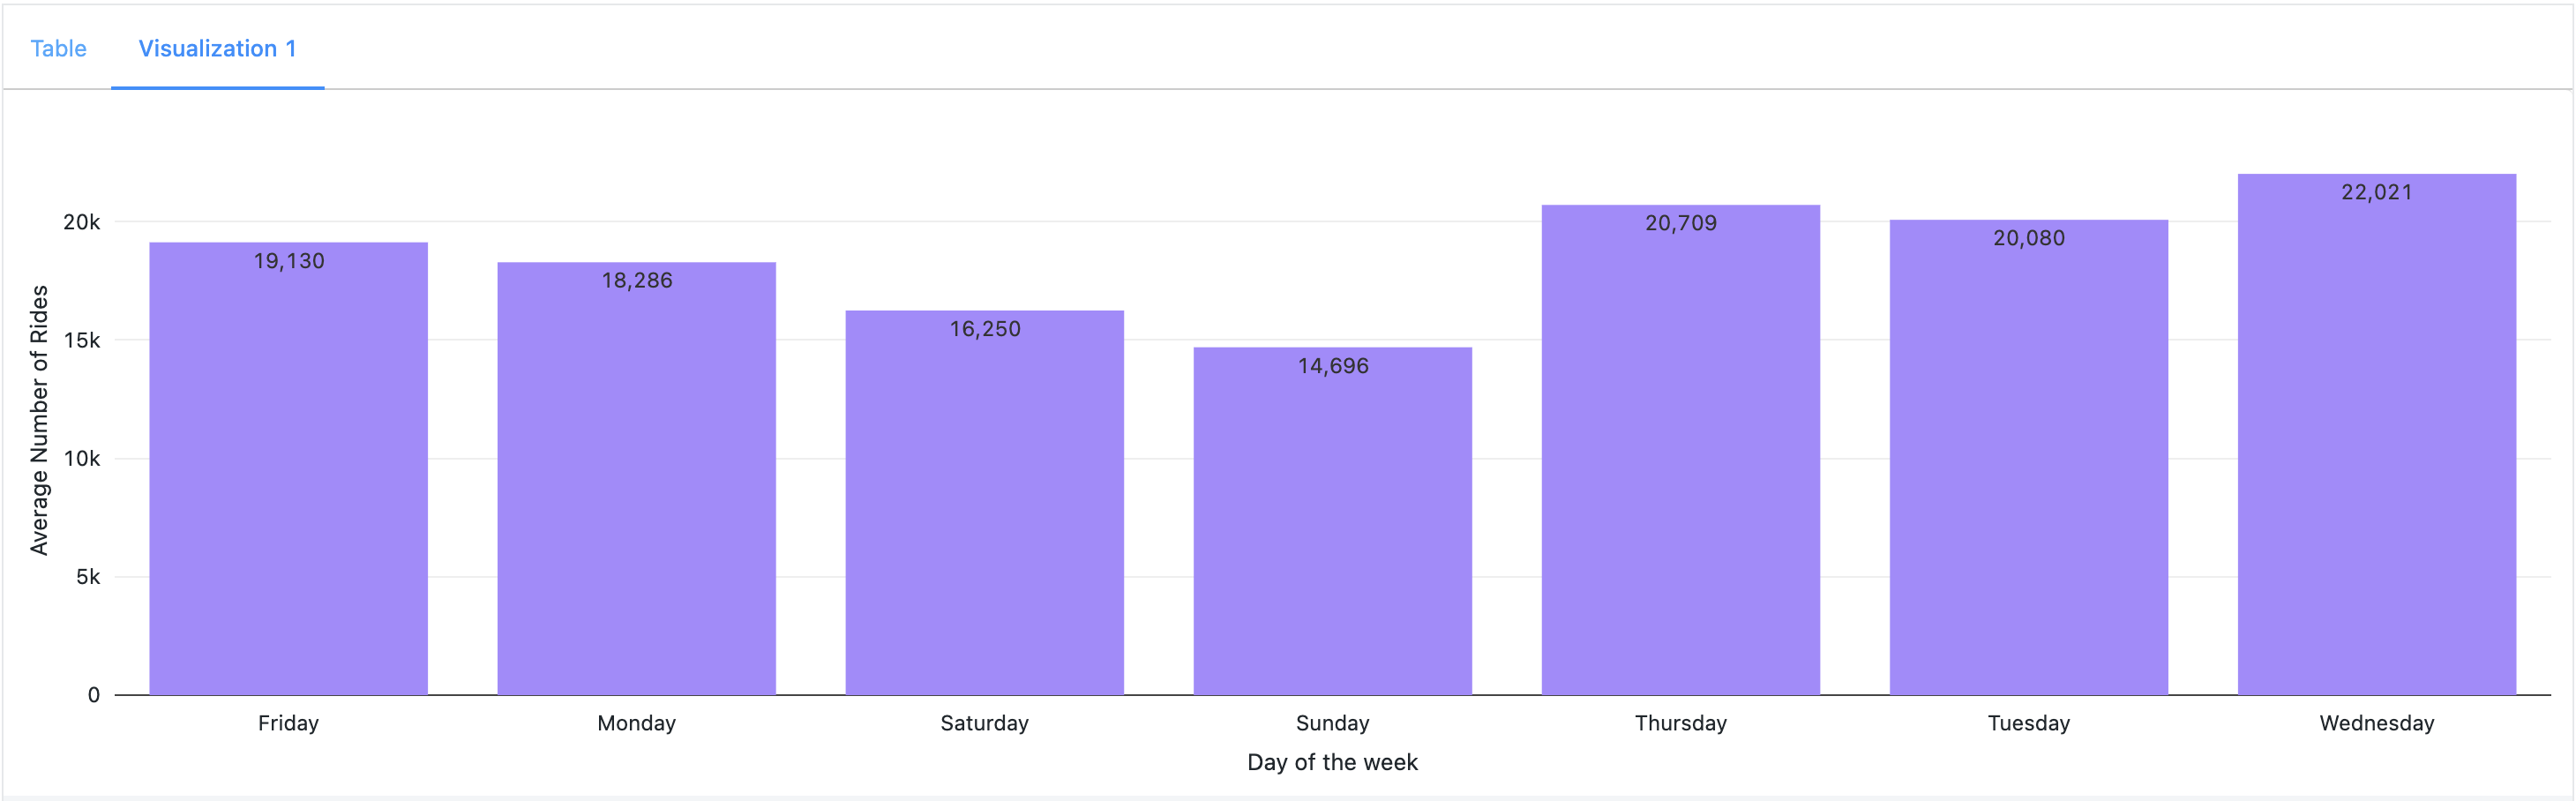
- Weekend Effect: There was a noticeable decrease in ride counts during weekends, suggesting a shift in user behavior. Factors such as visibility, cloud cover, and rain emerged as significant contributors to this trend.
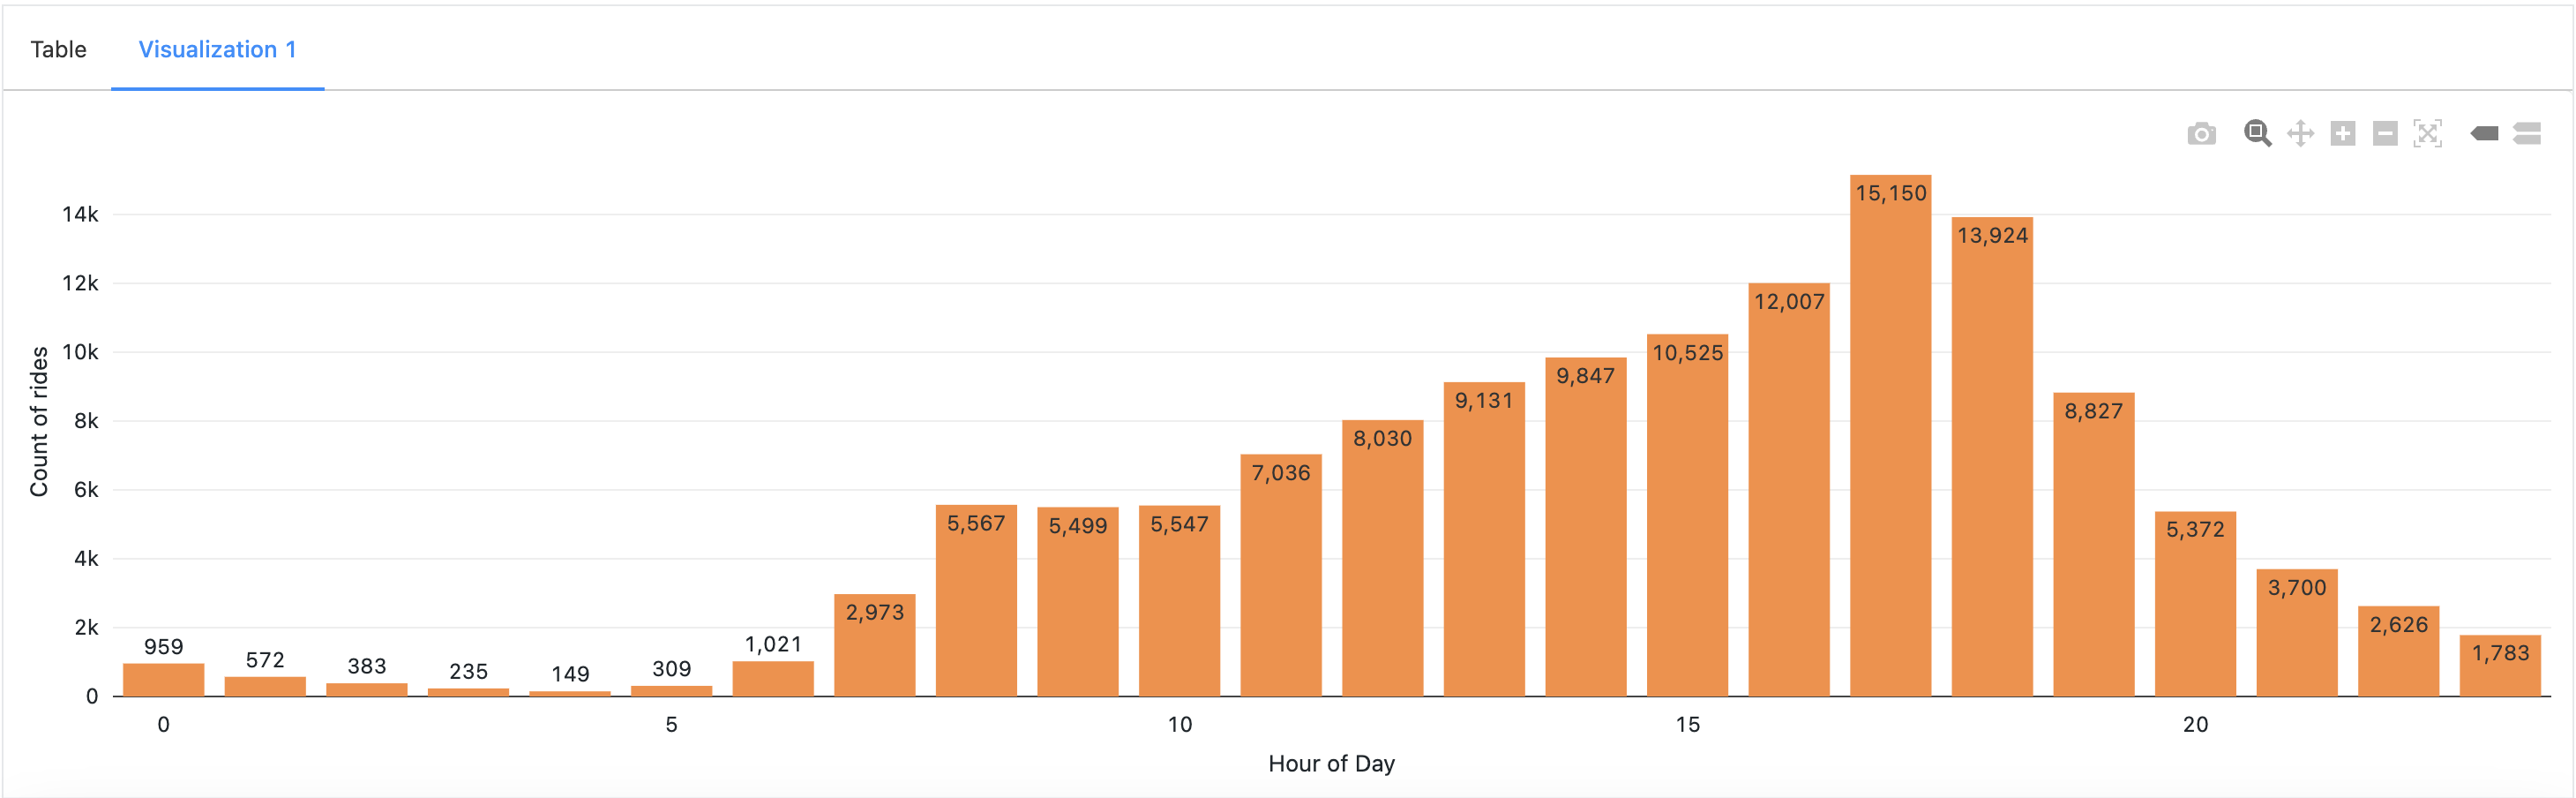
- Hourly Patterns: Ride counts exhibited distinct patterns based on the hour of the day. Increased ride activity was observed during early morning and evening hours, corresponding to office commute times. This finding indicated a substantial user base consisting of daily office goers.
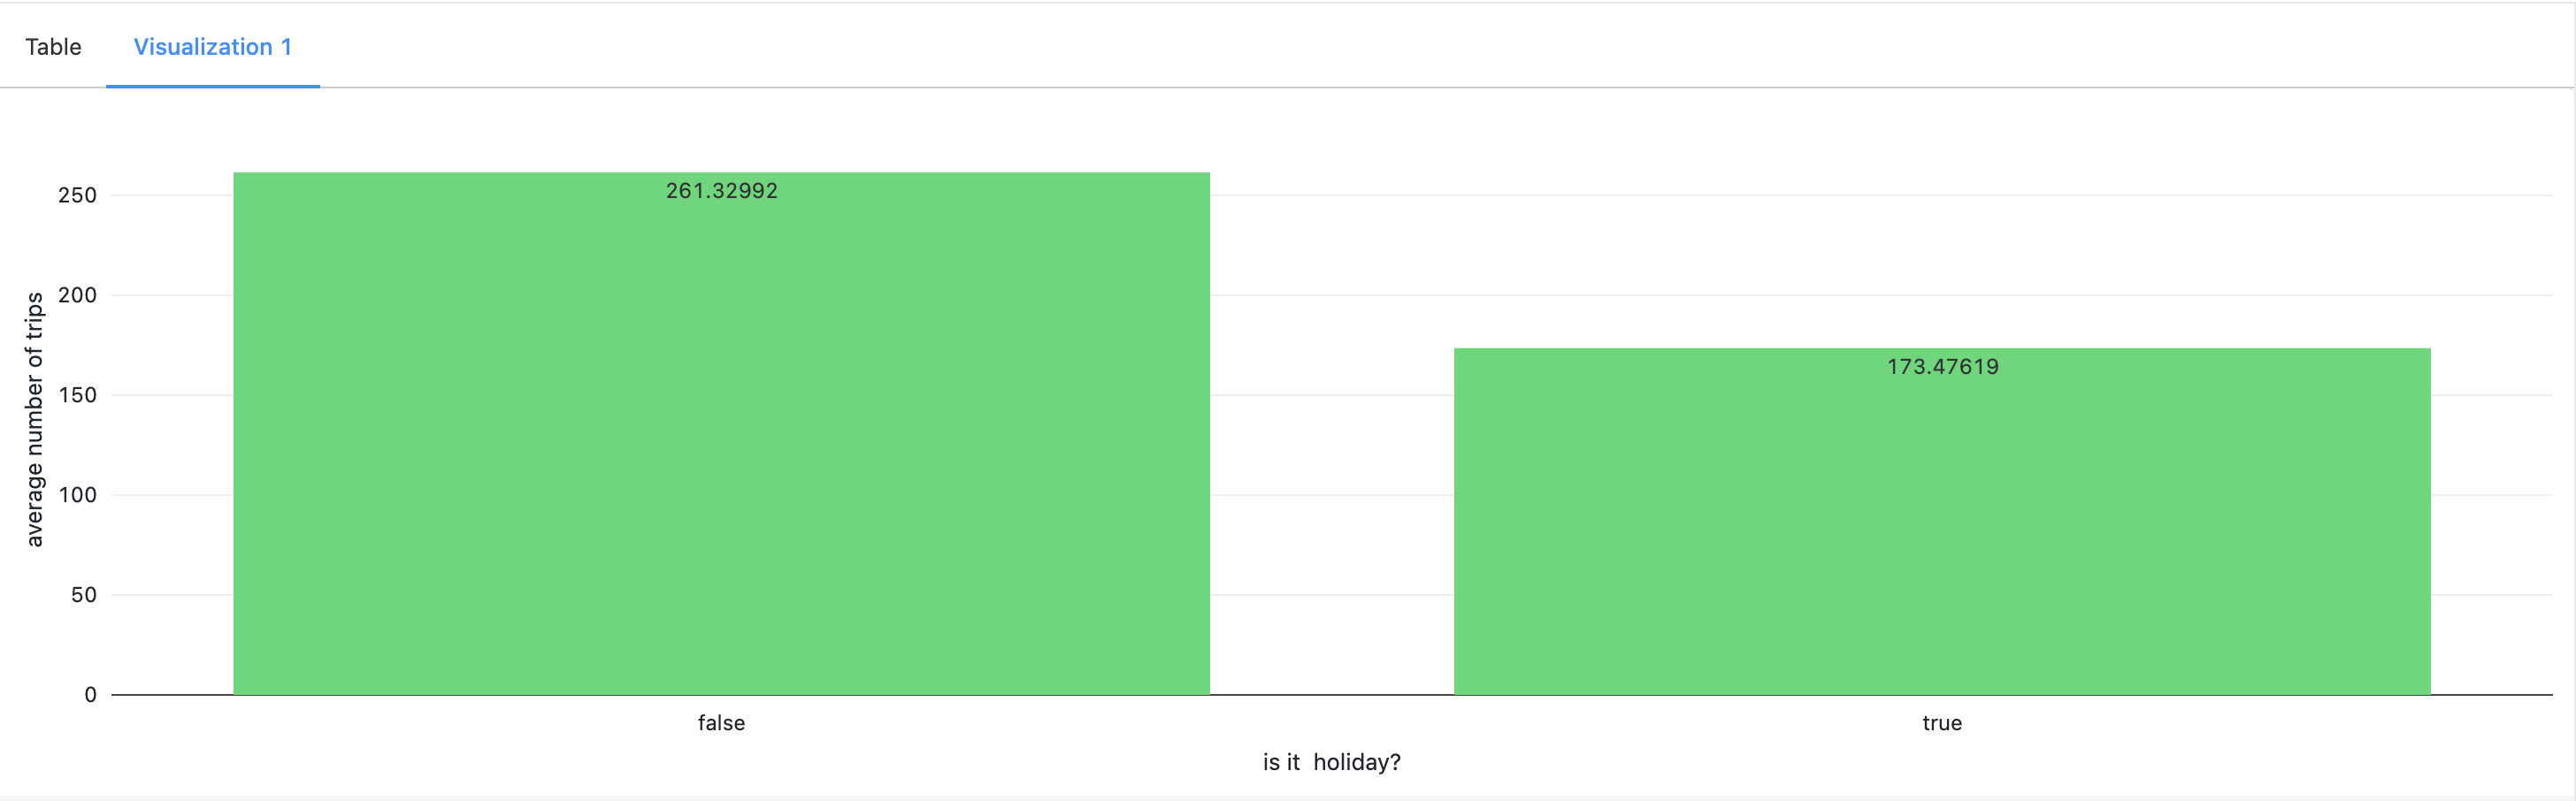
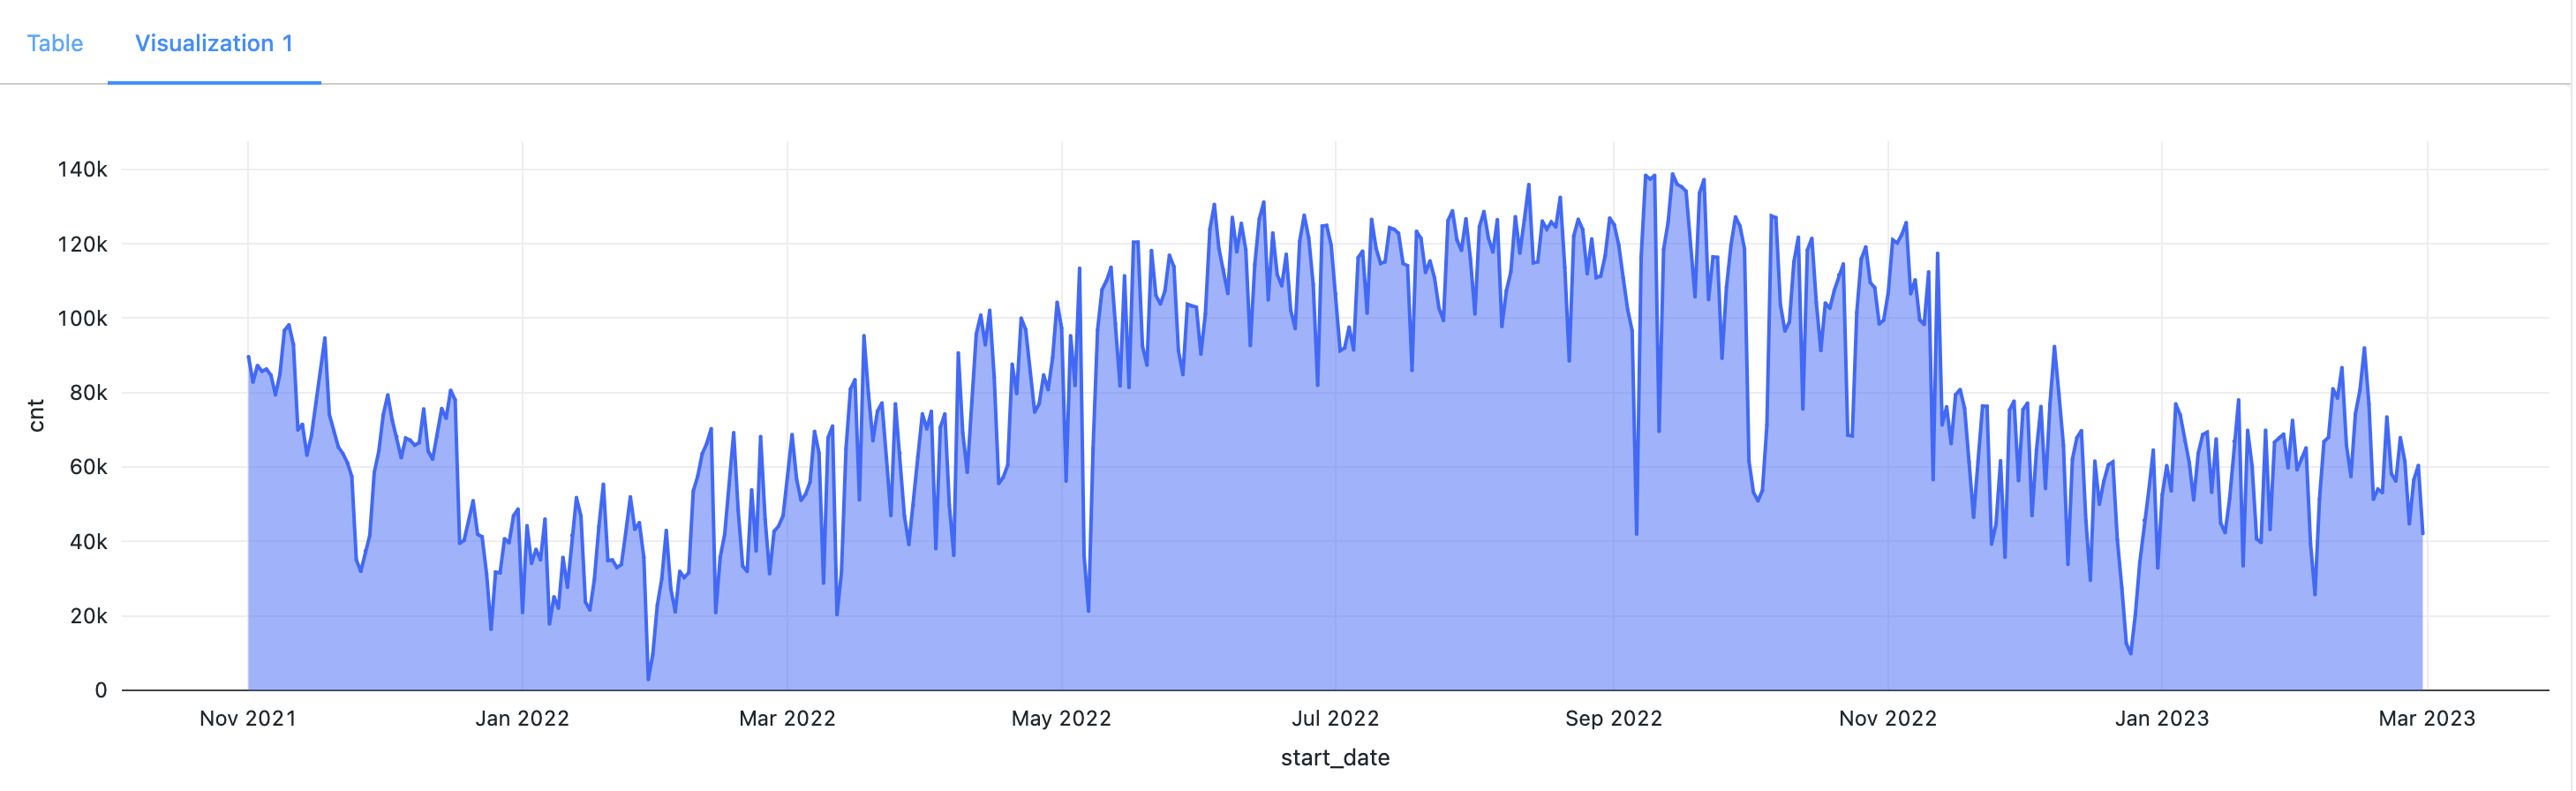
- Holiday Impact: Holidays had a notable impact on ride counts, with a decline observed during these periods. In the are plot below, significant dips in bike usage were observed on specific dates, including Thanksgiving (Nov 25, 2021), Christmas Day (Dec 25, 2021), a snowstorm (Jan 29, 2022), President's Day (Feb 21, 2022), Easter (Apr 17), and Independence Day (Jul 4). These events and holidays contributed to reduced bike activity, indicating the influence of such occasions on Citi Bikes' usage.
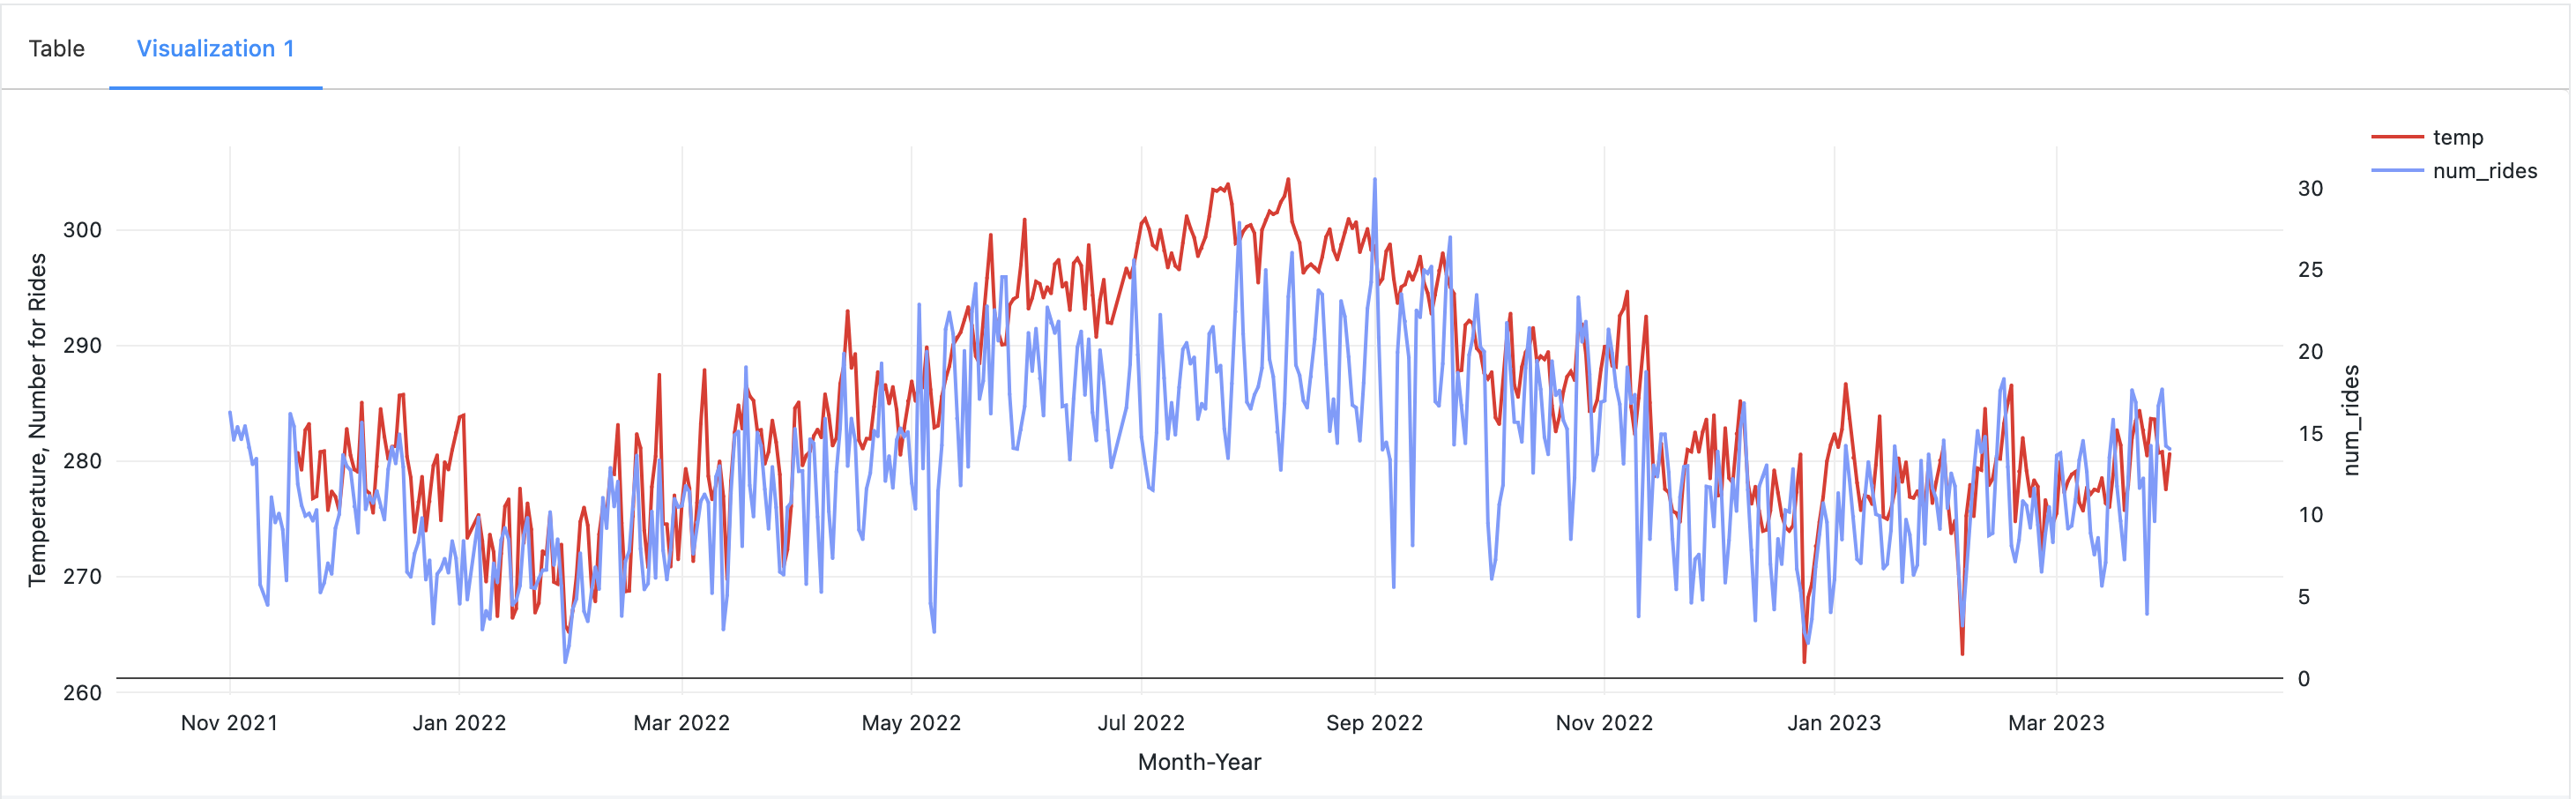
- Temperature Influence: While not a dominant factor, a significant rise in temperature was found to reduce ride counts. This observation underscores the sensitivity of ridership to changes in weather conditions.
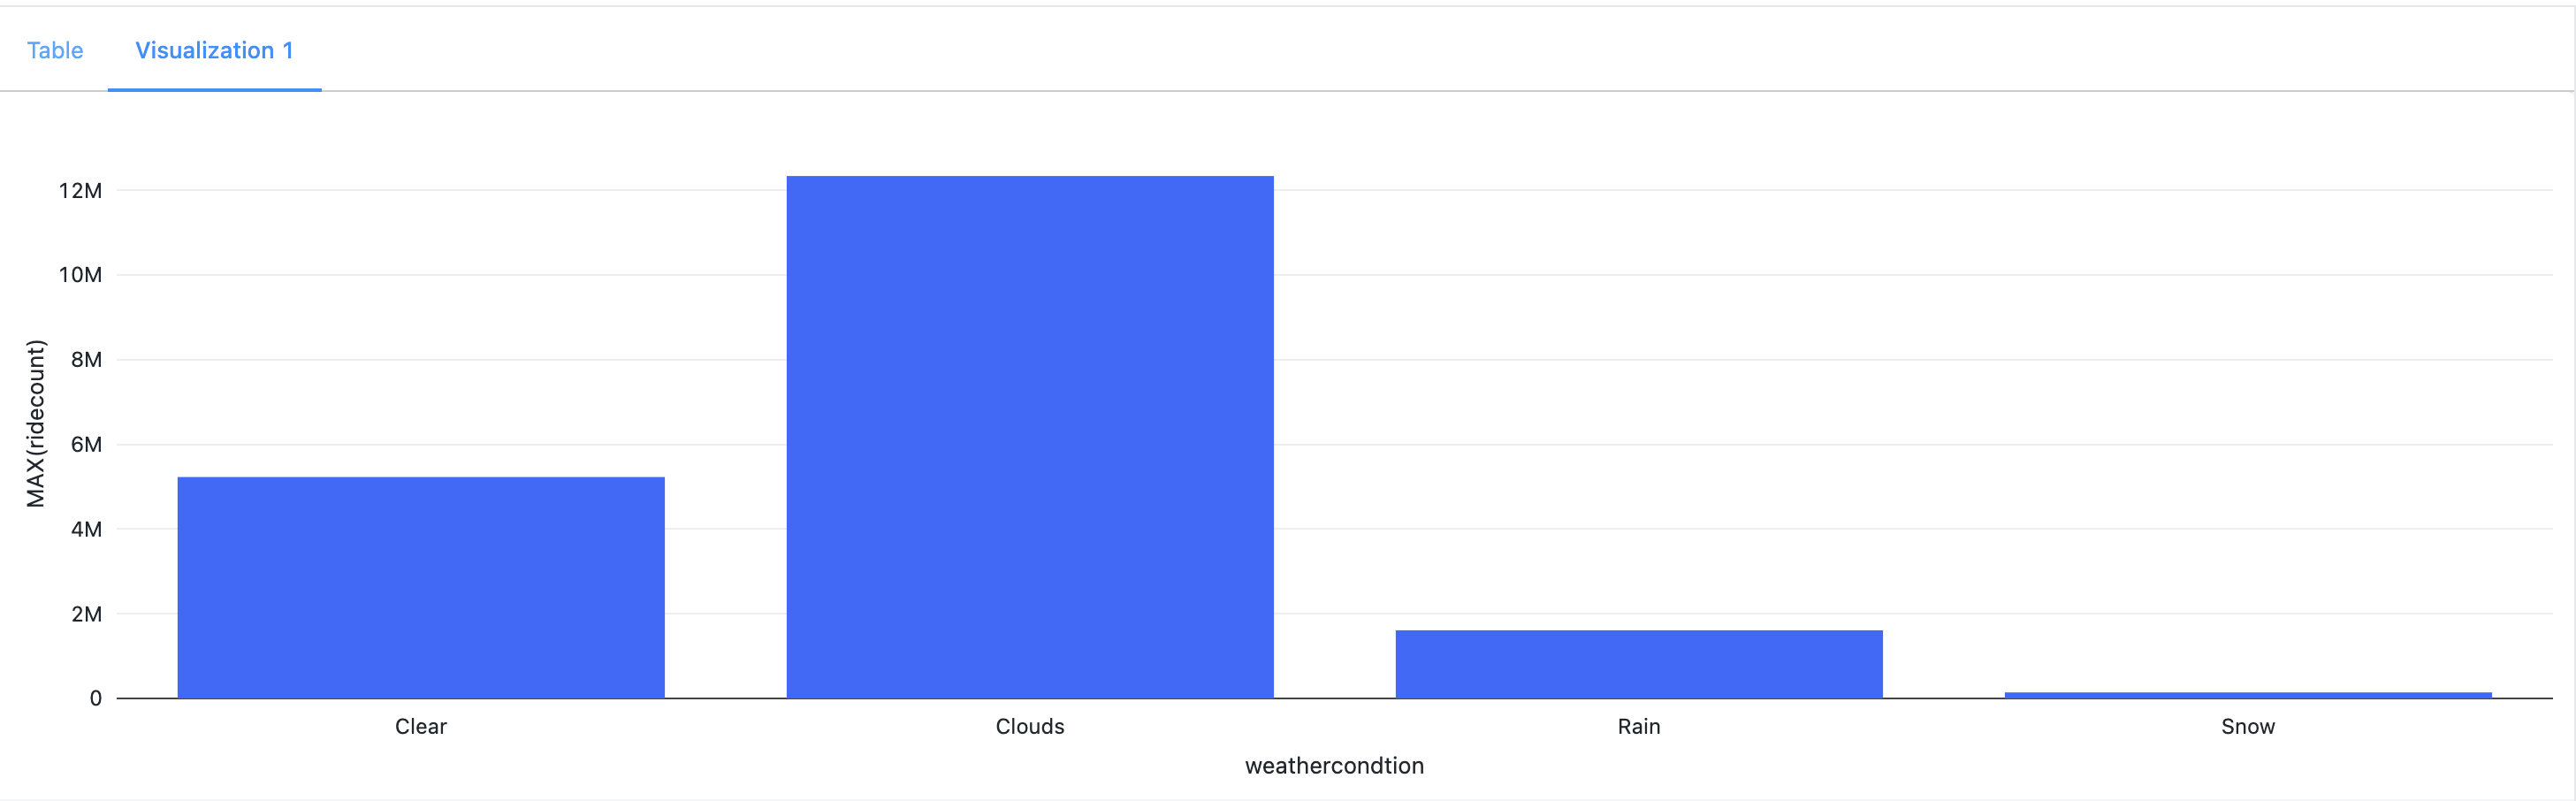
- Cloud/Visibility Effect: The graph clearly illustrates that snowy and rainy weather conditions resulted in a significant decrease in the number of rides, while riders continued to use the service during cloudy and clear sky conditions.
These findings played a critical role in informing the subsequent data modeling process, enabling the development of models tailored to improve prediction accuracy.
Link to Code: EDA File
After performing the necessary data storage and preprocessing, the next step involved building the forecasting model. In this project, we utilized the popular FB-Prophet model, which took into account the monthly, daily, and hourly seasonality patterns identified during the exploratory data analysis (EDA). Holiday effects were also incorporated into the Prophet model. To track and manage the model artifacts, parameters, and metrics, we leveraged Databrick's MLflow Tracking. This allowed us to compare different models, select the best one, and easily reuse the chosen model. Additionally, MLflow Registry facilitated the smooth transition of the best model from staging to production, ensuring that the model could be continually used based on new incoming data. Although there was options of adding different version of our model into the ML Model Registry and use only the model giving best peformance. But FB-Prophet in this case was giving much better performance than other and therefore the our model registry contained only the prophet model version which was transitioned into stage and used thereafter.
Link to Code: ML Model File
In the final phase of our project, we focused on monitoring the performance of the forecasting model as new data arrived every 30 minutes. To accomplish this, we utilized the gold tables to track the live performance of the model. This allowed us to promptly take action if the model's performance fell below a predefined threshold and update the model accordingly.
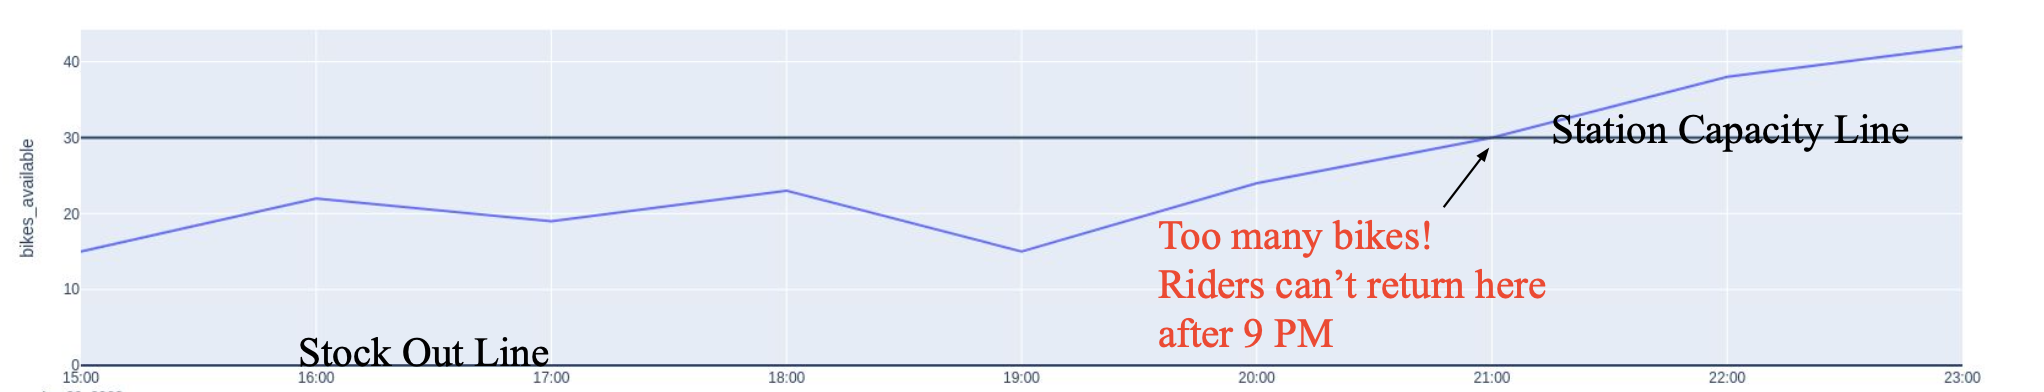
The implementation involved loading both the production and staging models, which were trained during the Model Development stage. We then loaded real-time data on the bike status at a specific station, along with real-time and forecasted weather data. The forecasted weather data served as regressors to predict bike availability in the next 48 hours. Using both the staging and production models, we forecasted the bike inventory.
To compare the performance of the staging and production models, we examined the residuals data until the ground truth data was available. Based on the residuals plot, the code was designed to promote the staging model to production when deemed appropriate.
The following image depicts the forecast that was made to understand demand at a particular station
Link to Code: Application Monitoring File
This project aimed to develop an end-to-end machine learning application to assist businesses like NY Citi Bike in understanding and addressing the demand for their services, thereby improving operational efficiency. The utilization of Databricks, with its robust capabilities, proved instrumental in processing large volumes of data efficiently. Additionally, it provided a comprehensive platform for data visualization, Python/SQL coding, and deploying and monitoring multiple models all under one umbrella. Managing multiple machine learning models, finding optimal hyperparameters, and tracking model artifacts can be challenging, but Databricks simplified these tasks through the use of ML-Flow and ML-Registry. This is particularly valuable in visualizing, maintaining and improving prediction performance and automating the overall flow. Overall, this project was a valuable learning experience, highlighting the advancements in technology and their potential to drive business growth in a competitive market.


