A decision tree is a flowchart-like structure in which each internal node represents a test on a feature (e.g. whether a coin flip comes up heads or tails) , each leaf node represents a class label (decision taken after computing all features) and branches represent conjunctions of features that lead to those class labels. The paths from root to leaf represent classification rules.
Below diagram illustrates the basic flow of decision tree for decision making with labels (Rain(Yes), No Rain(No)).
Tree based learning algorithms are considered to be one of the best and mostly used supervised learning methods. Tree based methods empower predictive models with high accuracy, stability and ease of interpretation.
Unlike linear models, they map non-linear relationships quite well. They are adaptable at solving any kind of problem at hand (classification or regression). Decision Tree algorithms are referred to as CART (Classification and Regression Trees).
The root node (the first decision node) partitions the data based on the most influential feature partitioning. There are 2 measures for this, Gini Impurity and Entropy.
The root node (the first decision node) partitions the data using the feature that provides the most information gain.
Information gain tells us how important a given attribute of the feature vectors is.
It is calculated as:
Information Gain=entropy(parent)–[average entropy(children)]
Where entropy is a common measure of target class impurity, given as:
Entropy=Σi–pilog2pi
Where i is each of the target classes.
Gini Impurity is another measure of impurity and is calculated as follows:
Gini=1–Σip2i
Gini impurity is computationally faster as it doesn’t require calculating logarithmic functions, though in reality which of the two methods is used rarely makes too much of a difference.
You can access the dataset here. Let us build a decision tree model to predict survival of the Titanic passengers based on certain parameters:
- Pclass
- Sex
- Age
- Fare
Let us straightaway get into the coding part. First, import the libraries, and read the data.
 import pandas as pd

 data=pd.read_csv('titanic.txt')
 data.head()
It is mentioned that only 4 parameters listed above need to be chosen. So, drop the remaining columns that are not necessary from the dataset.
d=data.drop(['PassengerId','Name','SibSp','Parch','Ticket','Cabin','Embarked'],axis='columns')
print(d)
print()
We can not handle non-numerical data while computing. But, you can observe that the column Sex has non-numerical data. To convert this into numerical data, we make use of dummy variables, and concatenate these columns into our original dataset. A Dummy variable or Indicator Variable is an artificial variable created to represent an attribute with two or more distinct categories/levels. For more information on dummy variables, click here.
dummies=pd.get_dummies(d['Sex'])
merge=pd.concat([d,dummies],axis=1)
merge
The column Survived is our target dataframe. Now, we create an input dataframe. This can simply be done by dropping the column Survived , and the column Sex (because we have already created dummy variables for it) from our dataset.
input=merge.drop(['Survived','Sex'],axis='columns')If you observe the dataset, you can see that the column Age has NaN values, which the interpreter can't handle. So, you can get rid of them by using the fillna() method, and replace the NaN values with 0. And also, create a target dataframe of the column Survived.
input=input.fillna(value=0)
target=d['Survived']The data we use is usually split into training data and test data. The training set contains a known output and the model learns on this data in order to be generalized to other data later on. We have the test dataset (or subset) in order to test our model’s prediction on this subset.
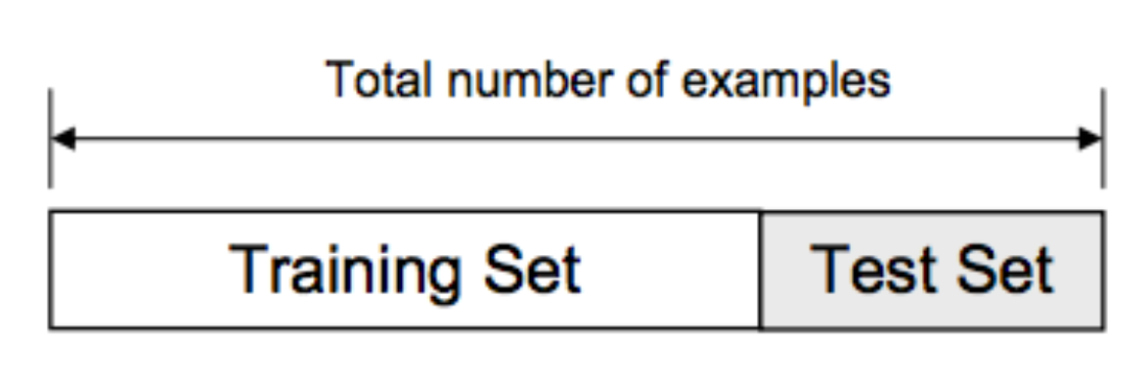
Let’s see how to do this in Python. We’ll do this using the Scikit-Learn library and specifically the train_test_split method. We’ll start with importing the necessary libraries, and then we use the train_test_split function in order to make the split.
The test_size=0.2 inside the function indicates the percentage of the data that should be held over for testing. It’s usually around 80/20 or 70/30.
The random_state parameter is used for initializing the internal random number generator, which will decide the splitting of data into train and test indices in your case.
from sklearn.model_selection import train_test_split

X_train,X_test,Y_train,Y_test= train_test_split(input,target,test_size=0.2,random_state=10)
Decision Tree Classifier Building in Scikit-learn
from sklearn import tree
model = tree.DecisionTreeClassifier(criterion=’gini’) # for classification, here you can change the algorithm as gini or entropy (information gain) . By default, it is gini
Let us take a look at X_train (80% of the data set)
X_trainTrain the model using the training sets and check score
model.fit(X_train,Y_train)
model.score(X_test,Y_test)
Predict output
predicted = model.predict(x_test)
print(predicted)
#or
model.predict([[3,27,16,1,0]])
The entire code is available at Github.
