Giter Club home page Giter Club logo

datasette-vega's Introduction

datasette-vega

PyPI License

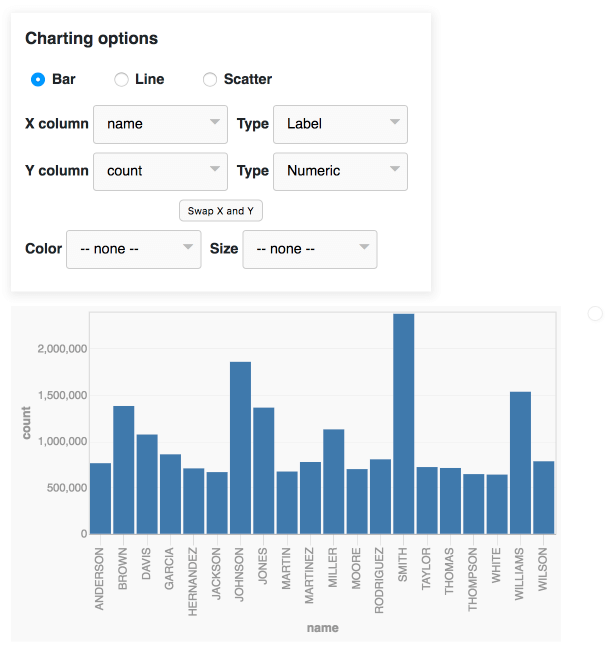
A Datasette plugin that provides tools for generating charts using Vega.

Datasette Vega interface

Try out the latest master build as a live demo at https://datasette-vega-latest.datasette.io/ or try the latest release installed as a plugin at https://fivethirtyeight.datasettes.com/

To add this to your Datasette installation, install the plugin like so:

pip install datasette-vega

The plugin will then add itself to every Datasette table view.

If you are publishing data using the datasette publish command, you can include this plugin like so:

datasette publish now mydatabase.db --install=datasette-vega

datasette-vega's People

Stargazers

 avatar  avatar  avatar  avatar  avatar  avatar  avatar  avatar  avatar  avatar  avatar  avatar  avatar  avatar  avatar  avatar  avatar  avatar  avatar  avatar  avatar  avatar  avatar  avatar  avatar  avatar  avatar  avatar  avatar  avatar  avatar  avatar  avatar  avatar  avatar  avatar  avatar  avatar  avatar  avatar  avatar  avatar  avatar  avatar  avatar  avatar  avatar  avatar  avatar  avatar  avatar  avatar  avatar  avatar  avatar

Watchers

 avatar  avatar  avatar

datasette-vega's Issues

feature: permit supplying an arbitrary vega-lite specification

Motivation

  • Several features (#45, #39, #38, #26, #25, #22, #19) could be addressed without building additional UI elements if we gave users the ability to supply their own vega-lite definitions.

Proposed change

  • Add a button which toggles a text box into which the existing Vega spec can be customized. Similar to how the SQL query editor stops displaying once you make a custom SQL query, if someone opts into using this "full customization" mode, they will lose the ability to use the usual field/scale selection options.
  • May need to add a URL parameter to store a compressed representation of the vega spec in the URL parameters if we want these customizations to be shareable

Workarounds

  • If the datasette instance is public, they can link to the current query results and customize the vega spec somewhere else, e.g.

"Hide" button

It would be nice if it was possible to close the graph UI after having opened it.

Charting option defaults: Timeseries

Suggest that for any table that has date-related information, the X axis defaults to a date-typed field with the date type selected. For most Tidy Data, this will be the only date, and will save considerable time setting up sensible charting options.

Migrate to GitHub Actions

This is still on Travis, and builds are failing because now rebranded to vercel and needs a new authentication token.

Allow aggregate operations

Currently, it's not possible to get a graph of the number of rows in a set by a given category/label. You can use a column as Numeric, but that will sum all the instances of that column together. Vega has aggregate functions, including count, but they aren't included in the Datasette-Vega UI at this point.

log scale option?

many numbers in real life follow power laws:

image

this necessitates display on a log scale for any useful visualization at all. interested? I'd be interested to contribute such a feature, though I've had a look at the code and dont have an idea of where it is consumed for implementation so a few pointers would help (or if you want to do this more comprehensively with an explicit scale option, be my guest)

Needs a progress indicator

Sometimes datasette-vega can take many seconds to display and render a chart - but there's no indication that it's doing anything, so it feels like the tool is broken.

Preserve given ordering

Currently, datasette-vega does not preserve the ordering of output. It would be great to be able to show largest-to-smallest plots. The current ordering appears to be alphabetically (case-sensitively, i.e. A-Z, then a-z) on the x axis.

Example: Showing open Django tickets by component. The query was

SELECT component, count(*) as n
FROM tickets_full
WHERE has_patch=0
  AND stage='Accepted'
  AND status='new'
GROUP BY component
ORDER BY n DESC;

This results in this tabular output:
Screenshot_2019-07-22 django_tickets select component, count( ) as n from tickets_full where has_patch=0 and stage='Accepte

But in this graph:
Screenshot_2019-07-22 django_tickets select component, count( ) as n from tickets_full where has_patch=0 and stage='Accepte (1)

Charting options: adjusting axis options

When selecting a field for a plot dimension, it could be removed from other dimensional menus, speeding up selection process. If one wishes to shift allocation (other than swapping X and Y) one can set a dimension selection to --none--, which makes the field available to all dimensional menus, where it can be selected appropriately.

If implemented alongside the suggestion of defaulting the assignment of a Date field to X axis for timeseries, this would speed up the graphing of simple timeseries by a factor of two, since then there is only one selection/assignment that needs to be made.

Relatedly, when selecting a field for a dimension, it would be nice to change the data type of the dimension to change from an incompatible type to a compatible type. Thus, if switching from a Label-like field to a Numeric-like field, the Type selector would switch from Label to Numeric (and could be changed to Numeric-bin). If switching from one Numeric-like field to another Numeric-like field, the type selector would not automatically revert from Numeric-bin to Numeric (nor vice-versa). But if switching from a Date field dimension to a Numeric field dimension, it would change type from Date or Date-bin to Numeric, though that could be changed back if one wanted to intervene manually.

If both of the above is also implemented, it could speed up the graphing of a simple timeseries by a factor of four, since the selection of the Y-axis variable would (in most cases) set the Type correctly as well.

Maybe check for `columns` rather than looking at `view_name`

diff --git a/datasette_vega/__init__.py b/datasette_vega/__init__.py
index ac80b52..ba69145 100644
--- a/datasette_vega/__init__.py
+++ b/datasette_vega/__init__.py
@@ -17,12 +17,12 @@ def cached_filepaths_for_extension(extension):
 
 
 @hookimpl
-def extra_css_urls(view_name):
-    if view_name == "table":
+def extra_css_urls(columns):
+    if columns:
         return cached_filepaths_for_extension("css")
 
 
 @hookimpl
-def extra_js_urls(view_name):
-    if view_name == "table":
+def extra_js_urls(columns):
+    if columns:
         return cached_filepaths_for_extension("js")

Multiple charts (layers?)

First, thanks for datasette and datasette-vega!

I wanted to establish whether there might be any appetite for the ability to plot visualisations for multiple different columns on the same graph? I believe Vega calls these "layers".

This would make the charts much more useful, I think. For example, you could plot the daily values for a series as well as a moving average, or display multiple centiles, etc.

I imagine, at the most basic level, the UI would grow a + button below the existing chart config to add extra layers. I am aware this would make things conceptually much more complicated. Would it be necessary to enforce that the x and y axes for each layer represent the same value? It would technically be possible to have the right y axis be a different scale, but then what about additional layers? Would reordering be necessary? Would this make sense for all chart types (eg bar charts?)

The URL structure would also have to change to accomodate this - maybe #g.mark=line&g.x_column=date&g.x_type=temporal&g.y_column=count_per_day&g.y_type=quantitative&g.mark_1=line&g.x_column_1=date&g.x_type_1=temporal&g.y_column_1=five_day_moving_avg&g.y_type_1=quantitative or something similar (ie make the defaults with no _<number> postfix imply layer 0 to maintain backwards compatibility).

I am tentatively happy to give this a go, although I'm not really familiar with Vega and wouldn't call myself a brilliant JavaScript programmer so I am most likely not the right person. I also notice this repo hasn't seen much in the way of merges in some time, so I wondered if this is still a supported approach or whether something better is in the works?

Anyway, thanks for reading!

Persist current #g.xx graph settings across page reloads

e.g. here: https://fivethirtyeight.datasettes.com/fivethirtyeight-ac35616?sql=select+user%2C+state%2C+sum%28retweets%29+as+rt+from+%5Btwitter-ratio%2Fsenators%5D+group+by+user%2C+state+order+by+rt+desc+limit+20#g.mark=bar&g.x_column=user&g.x_type=ordinal&g.y_column=rt&g.y_type=quantitative&g.color_column=state

It should be possible to edit the SQL (to increase the limit for example), click "Run SQL" and have the current graph state apply to the new page.

This can be done by having JavaScript modify the form action and turn it into the following:

<form class="sql" 
  method="get" 
  action="/fivethirtyeight-ac35616#g.mark=bar&amp;g.x_column=user&amp;g.x_type=ordinal&amp;g.y_column=rt&amp;g.y_type=quantitative&amp;g.color_column=state"
>

Browsers will then maintain the fragment hash when the form is submitted.

Live demo of datasette-vega seems to have problems with cors

When I got to https://datasette-vega-latest.datasette.io/ and click on the button with the pre-set URL in the text entry form, the show charting button that appears doesn't do anything (apart from disappear) when you click on it.

Checking the javascript console log shows me this:

Access to fetch at 'https://fivethirtyeight.datasettes.com/fivethirtyeight-45d758d/nba-elo%2Fnbaallelo.json?_shape=array&_shape=array' from origin 'https://datasette-vega-latest.datasette.io' has been blocked by CORS policy: No 'Access-Control-Allow-Origin' header is present on the requested resource. If an opaque response serves your needs, set the request's mode to 'no-cors' to fetch the resource with CORS disabled.
DatasetteVega.js:76          GET https://fivethirtyeight.datasettes.com/fivethirtyeight-45d758d/nba-elo%2Fnbaallelo.json?_shape=array&_shape=array net::ERR_FAILED 302
value @ DatasetteVega.js:76
dr @ react-dom.production.min.js:219
fr @ react-dom.production.min.js:212
cr @ react-dom.production.min.js:211
ur @ react-dom.production.min.js:211
ir @ react-dom.production.min.js:209
Zn @ react-dom.production.min.js:207
Or @ react-dom.production.min.js:224
jr @ react-dom.production.min.js:225
Tr.render @ react-dom.production.min.js:232
(anonymous) @ react-dom.production.min.js:236
mr @ react-dom.production.min.js:222
Ar @ react-dom.production.min.js:236
render @ react-dom.production.min.js:238
(anonymous) @ index.js:58
DatasetteVega.js:76                  Uncaught (in promise) TypeError: Failed to fetch
    at t.value (DatasetteVega.js:76:5)
    at dr (react-dom.production.min.js:219:329)
    at fr (react-dom.production.min.js:212:214)
    at cr (react-dom.production.min.js:211:277)
    at ur (react-dom.production.min.js:211:113)
    at ir (react-dom.production.min.js:209:244)
    at Zn (react-dom.production.min.js:207:316)
    at Or (react-dom.production.min.js:224:426)
    at jr (react-dom.production.min.js:225:215)
    at Tr.render (react-dom.production.min.js:232:351)
value @ DatasetteVega.js:76
dr @ react-dom.production.min.js:219
fr @ react-dom.production.min.js:212
cr @ react-dom.production.min.js:211
ur @ react-dom.production.min.js:211
ir @ react-dom.production.min.js:209
Zn @ react-dom.production.min.js:207
Or @ react-dom.production.min.js:224
jr @ react-dom.production.min.js:225
Tr.render @ react-dom.production.min.js:232
(anonymous) @ react-dom.production.min.js:236
mr @ react-dom.production.min.js:222
Ar @ react-dom.production.min.js:236
render @ react-dom.production.min.js:238
(anonymous) @ index.js:58
Promise.then (async)
value @ DatasetteVega.js:76
dr @ react-dom.production.min.js:219
fr @ react-dom.production.min.js:212
cr @ react-dom.production.min.js:211
ur @ react-dom.production.min.js:211
ir @ react-dom.production.min.js:209
Zn @ react-dom.production.min.js:207
Or @ react-dom.production.min.js:224
jr @ react-dom.production.min.js:225
Tr.render @ react-dom.production.min.js:232
(anonymous) @ react-dom.production.min.js:236
mr @ react-dom.production.min.js:222
Ar @ react-dom.production.min.js:236
render @ react-dom.production.min.js:238
(anonymous) @ index.js:58
recording.mp4

404 Errors with Vega Behind Firewall

Datasette is working flawlessly for me but the vega plugin is giving 404 errors (behind a firewall) . Does it look on some non-standard port?

INFO: ('10.55.103.32', 64643) - "GET /capture_genotyping_database_V1.3/fastqdata HTTP/1.1" 200
INFO: ('10.55.103.32', 64642) - "GET /-/static/app.css?764a78 HTTP/1.1" 404
INFO: ('10.55.103.32', 64641) - "GET /-/static-plugins/datasette_vega/main.2acbb312.css HTTP/1.1" 404
INFO: ('10.55.103.32', 64640) - "GET /-/static-plugins/datasette_vega/main.08f5d3d8.js HTTP/1.1" 404
INFO: ('10.55.103.32', 64643) - "GET /favicon.ico HTTP/1.1" 200

Tooltips

Vega supports tooltips, but I haven't yet been able to get them to work within this plugin.

Feature Request: 'x' to close chart

We can open a chart, but not close it, as far as I can tell. Would be nice to be able to 'x' it to close, without having to know how to delete url fragments.

BUG: Inaccurate Chart

https://github.com/mroswell/list-N

Full dataset has at least one missing "Toxic" Display.

4iLcS1616985789

https://list-n.vercel.app/listN/listN#g.mark=bar&g.x_column=Company&g.x_type=ordinal&g.y_column=Safer_or_Toxic&g.y_type=ordinal

Filtered dataset accurately shows both Safer and Toxic status

112669873-968af780-8e36-11eb-80cf-7caef424e03c

(Having some trouble with deployment at the moment. Will update this issue with a fuller report when I can. UPDATE: Dunno. no charts at all now, or all empty. Weird. Well, consider this to be a report as an accurate description from when charts were displaying.)

Styling for the UI

It currently looks like this:

2018-06-26 at 7 51 am

It should look like a cross between these two existing Datasette elements:

2018-06-26 at 7 52 am

2018-06-26 at 7 52 am

Untracked file: package-lock.json

I wanted to install this, so I run pip3 install --user --use-feature=in-tree-build --compile --no-binary ":all" --verbose . in the git checkout directory. At the end git status says:

Untracked files:
  (use "git add <file>..." to include in what will be committed)
	package-lock.json

It probably should be added to .gitignore, but on the other hand maybe the build and installation process needs to be improved.

I used --use-feature=in-tree-build because pip says this will be the future.


$ pip3 --version
pip 21.2.3 from /usr/lib/python3.10/site-packages/pip (python 3.10)
$ npm --version
8.1.0

Not obvious that vega charts are plotted only for rows on the visible page

I filtered a data set on some criteria and obtain 265 results, split over three pages (100, 100, 65), and reazlized that Vega plots are only applied to the results displayed on the current page, instead of the whole filtered data, e.g., 100 on page 1, 100 on page 2, 65 on page 3. Is there a way to force the graphs to consider all results instead of just the page, considering that pages rarely represent sensible information?

Likewise, while the cluster map does show all results on the first page, if you go to next pages, it will show all remaining results except the previous page(s), e.g., 265 on page 1, 165 on page 2, 65 on page 3.

In both cases, I don't see many situations where one would like to represent the data this way, and it might even lead to interpretation errors when viewing the data. Am I missing some cases where this would be best? Perhaps a clickable option to subset visual representations according visible pages vs. display all search results would do?

[Edit] Oh, I just saw the "Load all" button under the cluster map as well as the setting to alter the max number or results. So I guess this issue only is about the Vega charts.

Feature Request: Disaggregate array fields

Datasette offers the wonderful feature of being able to facet by items in an array. But this doesn't carry over to the charts. Would make charts ever-so-much nicer if that feature carried over.
You can see the issue in this sample screenshot:
Screen Shot 2021-04-05 at 10 15 09 PM

Handle ?_labels=on

The charting tool breaks with ?_labels=on at the moment. It should instead make use of the resolved foreign key labels and make them available to be charted.

Dev environment should act differently from production bundle

The production bundle (npm run build) should create a plugin that works when embedded into a Datasette page.

In development, I still want to retain live reloading and have an interface that allows me to paste in the URL of an arbitrary Datasette instance somewhere.

Chart suggestions

When the page first loads the plugin should come up with 1-3 chart suggestions with human descriptions and display those as options. Clicking an option will open the graphing tool pre-configured for the selected suggestion.

For example..

Suggested charts: name against goose eggs, name against league_average_gpct

Maybe even suggest some bar charts and some scatter charts (and maybe a line chart if the data is obviously temporal).

Fix upload to PyPI of new release tags

It failed with an error, so I did the first release by hand:

https://travis-ci.com/simonw/datasette-vega/jobs/131529892

1.56s$ pip install -U pip wheel
/usr/local/lib/python2.7/dist-packages/pip/_vendor/requests/packages/urllib3/util/ssl_.py:318: SNIMissingWarning: An HTTPS request has been made, but the SNI (Subject Name Indication) extension to TLS is not available on this platform. This may cause the server to present an incorrect TLS certificate, which can cause validation failures. You can upgrade to a newer version of Python to solve this. For more information, see https://urllib3.readthedocs.io/en/latest/security.html#snimissingwarning.
  SNIMissingWarning
/usr/local/lib/python2.7/dist-packages/pip/_vendor/requests/packages/urllib3/util/ssl_.py:122: InsecurePlatformWarning: A true SSLContext object is not available. This prevents urllib3 from configuring SSL appropriately and may cause certain SSL connections to fail. You can upgrade to a newer version of Python to solve this. For more information, see https://urllib3.readthedocs.io/en/latest/security.html#insecureplatformwarning.
  InsecurePlatformWarning
Collecting pip
/usr/local/lib/python2.7/dist-packages/pip/_vendor/requests/packages/urllib3/util/ssl_.py:122: InsecurePlatformWarning: A true SSLContext object is not available. This prevents urllib3 from configuring SSL appropriately and may cause certain SSL connections to fail. You can upgrade to a newer version of Python to solve this. For more information, see https://urllib3.readthedocs.io/en/latest/security.html#insecureplatformwarning.
  InsecurePlatformWarning
  Downloading https://files.pythonhosted.org/packages/0f/74/ecd13431bcc456ed390b44c8a6e917c1820365cbebcb6a8974d1cd045ab4/pip-10.0.1-py2.py3-none-any.whl (1.3MB)
/usr/local/lib/python2.7/dist-packages/pip/_vendor/requests/packages/urllib3/util/ssl_.py:122: InsecurePlatformWarning: A true SSLContext object is not available. This prevents urllib3 from configuring SSL appropriately and may cause certain SSL connections to fail. You can upgrade to a newer version of Python to solve this. For more information, see https://urllib3.readthedocs.io/en/latest/security.html#insecureplatformwarning.
  InsecurePlatformWarning
Collecting wheel
  Downloading https://files.pythonhosted.org/packages/81/30/e935244ca6165187ae8be876b6316ae201b71485538ffac1d718843025a9/wheel-0.31.1-py2.py3-none-any.whl (41kB)
Installing collected packages: pip, wheel
  Found existing installation: pip 9.0.1
    Uninstalling pip-9.0.1:
Exception:
Traceback (most recent call last):
  File "/usr/local/lib/python2.7/dist-packages/pip/basecommand.py", line 215, in main
    status = self.run(options, args)
  File "/usr/local/lib/python2.7/dist-packages/pip/commands/install.py", line 342, in run
    prefix=options.prefix_path,
  File "/usr/local/lib/python2.7/dist-packages/pip/req/req_set.py", line 778, in install
    requirement.uninstall(auto_confirm=True)
  File "/usr/local/lib/python2.7/dist-packages/pip/req/req_install.py", line 754, in uninstall
    paths_to_remove.remove(auto_confirm)
  File "/usr/local/lib/python2.7/dist-packages/pip/req/req_uninstall.py", line 115, in remove
    renames(path, new_path)
  File "/usr/local/lib/python2.7/dist-packages/pip/utils/__init__.py", line 267, in renames
    shutil.move(old, new)
  File "/usr/lib/python2.7/shutil.py", line 303, in move
    os.unlink(src)
OSError: [Errno 13] Permission denied: '/usr/local/bin/pip'
/usr/local/lib/python2.7/dist-packages/pip/_vendor/requests/packages/urllib3/util/ssl_.py:122: InsecurePlatformWarning: A true SSLContext object is not available. This prevents urllib3 from configuring SSL appropriately and may cause certain SSL connections to fail. You can upgrade to a newer version of Python to solve this. For more information, see https://urllib3.readthedocs.io/en/latest/security.html#insecureplatformwarning.
  InsecurePlatformWarning
You are using pip version 9.0.1, however version 10.0.1 is available.
You should consider upgrading via the 'pip install --upgrade pip' command.

Preserve cache-busting URL prefix on .js and .css

Right now the setup.py build phase renames these to just datasette-vega.js - but if we keep the cache busting hash they will be compatible with far-future HTTP cache headers.

Since the JS bundle is huge this seems worthwhile.

datasette-vega/setup.py

Lines 34 to 37 in e6c0fec

check_output(['npm', 'run', 'build'], cwd=ROOT)
check_output(['mkdir', '-p', 'datasette_vega/static'], cwd=ROOT)
check_output("mv build/static/js/*.js datasette_vega/static/datasette-vega.js", shell=True, cwd=ROOT)
check_output("mv build/static/css/*.css datasette_vega/static/datasette-vega.css", shell=True, cwd=ROOT)

Modifiable vega-lite?

We'll leave learning vega-lite to the user, but I wasn't sure how to create an instance where I can tweak the chart format. I do see the little white circle that offers the ability to open in the vega-lite editor. But the chart there is blank. The only way it carries over the data is as a partial url in the json definition. Can anyone document how to get a live instance that's modifiable? For instance, tweaking color, size, or chart type or anything else that vega-lite offers... using our own data.

Hmm... looks like we just need to carry over the 'http://example.com' portion of the URL into the "url" value. (Though I've had mixed success with this. Usually getting "[Warning] Loading failed" even if the JSON url is accurate. My table has less than 550 records. I wonder if the incomplete URL version just somehow got cached somewhere along the line.)

UPDATE: I was missing the 's' after 'http' and the vega-lite editor didn't like that.

So it looks like we just have to carry over the full url, and we'd be able to edit the vega-lite chart to our heart's content.

Recommend Projects

  • React photo React

    A declarative, efficient, and flexible JavaScript library for building user interfaces.

  • Vue.js photo Vue.js

    ๐Ÿ–– Vue.js is a progressive, incrementally-adoptable JavaScript framework for building UI on the web.

  • Typescript photo Typescript

    TypeScript is a superset of JavaScript that compiles to clean JavaScript output.

  • TensorFlow photo TensorFlow

    An Open Source Machine Learning Framework for Everyone

  • Django photo Django

    The Web framework for perfectionists with deadlines.

  • D3 photo D3

    Bring data to life with SVG, Canvas and HTML. ๐Ÿ“Š๐Ÿ“ˆ๐ŸŽ‰

Recommend Topics

  • javascript

    JavaScript (JS) is a lightweight interpreted programming language with first-class functions.

  • web

    Some thing interesting about web. New door for the world.

  • server

    A server is a program made to process requests and deliver data to clients.

  • Machine learning

    Machine learning is a way of modeling and interpreting data that allows a piece of software to respond intelligently.

  • Game

    Some thing interesting about game, make everyone happy.

Recommend Org

  • Facebook photo Facebook

    We are working to build community through open source technology. NB: members must have two-factor auth.

  • Microsoft photo Microsoft

    Open source projects and samples from Microsoft.

  • Google photo Google

    Google โค๏ธ Open Source for everyone.

  • D3 photo D3

    Data-Driven Documents codes.