I attended the Vancouver Hockey Analytics Conference on March 11, 2017. I had a good time listening to all the speakers and meeting other hockey nerds. Below is a summary of some of the presentations and a review on them.
The first presentaion was a Sportsnet Panel featuring Dmitri Filipovic and Dan Murphy. Below you will see the a few of the questions listed with a summary of their answers.
How do stats effect your job?
Statistics eliminate lazy reporting, as it is much easier to go and fact check work and requires you to think outside of the box. In the past, game sheets were used to decide who had the best game that night and game sheets have very limited stats (best game was usally decided by goals and assists stats only). Additionally during games you can only watch so much, so stats help you see the full picture.
How does using statistical analysis effect your job? (Similar question, I know)
While doing broadcasts, it takes time to tell the story of the statistic. The statistics are evolving at a rate greater than a lot of the audience can understand. A way to improve statistics is to get rid of a lof the terms for the new stats and describing what these stats actually mean. Also, a good way of describing a stat that a lot of people can relate to would be saying "Player X" had a points per 60 between Sidney Crosby and Patrick Kane, this way more of the audience can relate to it.
What are some of the things that data scientists can do to make things more acceptable for the average fan?
- Visualizations are something that everyone can relate to, include more visualizations whenever possible.
- Make Corsi Percentage more mainstream - include it in the game sheet.
- Take the time to describe what some of these statistics mean
Tell me a moment where you were wrong about a player or idea?
There is some merit when a player tells you something; for example regardless of what the statistics say, a lot of players would rather go up against Erik Karlsson then have to play against Shea Weber. Going into the corner with Erik Karlsson, more often than not, he pokes the puck away from you and goes out on a rush, while going into the corner with Shea Weber you will feel it days later.
For hockey analytics to be successful, the statistics need to get to a point where the average fan understands them. Right now there are way too many random statistics and not enough explanation of what they actually mean. Dan works on the broadcast team for the Canucks and had a lot of first hand knowledge of the players. Dan specifically mentioned ttalking to an unnamed player about playing against Karlsson vs Weber and the punishment that you take going against Weber. Dan also mentioned examples of good player/bad teammate and talked about Mike Richards, Mike Ribeiro, and Ryan Kesler being examples of this. I had head rumors of both Richards/Ribeiro being examples of this, but was surprised that Ryan Kesler was also on the list.
The next presentation was Using Statistical Analysis to Help Win Games in Major Junior Hockey by Mark Francis. Mark works for the Kelowna Rockets in their department of Analytics. The majority of Mark’s presentation can be seen here.
Mark first discussed the difficulties of statistical analysis in Major Junior Hockey
- Large spread in performance and skill (large standard deviation in skill and performance compared to the NHL)
- There are more penalties, so more special teams play than in the NHL
- Higher shooting percentages
- Short windows to evaluate players
- Limited amount of data available (lot of stats have to be collected in real time)
Like the last talk making the statistics relatable, this time to a 15-18 year old, is the main challenge. Mark mentioned they were trying to increase the number of effort plays early in the game (he considered hits and shots to be effort plays), to make this relatable to the young men they named the metric “shits” (shots + hits). Downside from this presentation was we were not able to see any examples of the data analytics that he is doing (protecting his job), but we mainly just got a look into the differences between Major Junior hockey and NHL statistics.
The next presenter was Namita Nandakumar, whose presentation was titled What Does it Mean to Draft Perfectly in the NHL? Her presentation can be viewed here and she wrote an accompanying Python script that can be found here.
Namita used game theory to see which teams drafted the best and what does it mean to draft perfectly. Namita argued that to draft perfectly not only means to pick talented/productive players in the draft, but also to waiting to pick them until absolutely necessary (read: not picking the player until you know another team is wanting to take him). For example Jamie Benn has the highest point shares of any player in the 2007 NHL draft and was not selecting until the 129th pick in the draft, for the Philadelphia Flyers to maximize their draft they would not of had to select him until their 122nd pick. See below:
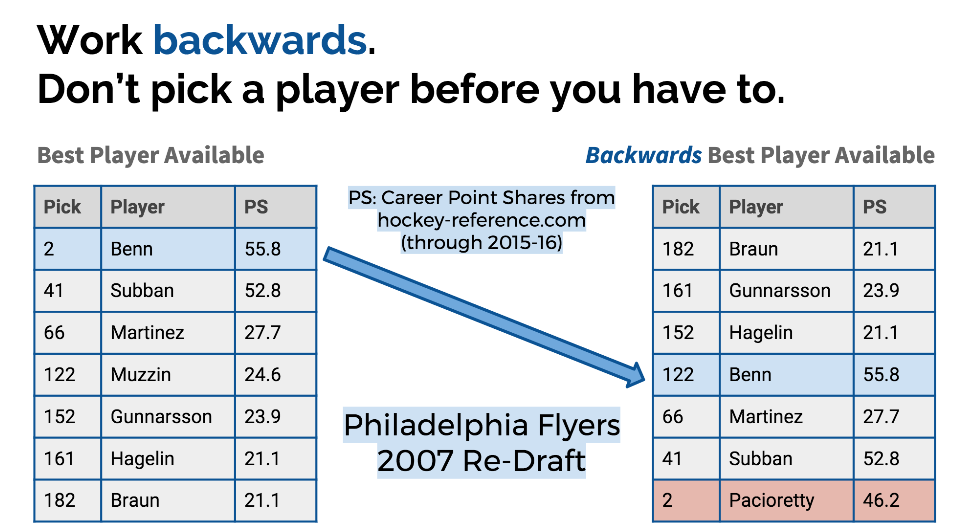
The table on the left shows selecting the best player available and the table on the right shows Namita’s technique of not selecting the best player until absolutely necessary. By utilizing this technique the Flyers would have increased their win share by 21.6 or almost 10% from just selecting the best available players. Next Namita calculated the win shares for each team of the players that they actually selecting and divided that by the optimal win shares that they could have selected to see if teams were better at drafting than others. Below shows the results:
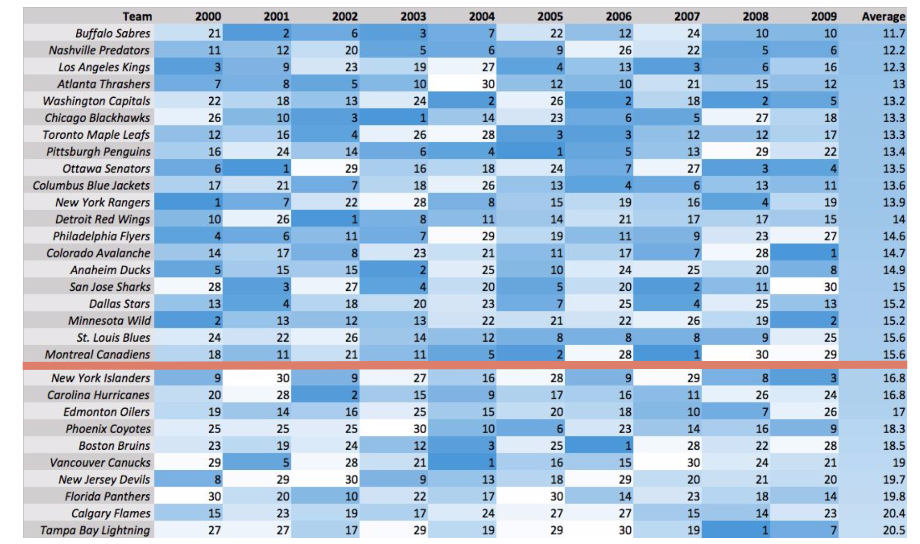
Namita concluded that no team has managed to do significantly better (or worse) over the 10-year period, due to drafting players to be frankly extremely difficult.
In my opinion, this was one of the top 2 presentations from the day (more on this later). Namita’s defining what a perfect draft was and then quantifying how close a team got to selecting the perfect draft was very interesting. Namita did an excellent job of taking game theory and presenting it in a way that everyone was able to relate to and understand. Bonus points for posting the Python script, which I look forward to going through!
Next presentation was Rank Ordering the “Intangibles” by Stefan Wolejszo. Stefan started his presentation by discussing how teams were interested in intangibles, but in the past they were usually done through word of mouth and were not measured. Stefan then discussed the most important intangibles – Cognitive Fatigue, Resilience, Leadership, Motivation, and Grit. Stefan also gave a rating for each of the intangibles in regards to impact and ability to implement; descriptions and ratings are below.
Cognitive Fatigue
- Refers to bing mentally taxed from concentrating on a task for a long period of time
- Issues include – taking poor risks, loss of concentration, impaired memory, less willing to exert self to reach rewards
- Tested with surveys
- Rating: 9/10
Resilience
- Refers to having good outcomes in the face of adversity
- How someone reacts after post traumatic event
- Tested with surveys and interviews
- Rating: 8/10
Leadership
- Process of developing leadership is long; lot of time players are with teams for a short amount of time
- Tested with surveys and interviews
- Rating: 6/10
Motivation
- Initiates and guides goal-oriented behaviors
- As you go up the sports ladder from amateur to professional, you find more and more highly motivated people
- Tested with Sports Motivation Scale
- Rating 6/10
Grit
- Defined in many ways, common themes include perseverance, character, strength, and passion
- Tested with Grit Scale
- Rating 5/10
Being able to successfully quantify “intangibles” is a task that many have tried and very few have been proven successful. Most of the preferred ways to measure each of these intangibles was either a survey or interviews and that causes issues. Surveys and interviews both allow for the respondent to not be honest with their answers. Hockey is a tough, physical sport and the people that play it are tough, physical men; so getting them to be honest about personal issues would be very difficult. I believe the key to this study is trying to quantify how accurate your results are and being able to frame your questions during the data collection process so that you have the best chance for accurate answers.
Legal and Data Analysis of Department of Player Emphasis on Injury to Openent and History/Repeat Offender Status
The next presenter was Dan Glasner on the Legal and Data Analysis of Department of Player Safety Emphasis on Injury to Opponent and History/Repeat Offender Status. Dan started his presentation by conducting some data analysis on players being suspended during the “Department of Player Safety Era” (Since 2011-12). Dan found that during that time period the most suspended teams were:
- Philadelphia Flyers – 16 player suspensions
- Toronto Maple Leafs – 11 player suspensions
- Chicago Blackhawks – 11 player suspensions
Dan also discussed the five factors that the Department of Player Safety Considers when deciding how long a suspension a player should receive and they are:
- Type of conduct involved (60 out of 201 suspensions were illegal checks to head and 20 out of 201 suspensions were for boarding)
- Injury to the opposing player involved in the incident (a player is not considered injured if he returns to the same game at any time)
- Status of the offender (a repeat offender is a player that has been suspended in the last 18 months)
- Situation of the game – late, lopsided score, prior events in the game
- Such other factors may be appropriate in the circumstances
Dan then did some data analysis on the number of games suspended for the illegal check to the head category. Below you will see boxplots for the number of games suspended when the opposing player was not injured, injured, and severely injured.
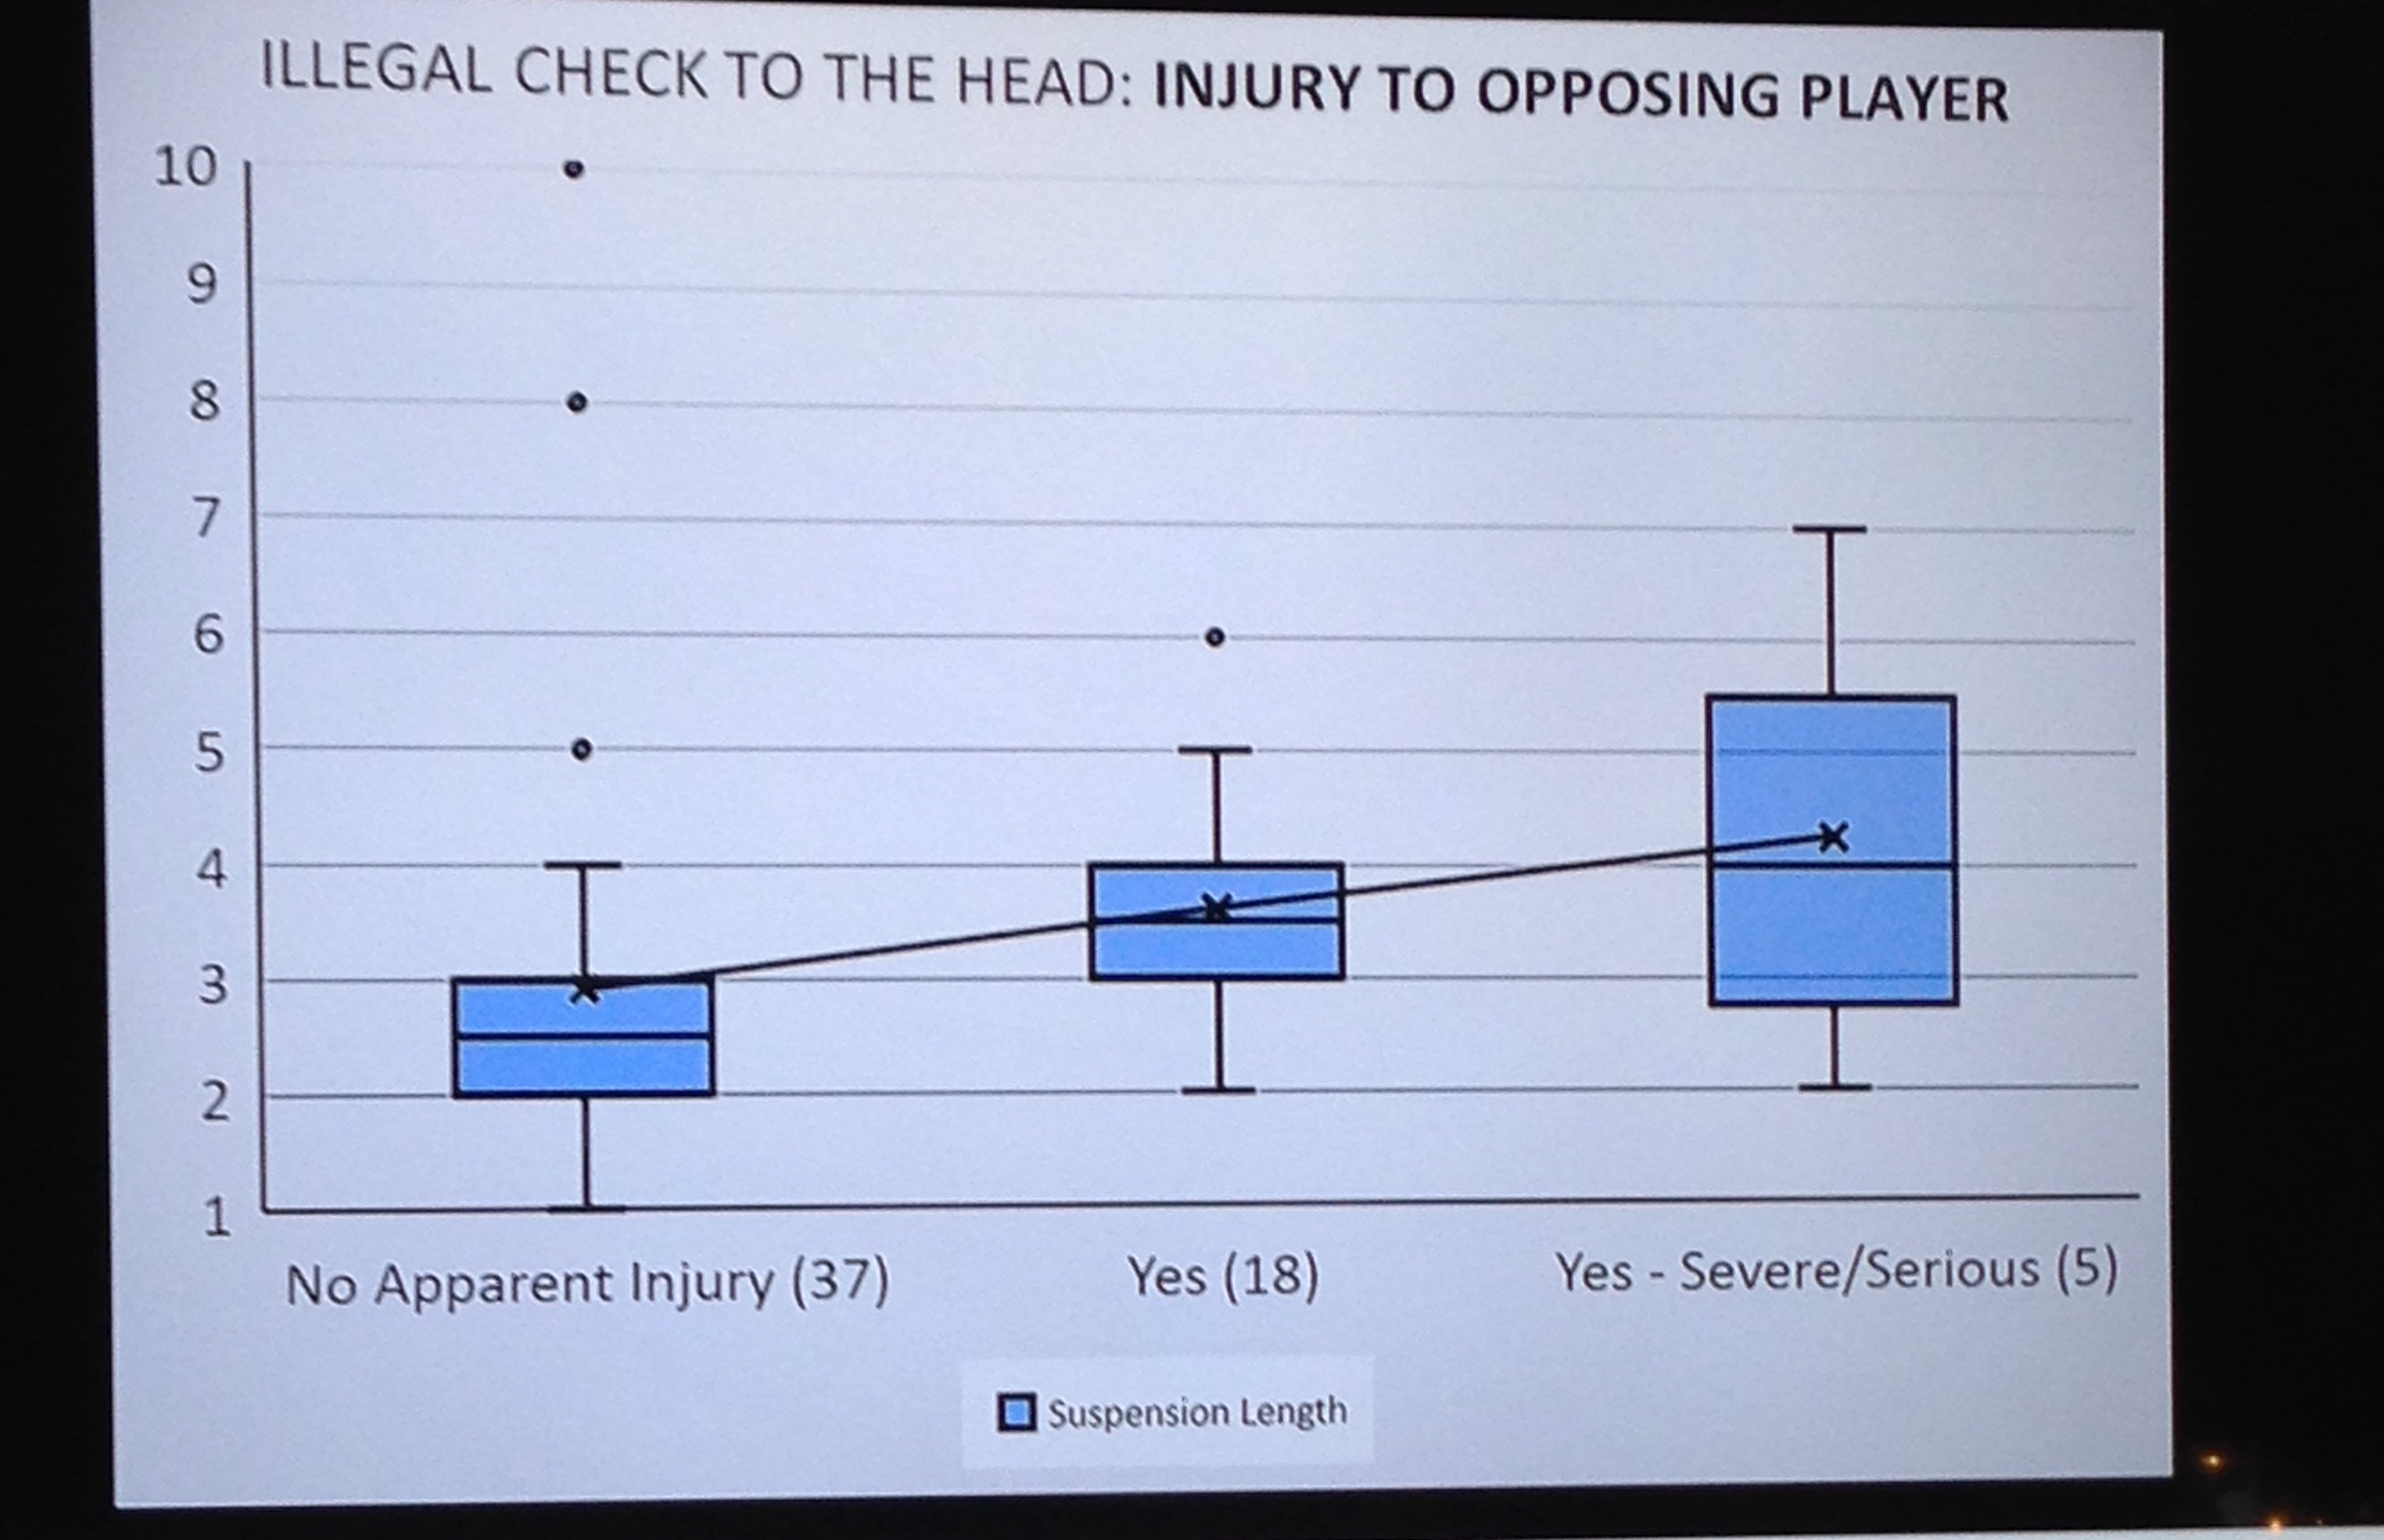
As you might have expected, when the opposing player is injured – you’re going to get more games suspended. Next plot shows how many games players are suspended depending on their record.
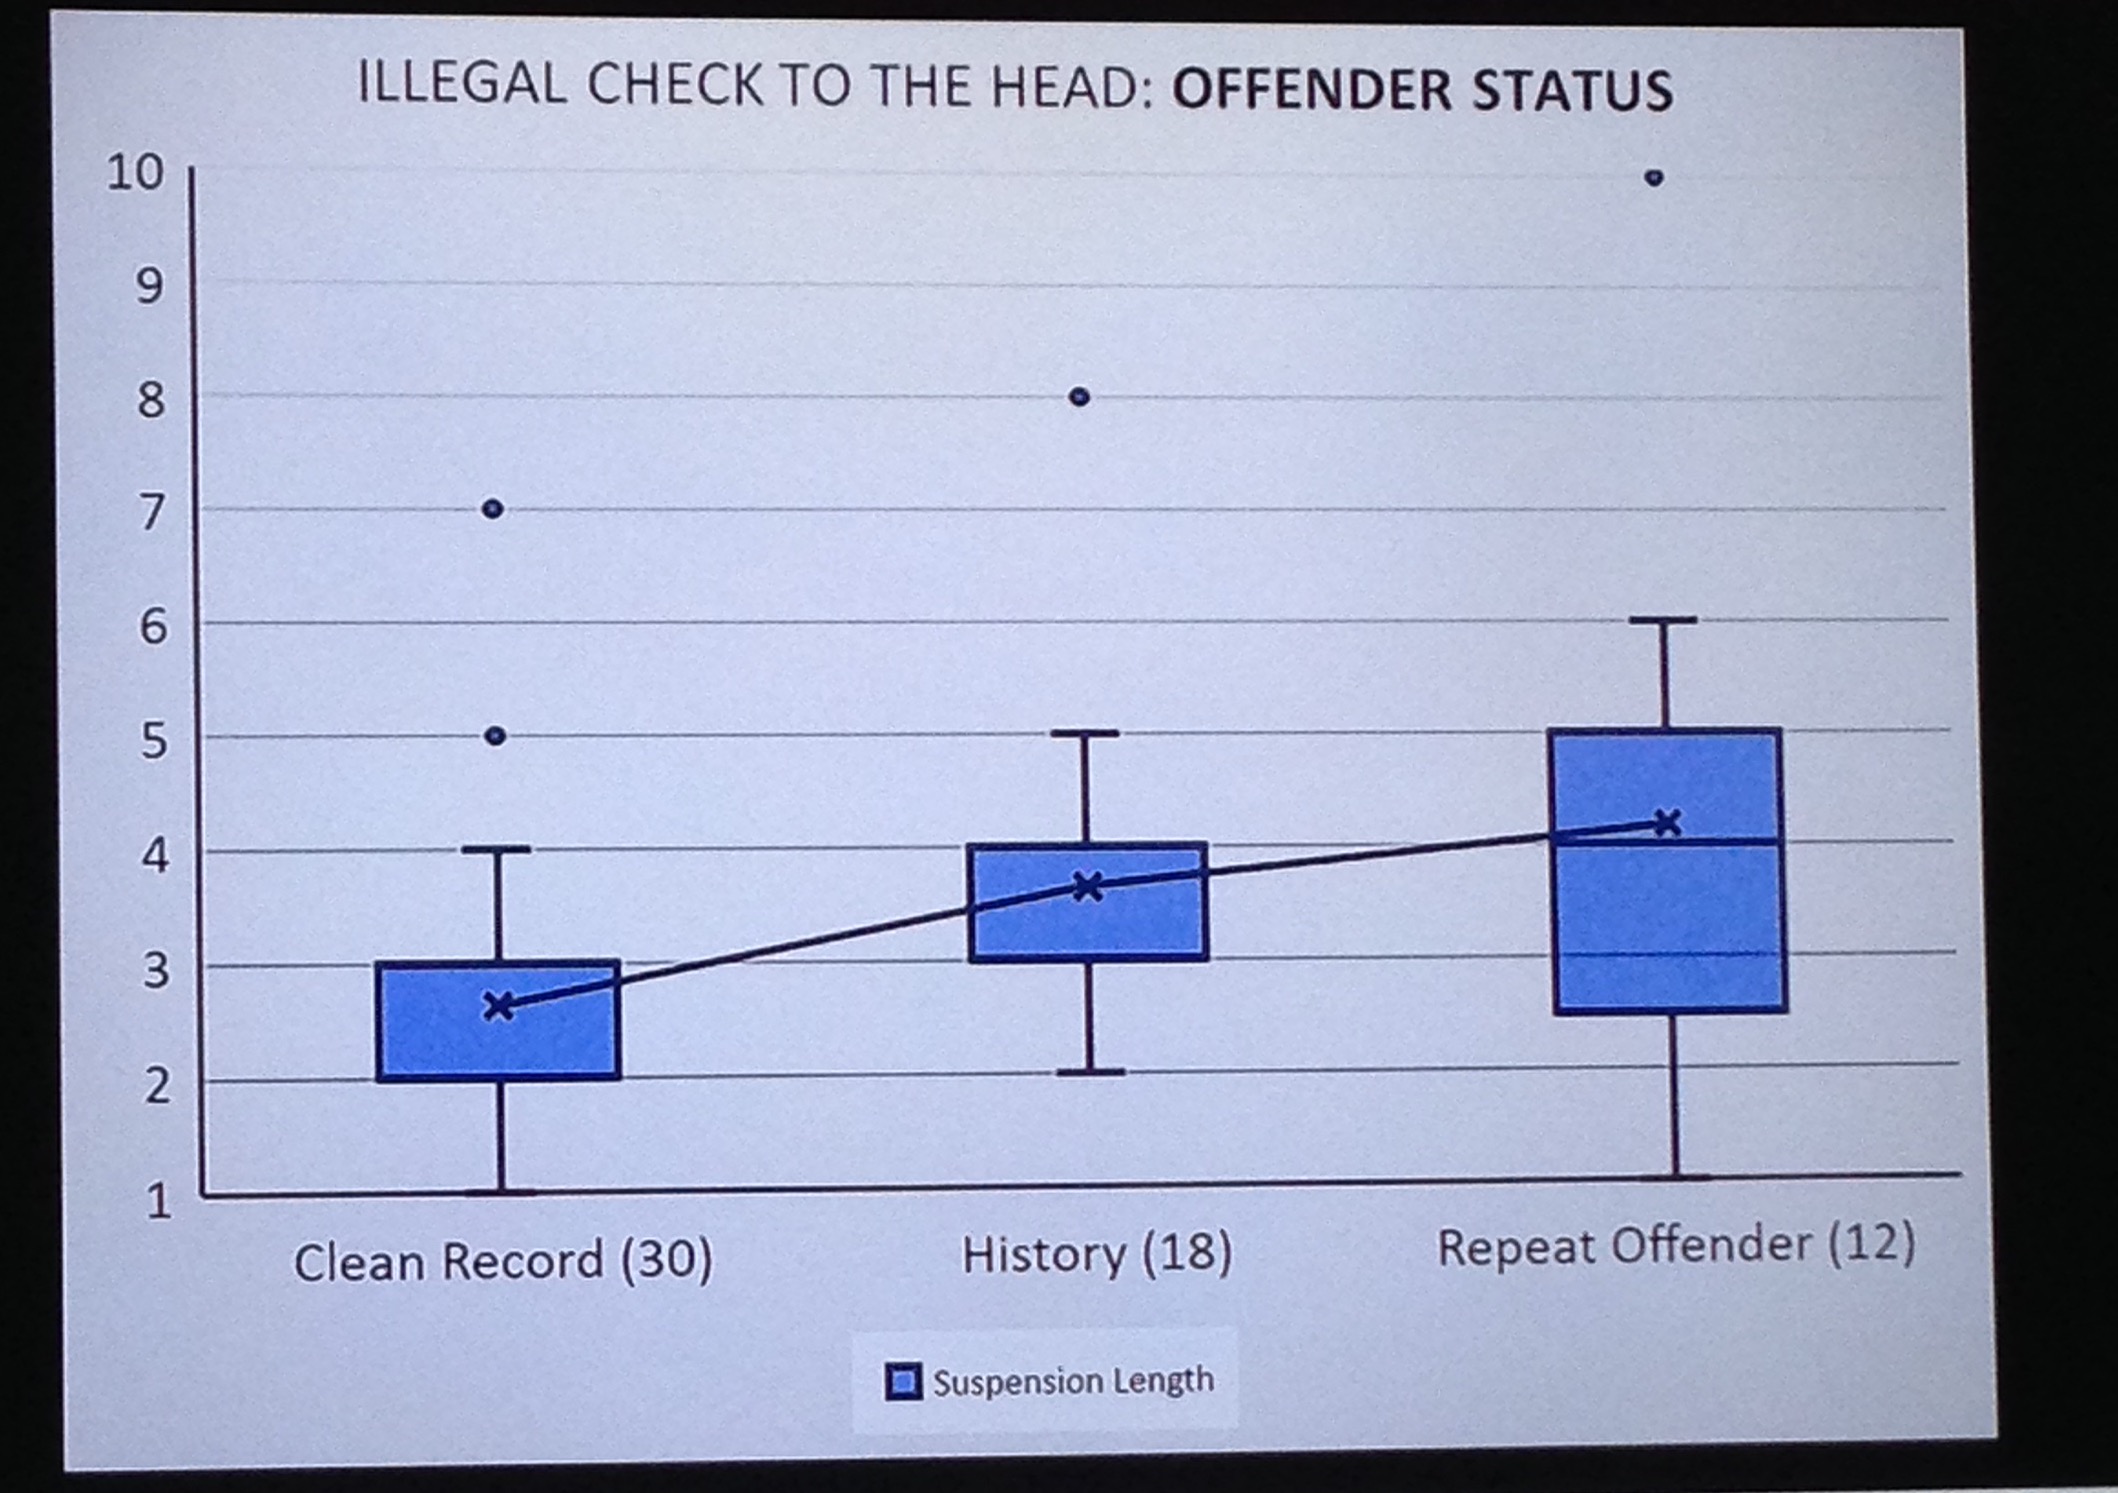
Players with history and repeat offender status get more games off. Finally Dan went through a legal analysis of some of the wording in the CBA regarding player suspensions.
The data analysis on player suspensions was very interesting. I personally had some assumptions on players getting more games for various reasons, (repeat offender/opposing player being injured) and it was really nice to see that in a visualization. I did not get any value in the legal analysis; just something that I am not interested in, but if you law degree I’m sure it was very engaging.
The final presentation that I wanted to discuss was by Alex Novet titled Strong and Weak Link: Talent Distributons within Team. Alex’s slides, code and R scripts can all be found here. Alex started his presentation by discussing the difference between strong link games and weak games – definitions are below:
Strong Link Game: The team with the best player usually wins
Weak Link Game: The team without the worse player usually wins
For example basketball is a strong link game, due to one player can easily get possession and few players are on the court at once. This allows one player to dominate the game if he is good enough (i.e. LeBron James, Michael Jeffrey Jordan). Soccer is a weak link game because each player has the ball a small fraction of the game and 1 goal can win a game, so one mistake can lead to a loss. Hockey has elements of both strong and weak link games. Few players are on the ice at once and the weakest player can be hidden with limited ice time (both strong link indicators), while also including the following weak link indicators – 1 goal can win a game and the best skaters only play a fraction of the game. Alex then ranked each player on a team 1 through 16 (based on WAR) and looked at the strong link (player ranked number 1) and weak link (player ranked number 16) to see what the correlation between season points and the strong/weak links WAR relative to his peers on other teams. The results are below:
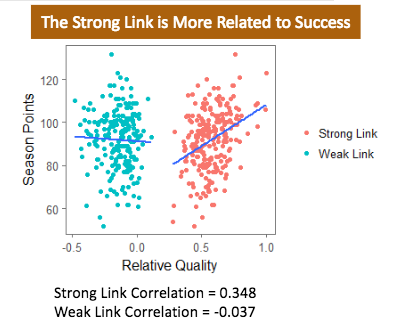
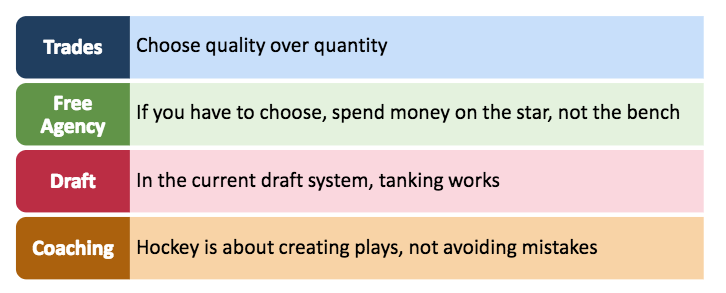
As you can see the there is no correlation between the quality of your weak link/points, while there is a positive correlation between the quality of your weak link/points. This correlation implies you should follow these principles:
In my opinion this was the best talk of the day. When he started the talk I was thinking that hockey would end up being weak link game due to so many players of different levels on a team. When you think about it, there are times when your 4th line is out there with your third pair defenseman; this could mean that none of your top 11 skaters are out on the ice. I’m curious to know how much the 2nd best player has an impact on number of points because there are a lot of 1-2 punches in the league right now (Crosby/Malkin, Ovechkin/Backstrom, Kane/Toews, etc). Again, great presentation and disproved an assumption that I had. I look forward to looking through his R Script – thanks for posting!


