Developing for Torii testnet node. Based on other ours node monitors.
To monitor you node your should have installed and configured: On node server:
- Archway node which should be configured (correct moniker, validator key, network ports setup)
- Telegraf agent
- mon_archway scripts set
On monitoring server:
It is possible to install the software on the node server instance. Hovewer, it is better to move it to standalone instance with opened web access to watch it from browser at any location.
Install:
wget -qO- https://repos.influxdata.com/influxdb.key | gpg --dearmor | sudo tee /etc/apt/trusted.gpg.d/influxdb.gpg > /dev/null
export DISTRIB_ID=$(lsb_release -si); export DISTRIB_CODENAME=$(lsb_release -sc)
echo "deb [signed-by=/etc/apt/trusted.gpg.d/influxdb.gpg] https://repos.influxdata.com/${DISTRIB_ID,,} ${DISTRIB_CODENAME} stable" | sudo tee /etc/apt/sources.list.d/influxdb.list > /dev/null

sudo apt update && sudo apt install influxdb

sudo systemctl enable --now influxdb

sudo systemctl start influxdb

sudo systemctl status influxdb
Setup database (change the passwords given in the example on more secure ones):
influx
> create database archwaymetricsdb
> create user metrics with password 'password'
> grant WRITE on archwaymetricsdb to metrics
> create user grafana with password 'other_password'
> grant READ on archwaymetricsdb to grafana
Keep database user and password in order to use it later for agent configuration. Write it.
In the case of using standalone instance for monitoring staff, you should know your node external ip address (you can know it by command curl ifconfig.me).
In the case of installation on the same instance, just use localhost or 127.0.0.1
Install:
wget -q -O - https://packages.grafana.com/gpg.key | sudo apt-key add -
sudo add-apt-repository "deb https://packages.grafana.com/oss/deb stable main"

sudo apt update -y
sudo apt install grafana -y

sudo systemctl daemon-reload

sudo systemctl enable --now grafana-server
sudo systemctl start grafana-server

# verify the status of the Grafana service with the following command:
sudo systemctl status grafana-server
Configuration:
Follow YOUR_MONITORING_SERVER_IP:3000 to setup grafana dashboard. The following steps are performed in the graphical interface of grafana.
Change default password for grafana user admin/admin on safer one
Add data source InfluxDB with the following settings:
| Param | Value |
|---|---|
| HTTP | |
| URL | http://localhost:8086 |
| InfluxDB Details | |
| Database | archwaymetricsdb |
| User | grafana |
Save datasource settings
Import json file from this repo and save your dashboard.
Install telegraf
sudo apt update
sudo apt -y install curl jq bc

# install telegraf
sudo cat <<EOF | sudo tee /etc/apt/sources.list.d/influxdata.list
deb https://repos.influxdata.com/ubuntu bionic stable
EOF
sudo curl -sL https://repos.influxdata.com/influxdb.key | sudo apt-key add -

sudo apt update
sudo apt -y install telegraf

sudo systemctl enable --now telegraf
sudo systemctl is-enabled telegraf

# make the telegraf user sudo and adm to be able to execute scripts as node user
sudo adduser telegraf sudo
sudo adduser telegraf adm
sudo -- bash -c 'echo "telegraf ALL=(ALL) NOPASSWD:ALL" >> /etc/sudoers'
You can check telegram service status:
sudo systemctl status telegraf
Status can be not ok with default Telegraf's config. Next steps will fix it.
Clone this project repo and copy variable script template
git clone https://github.com/shurinov/mon_archway.git
cd mon_archway
cp template_mon_var.sh mon_var.sh
nano mon_var.sh
Insert your parameters to mon_var.sh:
- full path to node binary to COS_BIN_NAME ( check
which archwayd) - node PRC port to COS_PORT_RPC ( check in file
path_to_arhcway_node_config/config/config.toml) - node API port to COS_PORT_API ( check in file
path_to_arhcway_node_config/config/app.toml) - node validator address to COS_VALOPER ( like
archwayvaloper********) - validator wallet address to COS_WALADDR
Save changes in mon_var.sh and enable execution permissions:
chmod +x monitor.sh mon_var.sh
Edit telegraf configuration
sudo mv /etc/telegraf/telegraf.conf /etc/telegraf/telegraf.conf.orig
sudo nano /etc/telegraf/telegraf.conf
Copy it to config and paste your server name (to do so it is convenient to use the node moniker):
[agent]
  hostname = "YOUR_MONIKER/SERVER_NAME" # set this to a name you want to identify your node in the grafana dashboard
  flush_interval = "15s"
  interval = "15s"
# Input Plugins
[[inputs.cpu]]
  percpu = true
  totalcpu = true
  collect_cpu_time = false
  report_active = false
[[inputs.disk]]
  ignore_fs = ["devtmpfs", "devfs"]
[[inputs.io]]
[[inputs.mem]]
[[inputs.net]]
[[inputs.nstat]]
[[inputs.system]]
[[inputs.swap]]
[[inputs.netstat]]
[[inputs.linux_sysctl_fs]]
[[inputs.processes]]
[[inputs.interrupts]]
[[inputs.kernel]]
[[inputs.diskio]]
# Output Plugin InfluxDB
[[outputs.influxdb]]
  database = "archwaymetricsdb"
  urls = [ "MONITORING_SERV_URL:PORT" ] # example http://yourownmonitoringnode:8086
  username = "DB_USERNAME" # your database username
  password = "DB_PASSWORD" # your database user's password

[[inputs.exec]]
  commands = ["sudo su -c /PATH/TO/ARCHWAY_MON/monitor.sh -s /bin/bash <ARCHWAY_USER>"] # change home and username to the useraccount your validator runs at
  interval = "15s"
  timeout = "5s"
  data_format = "influx"
  data_type = "integer"
Temporarily unavailable. Script will be updated to actual version soon...
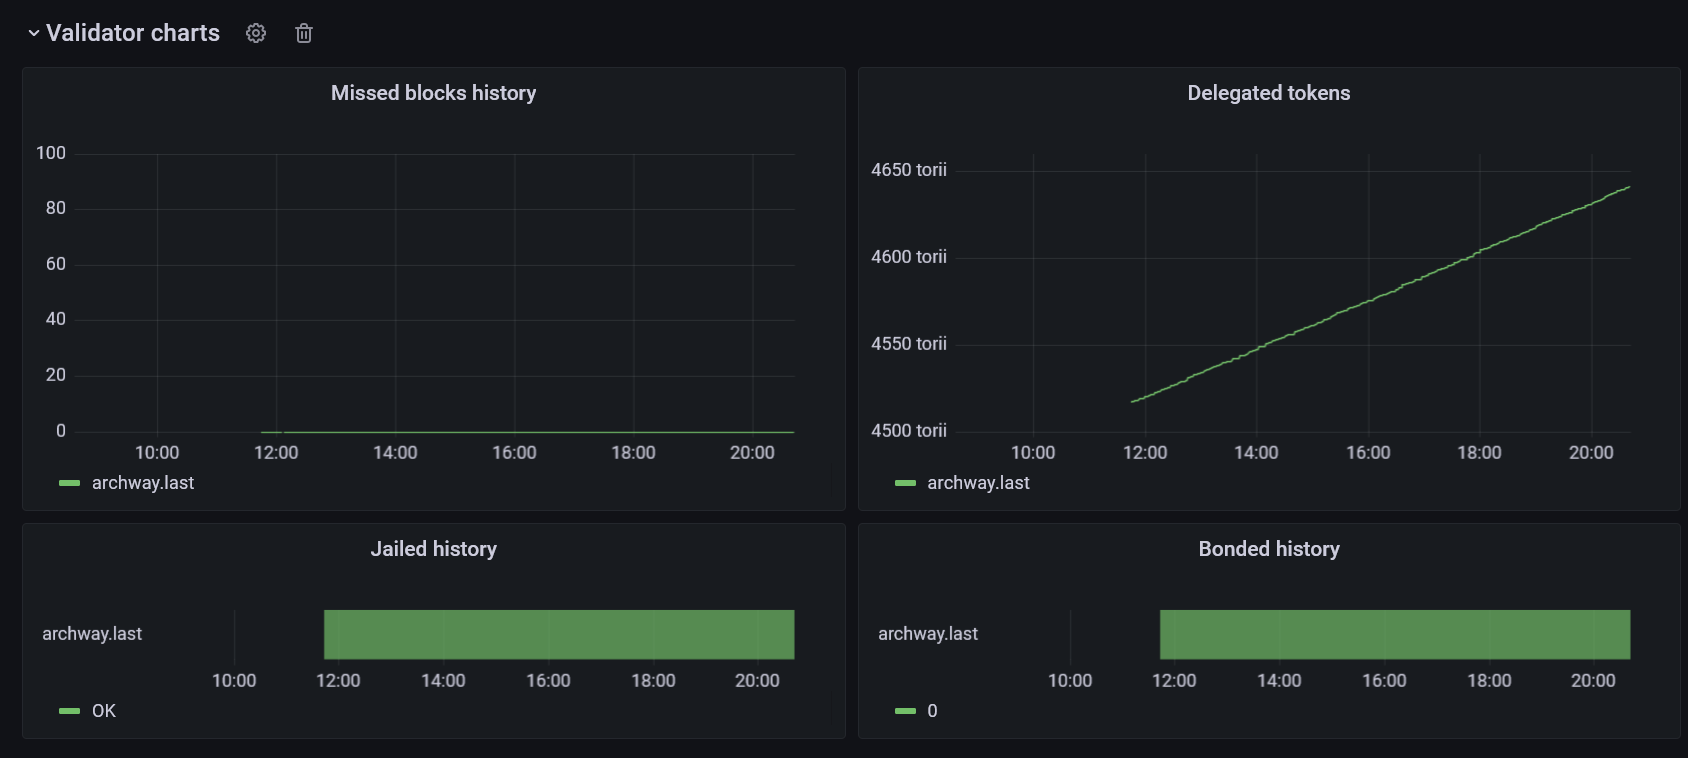
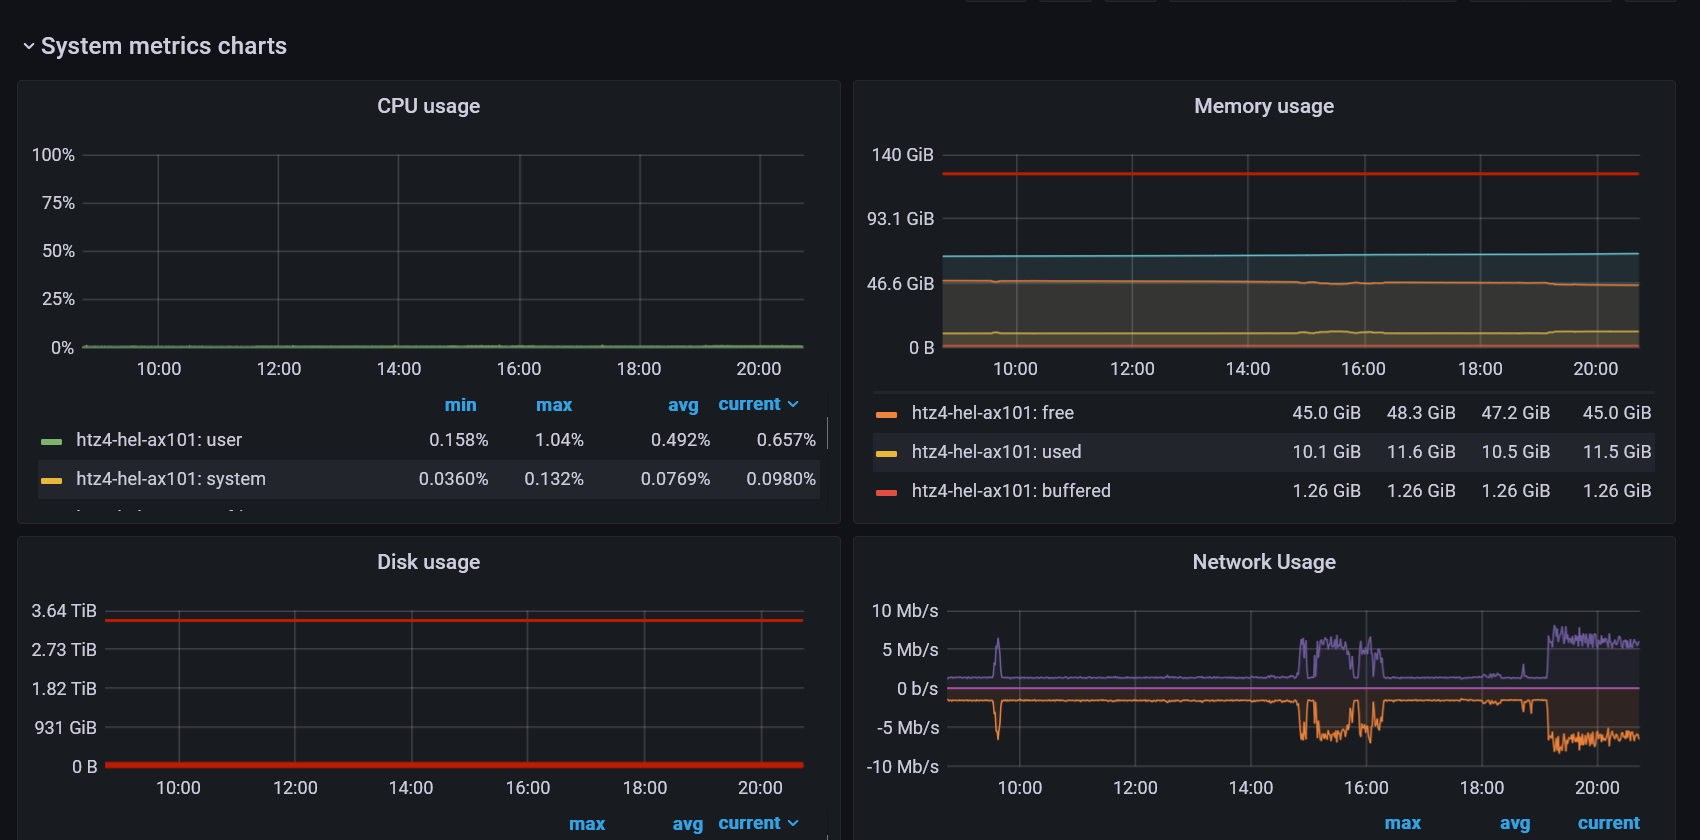
Dashboard has main cosmos-based node information and common system metrics. There is a description in it.
Complex parameter can show problem concerning receiving metrics from node. Normal value is "OK"
Node catching_up parameter
Latest blockheight of node
Time interval in seconds between taking the metric and node latest block time. Value greater 15s may indicate some kind of synchronization problem.
Number of connected peers
Validator jailed status.
Number of missed blocks in 100 blocks running window. If the validator misses more than 50 blocks, it will end up in jail.
Validator stake bonded info
Validator voting power. If the value of this parameter is zero, your node isn't in the active pool of validators
Number of delegated tokens
Version of node binary
Your node stake rank
Total number of active validators
No comments needed)


