Giter Club home page Giter Club logo

serputko / performance-testing-framework Goto Github PK

View Code? Open in Web Editor NEW
396.0 43.0 206.0 34.51 MB

Framework allows to perform load testing with Apache Jmeter, view application/server metrics in real-time with Grafana, analyze errors cause with detailed traces for failed requests, compare different test runs in scripted dashboard and perform frontend performance testing with sitespeed.io+webpagetest

License: Apache License 2.0

Shell 4.69% Groovy 3.52% Dockerfile 1.59% JavaScript 89.95% CSS 0.07% Pug 0.18%
jmeter docker sitespeed sitespeedio grafana telegraf webpagetest webpagetest-server webpagetest-agent influxdb

performance-testing-framework's Introduction

Performance testing framework

This framework could be used both for backend load testing with Apache Jmeter and frontend load test with sitespeed.io + webpagetest private instance.

Custom Grafana dashboards features:

  • view application/server-side metrics in real time while test is running
  • analyze errors cause with detailed traces for failed requests
  • compare different test runs in scripted dashboard

Dashboard demo

Tests comparison

Getting Started

Framework consists of next services:

  • Grafana: data visualization & monitoring
  • Influxdb: time series DB platform for metrics & events(Time Series Data)
  • Telegraf: server agent for collecting & reporting metrics
  • Sitespeed.io: set of tools for frontend load testing
  • Graphite: time series DB platform for metrics
  • Jenkins: continuous integration server for tests execution
  • Portainer: service for managing docker environment
  • Webpagetest: private instance of webpagetest server for frontend tests execution
  • Apache Jmeter: tool for backend load testing

Framework architecture:

Prerequisites

To run framework install docker: https://docs.docker.com/engine/installation/.

You should be able to run docker run hello-world with no errors.

For Windows:

Installing

  1. Clone this repository git clone https://github.com/serputko/performance-testing-framework.git
  2. open performance-testing-framework dir

For Backend testing:

  1. (optional) if you want to update existing services
docker-compose pull
docker-compose build 
docker-compose down
  1. docker-compose up -d

For Frontend + Backend testing

  1. (optional) if you want to update existing services
docker-compose -f docker-compose-with-frontend.yml pull
docker-compose -f docker-compose-with-frontend.yml build
docker-compose -f docker-compose-with-frontend.yml down
  1. docker-compose -f docker-compose-with-frontend.yml up -d

All containers should be up and running

Services endpoints

  • jenkins localhost:8181
  • grafana localhost:8857
  • portainer localhost:9000
  • webpagetest server localhost:80
  • influxdb localhost:8653

Jenkins

Login to Jenkins with admin/admin(could be changed in docker-compose file) By default jenkins consists of 2 jobs:

  • BackendJob: run Jmeter scenarios
  • FrontendJob: run tests with sitespeed.io and webpagetest private instance

Running demo jmeter scenario with BackendJob

To run jmeter demo script: Open BackendJob -> Build with Parameters -> Set build parameters -> Select scenario -> Build

This job will start jmeter docker container and execute demo_scenario.jmx jmeter scenario

To open demo_scenario in local instance of Jmeter please install Plugin Manager https://jmeter-plugins.org/wiki/PluginsManager/. It will automatically install all required plugins.

Making your jmeter script compatible with framework

Create jmeter test scenario

Modify your jmeter scenario to work with framework, add:

  • JSR223 Listener from demo scenario Contains groovy script that:

    • Generates detailed trace about request/response info for failed samplers
    • Posts generated trace to jmeter log(could be viewed in jenkins job)
    • Set trace to sampler response message. If failed samplers are part of Transaction Controller(generate parent sample enabled) all traces will be set to Transaction Controller response message
  • Backend Listener from demo scenario Sends samplers data to influxdb database. Fields:

    • application - groovy script set field value in next format:
    .jmx file title @ jenkins build number @ test start time (f.e. demo_scenario.jmx @ 18 @ Sat Jul 28 09:44:26 UTC 2018)
    
    • testTitle - groovy script generates parameterized title like:
    Jenkins build #18 http://127.0.0.1:8181/job/BackendJob/18/ with demo_scenario.jmx scenario with 10 users, 180 sec rampup and 600 sec duration was started
    
    • eventTags - info from testTitle field in tag format

    Data from these fields will be displayed in grafana dashboard annotations- Green/Red vertical lines that stands for test Start/End.

  • (optional) jp@gc - Console Status Logger sends minimalistic stats to jenkins console output about test execution:

    #43	Threads: 3/10	Samples: 16	Latency: 23	Resp.Time: 197	Errors: 2
    #44	Threads: 3/10	Samples: 16	Latency: 32	Resp.Time: 203	Errors: 1
    

Grafana

Start demo_scenario.jmx test with jenkins Backend job

Real time results should be available in grafana Open 'Load test monitoring' dashboard. Dashboard contains visualizations based on data from influxdb.

Available metrics

Dashboard has multiple rows with different metrics

Timerange

All values in visualizations are calculated according to selected time range. Default timerange is last 15 min with 10 sec refresh. Timerange could be set in timepicker or selected on any graph.

Templating

Graphs and series on dashboard are displayed dynamically according to variables selected

  • group_time - aggregation time
  • metric - which series to show on Response Times Over Time graph(default All)
  • scenario - results of which scenario to display
  • transactions - which transactions to show on Response Times Over Time row(default All). transaction variable depends on scenario variable
  • server_measurements - which server side metrics to show
  • host - for which servers show monitoring

Failed requests details

If JSR223 listener was added to scenario than detailed traces for failed requests can be viewed in 'Error details' table. Example of failed request:

Number of samples in transaction : 1, number of failing samples : 1
Login; Response message: Unauthorized;
Status code: 401;
Number of failed assertions: 1

Sample Failed: Login
Started at: Mon Jul 30 11:54:59 UTC 2018
Finished at: Mon Jul 30 11:54:59 UTC 2018
Request:
{
    "code": "1234567"
}
REQUEST DATA
URL: http://demo-server.com/login
Request headers:
Content-Type: application/json

Response: 
Unauthorized
Response code:401

Response data:
{
   "Error message": "Incorrect password or confirmation code entered. Please try again."
}

Assertion results:
Number of failed assertions: 1
Response Assertion Failed; 
Failure Message: Test failed: text expected to contain /success/;

Test runs comparison

Tests comparison is done using scripted js dashboard. It could be accessed at http://127.0.0.1:8857/dashboard/script/compare_tests.js

FrontendJob

To run frontend test: Open FrontendJob -> Build with Parameters -> Set build parameters -> Build

This job will start sitespeed.io docker container and run test with parameters using WebPageTest private instance

Frontend test deliverables:

  • sitespeed.io HTML report
  • webpagetest HTML report

performance-testing-framework's People

Contributors

a-venger avatar graciousgrey avatar serputko avatar

Stargazers

 avatar  avatar  avatar  avatar  avatar  avatar  avatar  avatar  avatar  avatar  avatar  avatar  avatar  avatar  avatar  avatar  avatar  avatar  avatar  avatar  avatar  avatar  avatar  avatar  avatar  avatar  avatar  avatar  avatar  avatar  avatar  avatar  avatar  avatar  avatar  avatar  avatar  avatar  avatar  avatar  avatar  avatar  avatar  avatar  avatar  avatar  avatar  avatar  avatar  avatar  avatar  avatar  avatar  avatar  avatar  avatar  avatar  avatar  avatar  avatar  avatar  avatar  avatar  avatar  avatar  avatar  avatar  avatar  avatar  avatar  avatar  avatar  avatar  avatar  avatar  avatar  avatar  avatar  avatar  avatar  avatar  avatar  avatar  avatar  avatar  avatar  avatar  avatar  avatar  avatar  avatar  avatar  avatar  avatar  avatar  avatar  avatar  avatar  avatar  avatar

Watchers

 avatar  avatar  avatar  avatar  avatar  avatar  avatar  avatar  avatar  avatar  avatar  avatar  avatar  avatar  avatar  avatar  avatar  avatar  avatar  avatar  avatar  avatar  avatar  avatar  avatar  avatar  avatar  avatar  avatar  avatar  avatar  avatar  avatar  avatar  avatar  avatar  avatar  avatar  avatar  avatar  avatar  avatar  avatar

performance-testing-framework's Issues

Trouble with access to grafana page on Windows 10

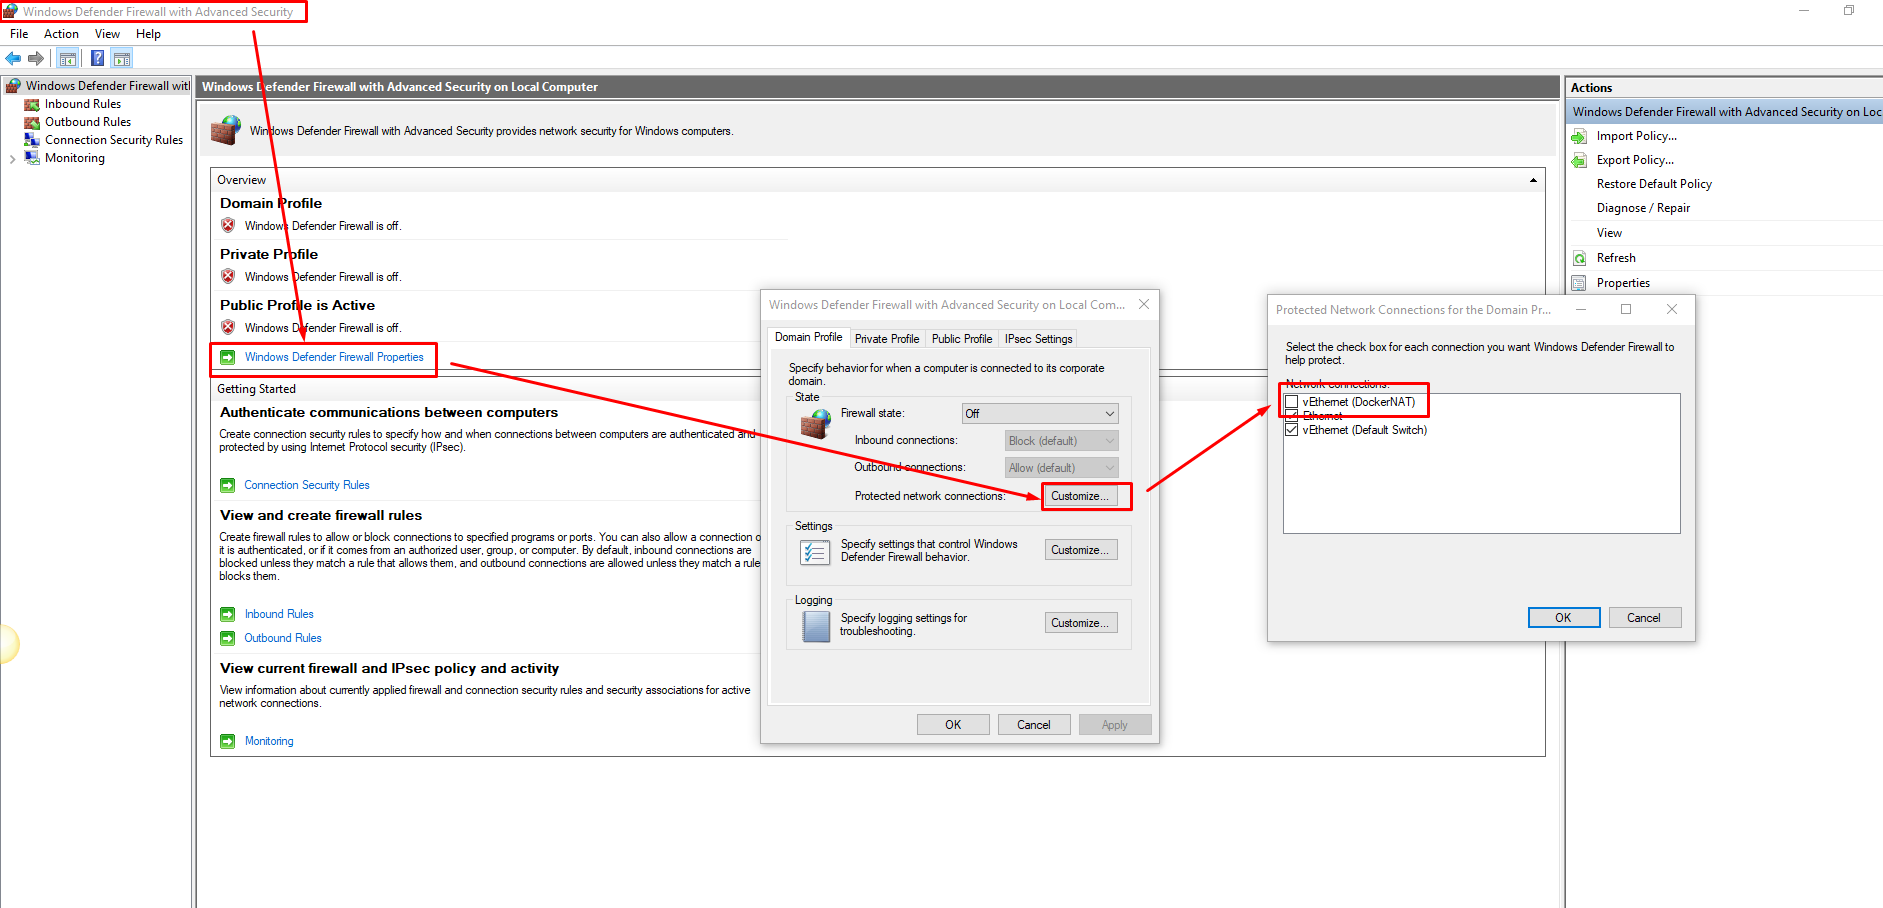
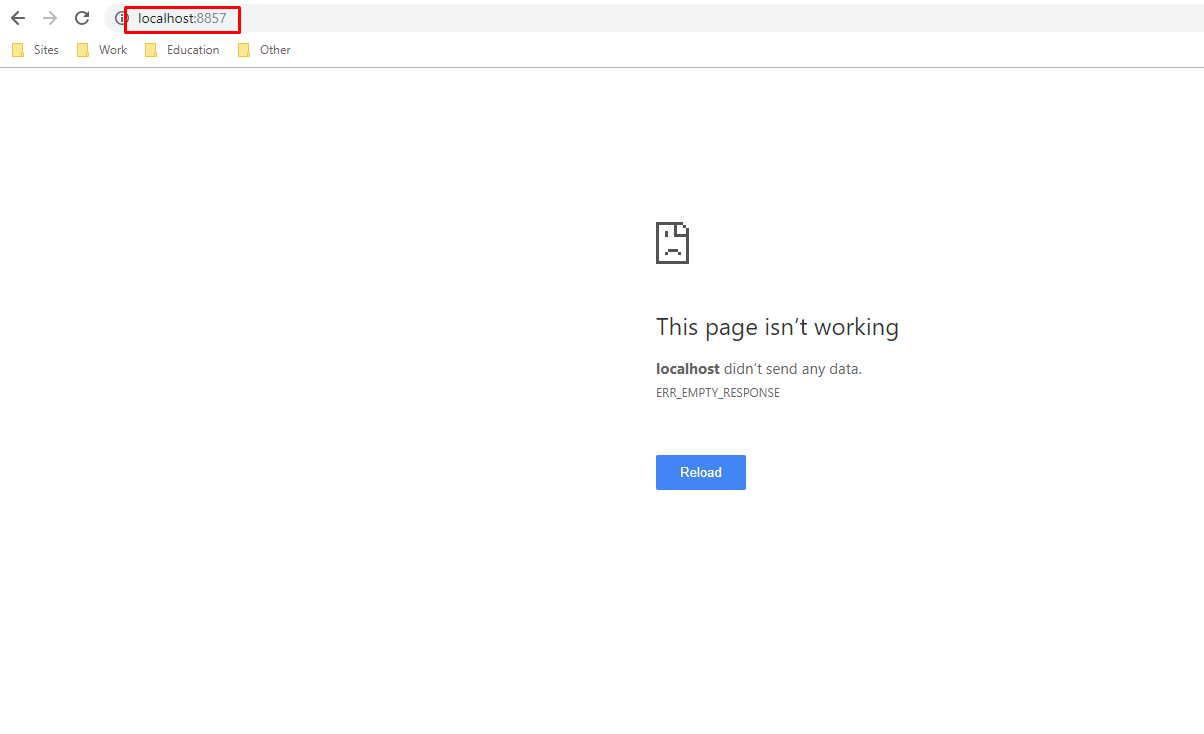
There is a problem with access to grafana's page afrer "docker-compose up -d" command. After all containers are created, and i try to open localhost:8857 i see the error message on the page (see attachment). This issue is resolved for me in next ways:

  1. Turn off your firewall
  2. Set fixed DNS server in Docker's settings (screenshot 2)
  3. Uncheck vEthernet (DockerNAT) in Firewall properties (screenshot 3)
    screenshot_2
    screenshot_3
    grafana_error

Not able to Run Backend job, jenkins "Could not open /var/jenkins_home/workspace/BackendJob/"

Hi,

I am unable to run Backend job successfully as it is unable to reach "/var/jenkins_home/workspace/BackendJob/" directory.

log:
Started by user admin
Running as SYSTEM
Building in workspace /var/jenkins_home/workspace/BackendJob
[BackendJob] $ /bin/sh -xe /tmp/jenkins3857704234177597003.sh

  • docker container ls -a
  • grep telegraf
  • awk { print $8 }
  • check_telegraf=ago
  • [ ago != Up ]
  • echo Starting Telegraf container
    Starting Telegraf container
  • docker container start telegraf
    telegraf
    • grepdocker container ls -a jmeter

a12e996a33ef java:8-jdk "cat" 31 minutes ago Exited (0) 31 minutes ago jmeter

  • docker container stop jmeter
    jmeter
  • docker container rm jmeter
    jmeter
    [BackendJob] $ /bin/sh -xe /tmp/jenkins3033784653980098952.sh
  • pwd
    /var/jenkins_home/workspace/BackendJob
  • ls
    demo_scenario.jmx
    jmeter.log
    monitoring.groovy
  • sudo rm -f report.log
  • sudo rm -rf report/
  • sudo cp -r /var/lib/jmeter-scenarios/demo_scenario.jmx /var/lib/jmeter-scenarios/monitoring.groovy /var/jenkins_home/workspace/BackendJob
  • docker run --name jmeter --net=host --rm --volumes-from=jenkins -e SCENARIO=/var/jenkins_home/workspace/BackendJob/ -e WORKSPACE=/var/jenkins_home/workspace/BackendJob -e USERS=10 -e RAMPUP=180 -e DURATION=600 -e BUILD_NUMBER=11 -e BUILD_URL= java:8-jdk
    Mar 26, 2021 5:53:39 AM java.util.prefs.FileSystemPreferences$1 run
    INFO: Created user preferences directory.
    Could not open /var/jenkins_home/workspace/BackendJob/
    [BackendJob] $ /bin/sh -xe /tmp/jenkins3622651381213281158.sh
  • docker container stop telegraf
    telegraf
    Performing Post build task...
    Could not match :Build was aborted : False
    Logical operation result is FALSE
    Skipping script : docker container stop jmeter
    END OF POST BUILD TASK : 0
    Finished: SUCCESS

Aggregate Report

As far as I understand the "Aggregate Report" is generated from two queries.

I saw in one of your videos that the "Error" count column is merged on the same row. In my case the same table show different rows for the error count, they are not being merged.

Further investigation on this, led me to conclude that the column time is affecting the aggregation. The error field as a different timestamp from the other fields (pct95, etc).

How did you workaround this?

Error when running Influxdb container from docker-compose file

I got this error when I run docker-compose up -d , all the containers are running but there is an error with Influxdb .

I also run
docker-compose up --build to build the images but the same issue

Error:
Recreating 1ca2f34b1ced_1ca2f34b1ced_1ca2f34b1ced_1ca2f34b1ced_1ca2f34b1ced_1ca2f34b1ced_influxdb ... error

ERROR: for 1ca2f34b1ced_1ca2f34b1ced_1ca2f34b1ced_1ca2f34b1ced_1ca2f34b1ced_1ca2f34b1ced_influxdb Cannot start service influxdb: OCI runtime create failed: container_linux.go:296: starting container process caused "exec: "/entrypoint1.sh": permission denied": unknown

ERROR: for influxdb Cannot start service influxdb: OCI runtime create failed: container_linux.go:296: starting container process caused "exec: "/entrypoint1.sh": permission denied": unknown
ERROR: Encountered errors while bringing up the project.

I'm using mac OS with High sierra version and latest docker version

Scripted dashboards - left start-time and left end-time

Hi,

I'm having issues using the scripted dashboard, particularly the start and end time for the left and right runs.

My understanding is after picking the left run (for example) the values for the variables start_time_left and end_time_left should be timestamps.

Now the variables comes from the following query:

SELECT * FROM jmeter WHERE application =~ /$tag_left/ ORDER BY time asc LIMIT 1

That is not returning a timestamp in my case. I'm using influxdb-timeshift-proxy and that's the datasource for the query above.

The URL looks like:

&var-end_time_right=load-test.jmx%20@%20106%20@%20Wed%20Apr%2001%2010:14:32%20GMT%202020

and it should be a timestamp

Any idea how to solve this?

Jmeter image doesn't run

I download this repo, and i wanted to test the jmeter image. I can build it, but at the time to run it; just throw a Exited message.
build jmeter
Docker Desktop

Unable to view the 2 default jenkins job.

I tried following the exact steps as documented , but i am unable to view the Default Backend and Frontend job in Jenkins.
I am using Docker desktop for windows .
what would be resolution for this ?
All the help is highly appreciated.

A question about customizing dashboard

I really like this dashboard, save me a lot of time indeed to build everything.
Question : How and where can I customize the grafana dashboard 'load-test-monitoring'

Grafana can not be accessed at localhost:3000

I have cloned the repo and then run the docker-compose up -d. When i am trying to access grafana at localhost:3000, it says localhost refused to connect. But i am able to access localhost:8181 for jenkins and localhost:9000 for portainer. Any help on this?

[sitespeedio.plugin.webpagetest] Incomplete first view data for WPT test

Hi I worked with framework , but sitespeed.io log display severals errors:
ERROR: [sitespeedio.plugin.webpagetest] Incomplete first view data for WPT test 190211_DF_a4fb5ba5f68e46e0527af73862837557, run 1
ERROR: [root] Metricsfilter: The breakdown is missing from the metrics breakdown..requests
ERROR: [root] Metricsfilter: The breakdown is missing from the metrics breakdown.
.bytes
image

--webpagetest.host https://www.webpagetest.org --webpagetest.key A.c300ec3e3433db4909d7123c054b6b26 --webpagetest.location Dulles:Chrome --webpagetest.connectivity Cable --webpagetest.runs 3 --webpagetest.includeRepeatView false --webpagetest.private false

Whether distributed jmeter is supported

The performance of a single device may not be sufficient for high concurrency testing. Is distributed supported? I don't see that in the documentation,Hope to receive an answer,thanks!

ERROR: for influxdb Cannot start service influxdb: OCI runtime create failed:

I am geting following error while running docker-compose up

ERROR: for influxdb  Cannot start service influxdb: OCI runtime create failed: container_linux.go:296: starting container process caused "exec: \"/entrypoint1.sh\": permission denied": unknown
ERROR: Encountered errors while bringing up the project.

OS: Ubuntu 16.4

Please guide us to resolve this issue

Windows 10 containers not starting

ENV - OS - Windows 10 Ent
Docker-for-windows :
Version 18.06.0-ce-win72 (19098)
Channel: stable
5513f91

I am getting some errors while trying to run the frontend docker-compose file.

command used docker-compose -f docker-compose-with-frontend.yml up -d

Please find the logs below

Creating portainer    ... error
Creating wptserver ...
Creating graphite  ...
Creating influxdb  ...
Creating telegraf  ...
Creating jmeter    ...
Creating sitespeed.io ...
Creating telegraf     ... error

ERROR: for portainer  Cannot create container for service portainer: b'Mount denied:\nThe source path "\\\\var\\\\run\\\\doCreating wptserver                ... done
Creating graphite                 ... done
Creating influxdb     ... done
Creating docker-dind  ... error
Creating jmeter       ... done
Creating sitespeed.io             ... done
\\docker.sock:/var/run/docker.sock"\nis not a valid Windows path'
Creating influxdb-timeshift-proxy ... done
Creating wptagent                 ... done
Creating grafana                  ... done
Creating grafana-setup            ... done

ERROR: for portainer  Cannot create container for service portainer: b'Mount denied:\nThe source path "\\\\var\\\\run\\\\docker.sock:/var/run/docker.sock"\nis not a valid Windows path'

ERROR: for telegraf  Cannot create container for service telegraf: b'Mount denied:\nThe source path "\\\\var\\\\run\\\\docker.sock:/var/run/docker.sock"\nis not a valid Windows path'

ERROR: for docker-dind  Cannot create container for service docker-dind: b'Mount denied:\nThe source path "\\\\var\\\\run\\\\docker.sock:/var/run/docker.sock"\nis not a valid Windows path'
ERROR: Encountered errors while bringing up the project.

Also, getting an error which is as follows:

Get:1 http://deb.debian.org/debian stretch/main amd64 sudo amd64 1.8.19p1-2.1 [1055 kB]
debconf: delaying package configuration, since apt-utils is not installed

Could you please help me out?
Do you think it is better to create a different branch for windows?

influx timeshift proxy container not starting exit 1

Hello,
I tried to run the front end stuff. docker-compose -f docker-compose-with-frontend.yml up -d
But I see that the influx timeshift proxy is not starting.
Here is the log.

-bash-4.2$ docker-compose -f docker-compose-with-frontend.yml up -d
Creating network "performance-testing-framework_default" with the default driver
Creating jmeter       ... done
Creating portainer    ... done
Creating telegraf                 ... done
Creating wptserver                ... done
Creating graphite                 ... done
Creating influxdb     ... done
Creating sitespeed.io             ... done
Creating docker-dind              ... done
Creating influxdb-timeshift-proxy ... done
Creating jenkins                  ... done
Creating wptagent                 ... done
Creating grafana                  ... done
Creating grafana-setup            ... done
-bash-4.2$ docker-compose -f docker-compose-with-frontend.yml ps
          Name                        Command               State                         Ports
--------------------------------------------------------------------------------------------------------------------
docker-dind                dockerd-entrypoint.sh            Up       2375/tcp
grafana                    bash -x /run1.sh                 Up       0.0.0.0:8857->3000/tcp
grafana-setup              /bin/sh -c /entrypoint.sh        Up
graphite                   /sbin/my_init                    Up       0.0.0.0:2003->2003/tcp, 2004/tcp, 2023/tcp,
                                                                     2024/tcp, 0.0.0.0:8080->80/tcp, 8125/udp,
                                                                     8126/tcp
influxdb                   /entrypoint1.sh                  Up       0.0.0.0:8653->8086/tcp, 8653/tcp
influxdb-timeshift-proxy   npm run start                    Exit 1
jenkins                    bash -x /run.sh                  Up       0.0.0.0:50000->50000/tcp,
                                                                     0.0.0.0:8181->8080/tcp
jmeter                     cat                              Exit 0
portainer                  /portainer                       Up       0.0.0.0:9000->9000/tcp
sitespeed.io               /start.sh -V                     Exit 0
telegraf                   bash -x /entrypoint1.sh te ...   Up       8092/udp, 8094/tcp, 8125/udp
wptagent                   /bin/bash /wptagent/entryp ...   Up       0.0.0.0:4001->80/tcp
wptserver                  docker-php-entrypoint /usr ...   Up       443/tcp, 0.0.0.0:80->80/tcp
-bash-4.2$ docker logs influxdb-timeshift-proxy

> [email protected] start /influxdb-timeshift-proxy
> node ./bin/www

internal/modules/cjs/loader.js:583
    throw err;
    ^

Error: Cannot find module 'express'
    at Function.Module._resolveFilename (internal/modules/cjs/loader.js:581:15)
    at Function.Module._load (internal/modules/cjs/loader.js:507:25)
    at Module.require (internal/modules/cjs/loader.js:637:17)
    at require (internal/modules/cjs/helpers.js:20:18)
    at Object.<anonymous> (/influxdb-timeshift-proxy/app.js:1:79)
    at Module._compile (internal/modules/cjs/loader.js:689:30)
    at Object.Module._extensions..js (internal/modules/cjs/loader.js:700:10)
    at Module.load (internal/modules/cjs/loader.js:599:32)
    at tryModuleLoad (internal/modules/cjs/loader.js:538:12)
    at Function.Module._load (internal/modules/cjs/loader.js:530:3)
npm ERR! code ELIFECYCLE
npm ERR! errno 1
npm ERR! [email protected] start: `node ./bin/www`
npm ERR! Exit status 1
npm ERR!
npm ERR! Failed at the [email protected] start script.
npm ERR! This is probably not a problem with npm. There is likely additional logging output above.
npm WARN Local package.json exists, but node_modules missing, did you mean to install?

npm ERR! A complete log of this run can be found in:
npm ERR!     /home/node/.npm/_logs/2018-08-06T10_16_44_687Z-debug.log


Could you please check if there is an issue?

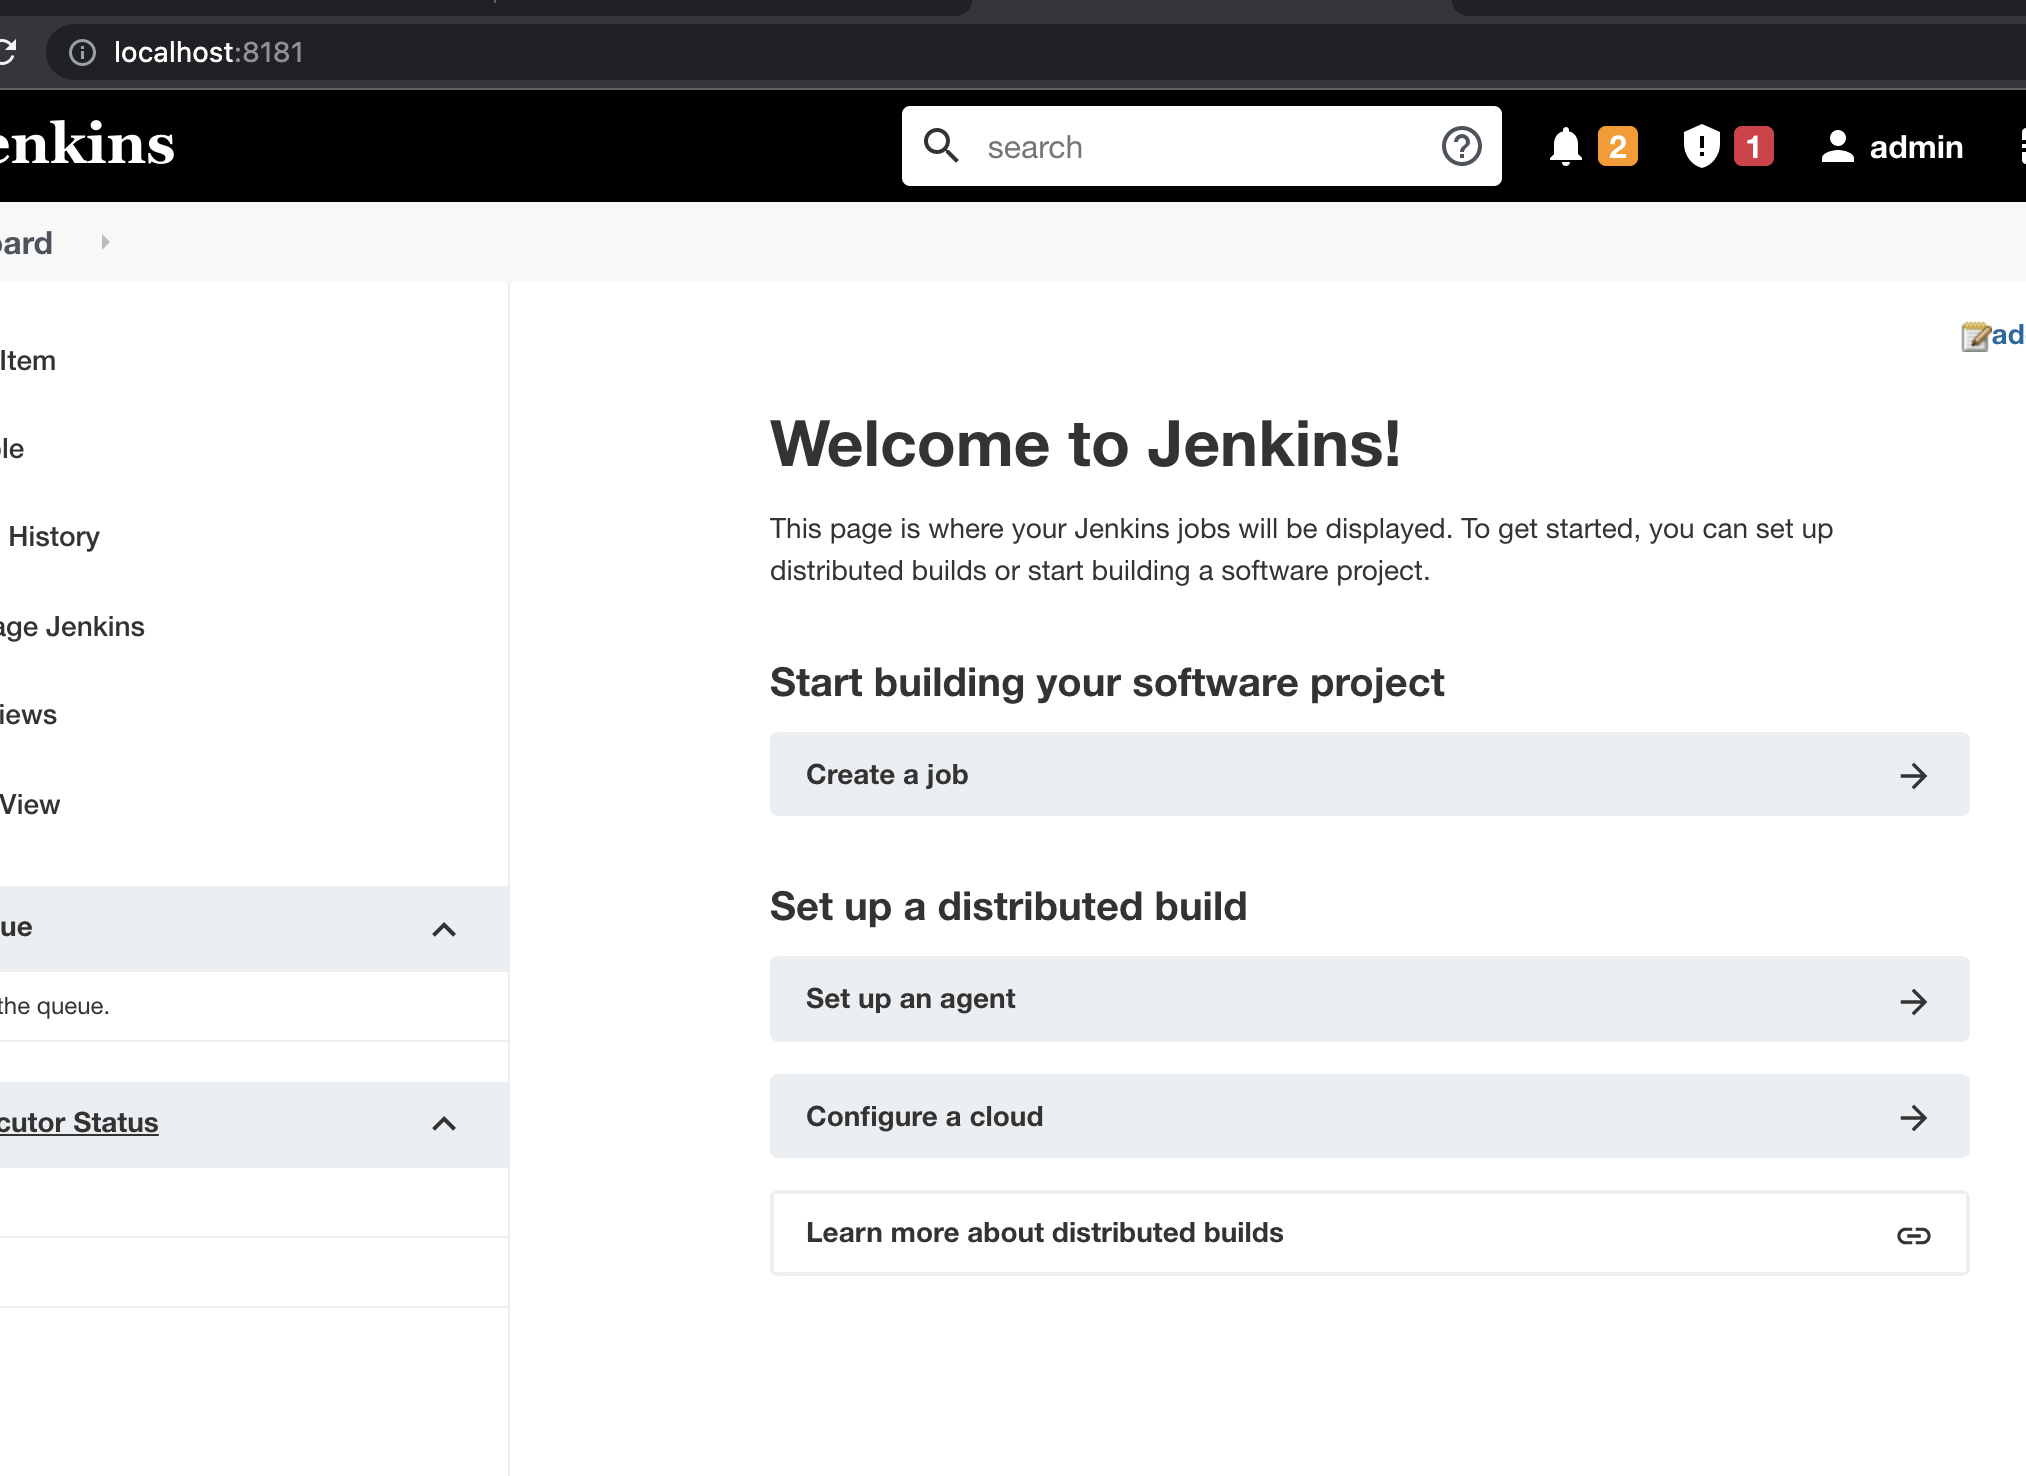
Not able to see job on jenkins

localhost:8181, after login to jenkins, we not able to see backend and front end jobs.

Also not sure how to find Jenkins home and where its getting create
Screen Shot 2021-10-14 at 4 32 10 PM
Screen Shot 2021-10-14 at 4 30 28 PM
d.

File does not exist

When I try to run the script from local jenkins (not docker jenkins), I'm getting below issue.
Capture

Добрый день!

Меня порекомендовали Вас, как отличного нагрузочного тестировщика. Я это прекрасно понимаю. Мне нужна ваша помощь, можете вы меня немного поменторить каким либо образом. Хотел бы собрать фреймворк похожий на Ваш, не хочу копипастить. Может можно как то организовать менторство с Вашей стороны? Очень хочется зайти в нагрузку, чтобы было хотя бы како нить портфолио. Если не сложно свяжитесь со мной по почте [email protected] или скайп. ЕСли честно я Вам писал, и туда и туда)))

telegraf | 2019-08-29T04:51:30Z E! [outputs.influxdb] when writing to [http://influxdb:8086]: Post http://influxdb:8086/write?consistency=any&db=telegraf: dial tcp 192.168.64.5:8086: connect: connection refused

Hello,

I am getting below error while running the same codebase.
Could you please advice, what wrong is being done here as I am unable to understand?

telegraf | 2019-08-29T04:51:20Z E! [outputs.influxdb] when writing to [http://influxdb:8086]: Post http://influxdb:8086/write?consistency=any&db=telegraf: dial tcp: lookup influxdb on 127.0.0.11:53: no such host

Thanks in advance.

Recommend Projects

  • React photo React

    A declarative, efficient, and flexible JavaScript library for building user interfaces.

  • Vue.js photo Vue.js

    🖖 Vue.js is a progressive, incrementally-adoptable JavaScript framework for building UI on the web.

  • Typescript photo Typescript

    TypeScript is a superset of JavaScript that compiles to clean JavaScript output.

  • TensorFlow photo TensorFlow

    An Open Source Machine Learning Framework for Everyone

  • Django photo Django

    The Web framework for perfectionists with deadlines.

  • D3 photo D3

    Bring data to life with SVG, Canvas and HTML. 📊📈🎉

Recommend Topics

  • javascript

    JavaScript (JS) is a lightweight interpreted programming language with first-class functions.

  • web

    Some thing interesting about web. New door for the world.

  • server

    A server is a program made to process requests and deliver data to clients.

  • Machine learning

    Machine learning is a way of modeling and interpreting data that allows a piece of software to respond intelligently.

  • Game

    Some thing interesting about game, make everyone happy.

Recommend Org

  • Facebook photo Facebook

    We are working to build community through open source technology. NB: members must have two-factor auth.

  • Microsoft photo Microsoft

    Open source projects and samples from Microsoft.

  • Google photo Google

    Google ❤️ Open Source for everyone.

  • D3 photo D3

    Data-Driven Documents codes.