Giter Club home page Giter Club logo

tdor2018's Introduction

Datathon for the Transgender Day of Rememberance

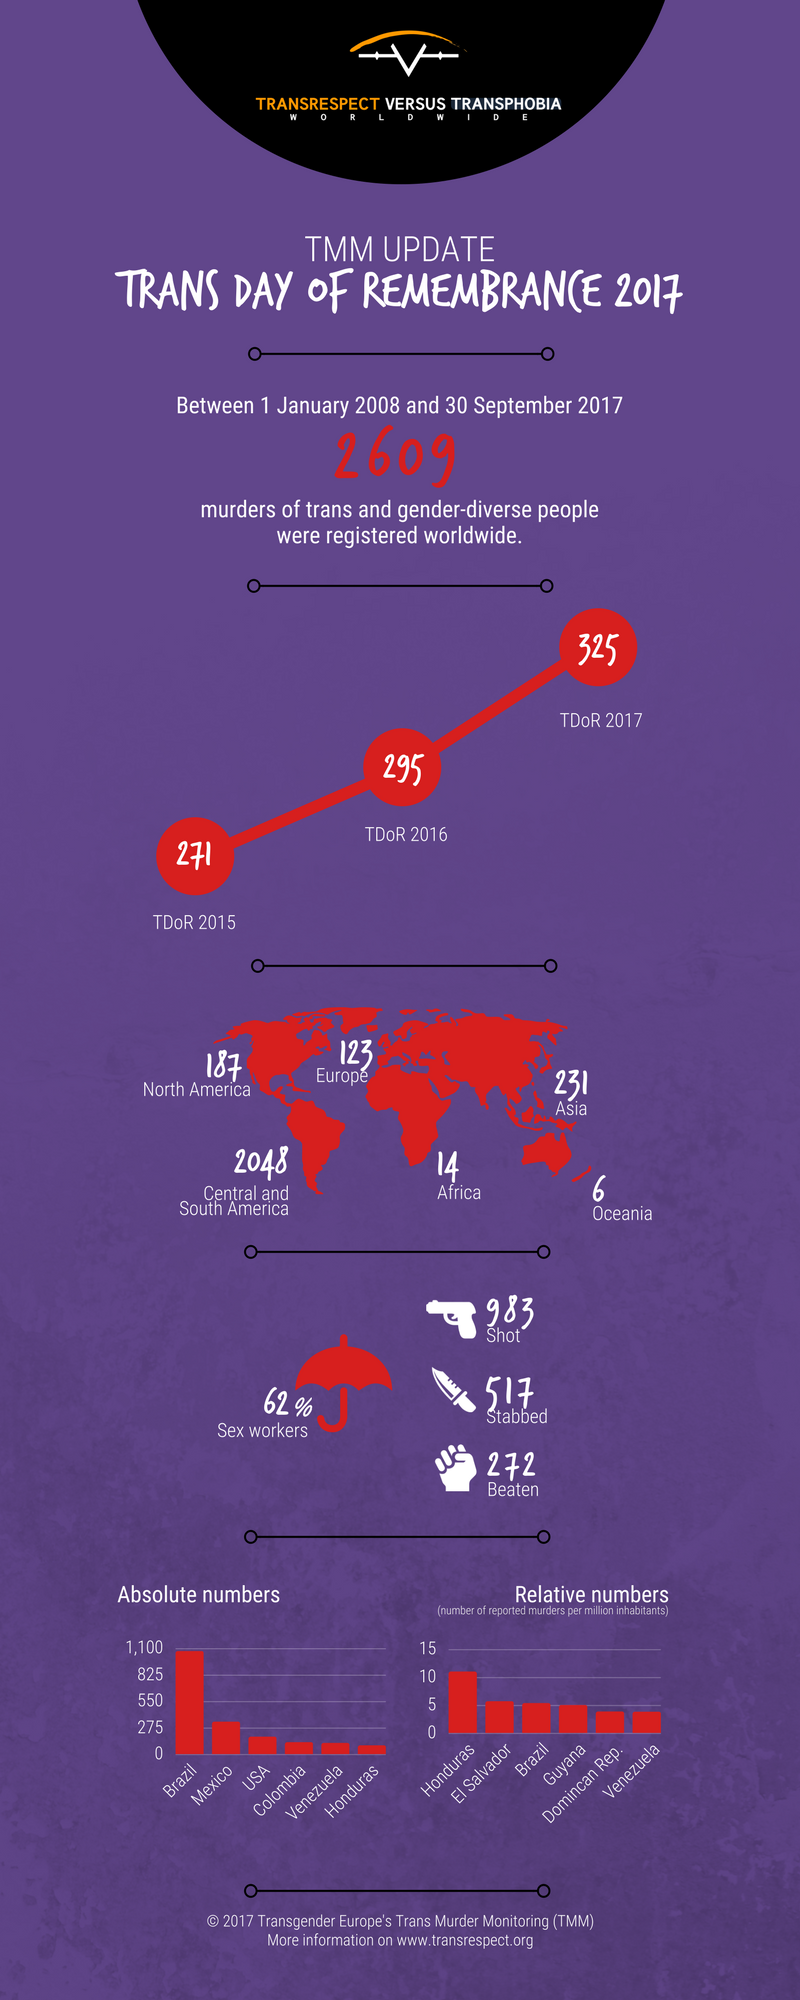
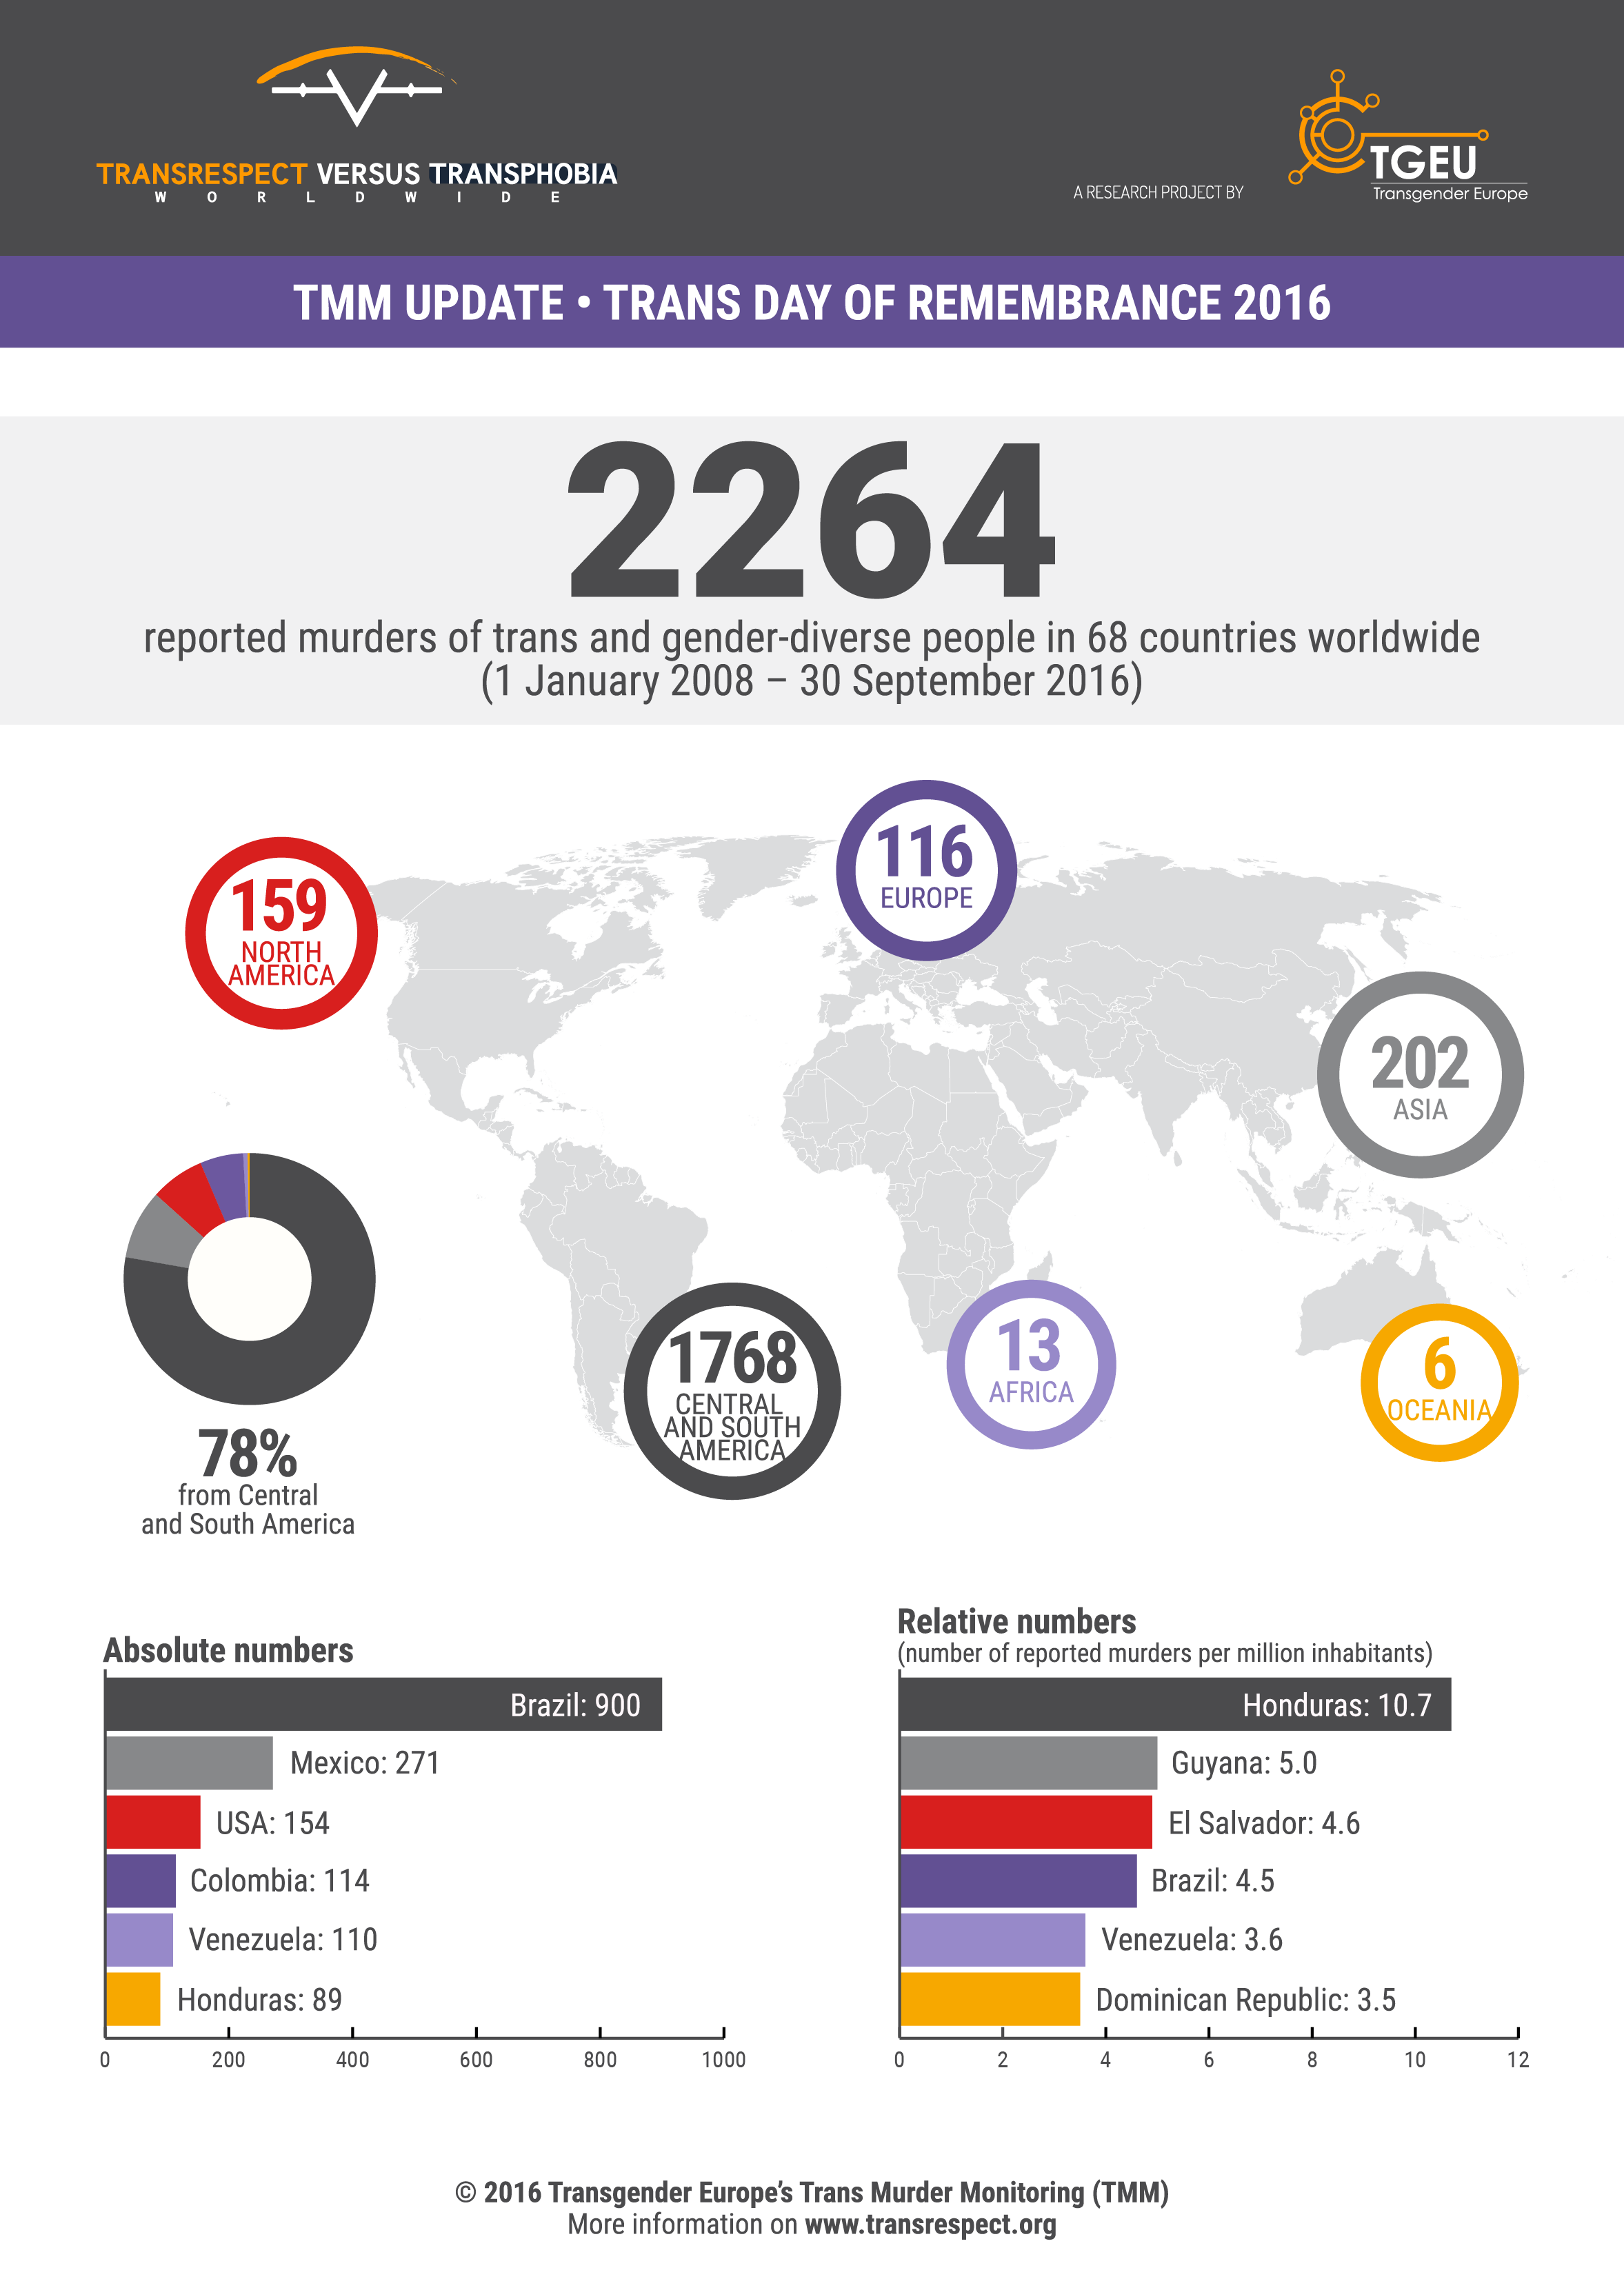
The Transgender Day of Remembrance (TDoR), observed annually on 20 November, memorializes those who were killed or lost to suicide as a result of anti-transgender hatred or prejudice in the past year.

We are holding a non-competitive datathon centred on the data collected by monitoring bodies and trans activists about relevant deaths, as collated for recent years on https://tdor.translivesmatter.info/. This repository will be used to share ideas and potentially host code and other documents generated as part of the datathon.

The main event will be hosted by the Cardiff R User Group on Saturday 17 November, 10:30am to 4:30pm, where we will welcome the maintainer of tdor.translivesmatter.info as an invited participant, see further details on Meetup.

The datathon is supported by Forwards (https://forwards.github.io/) and Rainbow R (who are hosting this repository!). We welcome remote participants:

For the story behind tdor.translivesmatter.info, see this Medium post.

For an intro the datathon, see these slides which will presented at the start of the Cardiff event to kick things off!

tdor2018's People

Contributors

sastoudt avatar hturner avatar

Stargazers

Sharon Howard avatar eli rider avatar Danielle Navarro avatar Kelsey Campbell avatar Paul Brennan avatar

Watchers

James Cloos avatar Eden WILL avatar  avatar  avatar Paul Brennan avatar Jemma Stachelek avatar Kelsey Campbell avatar Dave Parr avatar  avatar

Forkers

daveparr sastoudt

tdor2018's Issues

Publishing the data for recent years as an R package

Currently there are two ways to access the data

  1. Export as CSV for specific time period from website - export also includes photos, thumbnails (with photo on transgender flag and short description), qr codes in separate folders.
  2. Download monthly CSVs from Bitbucket repo.

An R package might

  • Have an update for each TDoR period
  • Contain combined CSV only? (links to permanent page for each individual)
  • Vignette with example code to produce global summaries, e.g. maps etc

Questions

  • Does this provide much value over existing facilities?
  • Would it be better to wait until/unless website has JSON API and instead write a package to extract using the API for analysis?

Adding in historical data

Currently we have data from 2010.

https://transrespect.org/en/trans-murder-monitoring/tmm-resources/ (current main source) goes back to 2009; we have a Python script to extract the data.

https://docs.google.com/spreadsheets/d/10_JeZ7LEIRhvewTCoL5mVkH6MQJzf7fSXl4-P6QJ0v0/edit#gid=0 from https://tdor.info has data from 1970 to 2012.

  • has the data since 2009 been merged with the tgeu data?
  • can we write a script to extract the pre 2009 data and create monthly csvs?
  • has the data since 2012 on https://tdor.info been merged?

Researching reports to add missing photos and other details

A photo and some background information about the person helps us to reflect on their lives, while news reports help us to validate the report of their death and understand more about the reasons behind it.

An on-going task is to fill the gaps in the database, c.f. #2.

Script for merging data sets?

Currently there is a Python script to extract data from the official Trans Murder Monitoring report. Is there a script for comparing/merging this data with the monthly CSVs produced during the year?

Add JSON API

Adding an API is one thing that has been considered as a feature to be added to the website.

If we have people with relevant expertise, this could be something to work on.

Script to identify missing data

It might be useful to have a script to identify records where we are missing information, to make it easy for people who want to contribute by researching and filling in the gaps.

Creating infographics for TDoR 2018

Although TDoR emphasises remembering the individuals, infographics can help to show the scale of the issue and provide some sobering facts.

For 2016 and 2017, TMM have produced some infographics:
https://transrespect.org/wp-content/uploads/2017/11/TvT_TMM_TDoR2017_Infographics_EN.png
https://transrespect.org/wp-content/uploads/2016/11/TvT_TMM_TDoR2016_Infographics_EN.png

Potential areas for exploration

  • Trends over time (TMM only look at 2015-2017)
  • Causes of death in different regions
  • Impact of political/legal changes

The style of graphics could also be something to consider - how suitable is it for sharing on Twitter or Facebook for example?

Translating English keywords to other languages to help search for relevant deaths

The following English keywords are helpful for finding new cases to add to the Transgender Day of Remembrance dataset:

Transvestite
Transsexual
Transgender
Trans
Man dressed as woman

Dead
Murdered
Killed
Stabbed
Shot
Mutilated
Dismembered
Suicide
Beaten

We would like to find people to translate these to the following languages (using equivalent keywords rather than direct translation if more relevant):

  • Albanian
  • Amharic
  • Arabic
  • Bahasa Indonesia
  • Belarussian
  • Cantonese
  • Farsi
  • Hausa
  • Hindi
  • Hungarian
  • Igbo
  • Indonesian
  • Japanese
  • Korean
  • Oromo
  • Malaysian
  • Mandarin
  • Polish
  • Portugese
  • Russian
  • Serbo-Croat
  • Shona
  • Spanish
  • Swahili
  • Tagalog
  • Thai
  • Turkish
  • Yoruba
  • Zulu

See https://github.com/rlgbtq/TDoR2018/tree/master/Data for details on how to contribute.

Contact form for people to submit new reports/updates

A contact form could be added to the website for people to submit new reports/updates.

Desirable features:

  • encryption to keep information private until it is verified
  • captcha to avoid spam (should be accessible to visually impaired)
  • related to separate email address with good spam protection (I know a provider we can ask who may provide a free one for a cause like this)
  • structured to make it easy to merge with existing data files via a script (once verified)

Creating a dashboard to explore the data

The website currently allows people to view filtered data as a map.

A dashboard could be created to allow more interactive exploration of the data. Initially this could be based on a static version of the data, potentially in future this could use an API to display the latest data.

c.f. #7 on creating infographics.

Recommend Projects

  • React photo React

    A declarative, efficient, and flexible JavaScript library for building user interfaces.

  • Vue.js photo Vue.js

    ๐Ÿ–– Vue.js is a progressive, incrementally-adoptable JavaScript framework for building UI on the web.

  • Typescript photo Typescript

    TypeScript is a superset of JavaScript that compiles to clean JavaScript output.

  • TensorFlow photo TensorFlow

    An Open Source Machine Learning Framework for Everyone

  • Django photo Django

    The Web framework for perfectionists with deadlines.

  • D3 photo D3

    Bring data to life with SVG, Canvas and HTML. ๐Ÿ“Š๐Ÿ“ˆ๐ŸŽ‰

Recommend Topics

  • javascript

    JavaScript (JS) is a lightweight interpreted programming language with first-class functions.

  • web

    Some thing interesting about web. New door for the world.

  • server

    A server is a program made to process requests and deliver data to clients.

  • Machine learning

    Machine learning is a way of modeling and interpreting data that allows a piece of software to respond intelligently.

  • Game

    Some thing interesting about game, make everyone happy.

Recommend Org

  • Facebook photo Facebook

    We are working to build community through open source technology. NB: members must have two-factor auth.

  • Microsoft photo Microsoft

    Open source projects and samples from Microsoft.

  • Google photo Google

    Google โค๏ธ Open Source for everyone.

  • D3 photo D3

    Data-Driven Documents codes.