Giter Club home page Giter Club logo

redmod-team / profit Goto Github PK

View Code? Open in Web Editor NEW
14.0 4.0 8.0 3.78 MB

Probabilistic Response mOdel Fitting with Interactive Tools

Home Page: https://profit.readthedocs.io

License: MIT License

Python 78.88% Mathematica 4.92% Fortran 6.01% Jupyter Notebook 9.60% CSS 0.04% Makefile 0.15% Julia 0.40%
uncertainty-quantification uq surrogate reduced-order-models reduced-order-surrogate-model model-emulation polynomial-chaos-expansion gaussian-processes active-learning

profit's Introduction

DOI PyPI Python Versions Code style: black Coverage Status

Documentation Status Install & Test Status pre-commit.ci status Publish to PyPI Status

Probabilistic Response Model Fitting with Interactive Tools

This is a collection of tools for studying parametric dependencies of black-box simulation codes or experiments and construction of reduced order response models over input parameter space.

proFit can be fed with a number of data points consisting of different input parameter combinations and the resulting output of the simulation under investigation. It then fits a response-surface through the point cloud using Gaussian process regression (GPR) models. This probabilistic response model allows to predict ("interpolate") the output at yet unexplored parameter combinations including uncertainty estimates. It can also tell you where to put more training points to gain maximum new information (experimental design) and automatically generate and start new simulation runs locally or on a cluster. Results can be explored and checked visually in a web frontend.

Telling proFit how to interact with your existing simulations is easy and requires no changes in your existing code. Current functionality covers starting simulations locally or on a cluster via Slurm, subsequent surrogate modelling using GPy, scikit-learn, as well as an active learning algorithm to iteratively sample at interesting points and a Markov-Chain-Monte-Carlo (MCMC) algorithm. The web frontend to interactively explore the point cloud and surrogate is based on plotly/dash.

Features

  • Compute evaluation points (e.g. from a random distribution) to run simulation
  • Template replacement and automatic generation of run directories
  • Starting parallel runs locally or on the cluster (SLURM)
  • Collection of result output and postprocessing
  • Response-model fitting using Gaussian Process Regression and Linear Regression
  • Active learning to reduce number of samples needed
  • MCMC to find a posterior parameter distribution (similar to active learning)
  • Graphical user interface to explore the results

Installation

Currently, the code is under heavy development, so it should be cloned from GitHub via Git and pulled regularly.

Requirements

sudo apt install python3-dev build-essential

To enable compilation of the fortran modules the following is needed:

sudo apt install gfortran

Dependencies

  • numpy, scipy, matplotlib, sympy, pandas
  • ChaosPy
  • GPy
  • scikit-learn
  • h5py
  • plotly/dash - for the UI
  • ZeroMQ - for messaging
  • sphinx - for documentation, only needed when docs is specified
  • torch, GPyTorch - only needed when gpu is specified

All dependencies are configured in setup.cfg and should be installed automatically when using pip.

Automatic tests use pytest.

Windows 10

To install proFit under Windows 10 we recommend using Windows Subsystem for Linux (WSL2) with the Ubuntu 20.04 LTS distribution (install guide).

After the installation of WSL2 execute the following steps in your Linux terminal (when asked press y to continue):

Make sure you have the right version of Python installed and the basic developer toolset available

sudo apt update
sudo apt install python3 python3-pip python3-dev build-essential

To install proFit from Git (see below), make sure that the project is located in the Linux file system not the Windows system.

To configure the Python interpreter available in your Linux distribution in pycharm (tested with professional edition) follow this guide.

Installation from PyPI

To install the latest stable version of proFit, use

pip install profit

For the latest pre-release, use

pip install --pre profit

Installation from Git

To install proFit for the current user (--user) in development-mode (-e) use:

git clone https://github.com/redmod-team/profit.git
cd profit
pip install -e . --user

Fortran

Certain surrogates require a compiled Fortran backend. To enable compilation of the fortran modules during install:

USE_FORTRAN=1 pip install .

Troubleshooting installation problems

  1. Make sure you have all the requirements mentioned above installed.

  2. If pip is not recognized try the following:

python3 -m pip install -e . --user
  1. If pip warns you about PATH or proFit is not found close and reopen the terminal and type profit --help to check if the installation was successful.

Documentation using Sphinx

Install requirements for building the documentation using sphinx

pip install .[docs]

Additionally pandoc is required on a system level:

sudo apt install pandoc

HowTo

Examples for different model codes are available under examples/:

  • fit: Simple fit via python interface.
  • mockup: Simple model called by console command based on template directory.

Also, the integration tests under tests/integration_tests/ may be informative examples:

  • active_learning:
    • 1D: One dimensional mockup with active learning
    • 2D: Two dimensional mockup with active learning
    • Log: Active learning with logarithmic search space
    • MCMC: Markov-Chain-Monte-Carlo application to mockup experimental data
  • mockup:
    • 1D
    • 2D
    • Custom postprocessor: Instead of the prebuilt postprocessor, a user-built class is used.
    • Custom worker: A user-built worker function is used.
    • Independent: Output with an independent (linear) variable additional to input parameters: f(t; u, v).
    • KarhunenLoeve: Multi output surrogate model with Karhunen-Loeve encoder.
    • Multi output: Multi output surrogate with two different output variables.

Steps

  1. Create and enter a directory (e.g. study) containing profit.yaml for your run. If your code is based on text configuration files for each run, copy the according directory to template and replace values of parameters to be varied within UQ/surrogate models by placeholders {param}.

  2. Running the simulations:

    profit run

    to start simulations at all the points. Per default the generated input variables are written to input.txt and the output data is collected in output.txt.

    For each run of the simulation, proFit creates a run directory, fills the templates with the generated input data and collects the results. Each step can be customized with the configuration file.

  3. To fit the model:

    profit fit

    Customization can be done with profit.yaml again.

  4. Explore data graphically:

    profit ui

    starts a Dash-based browser UI

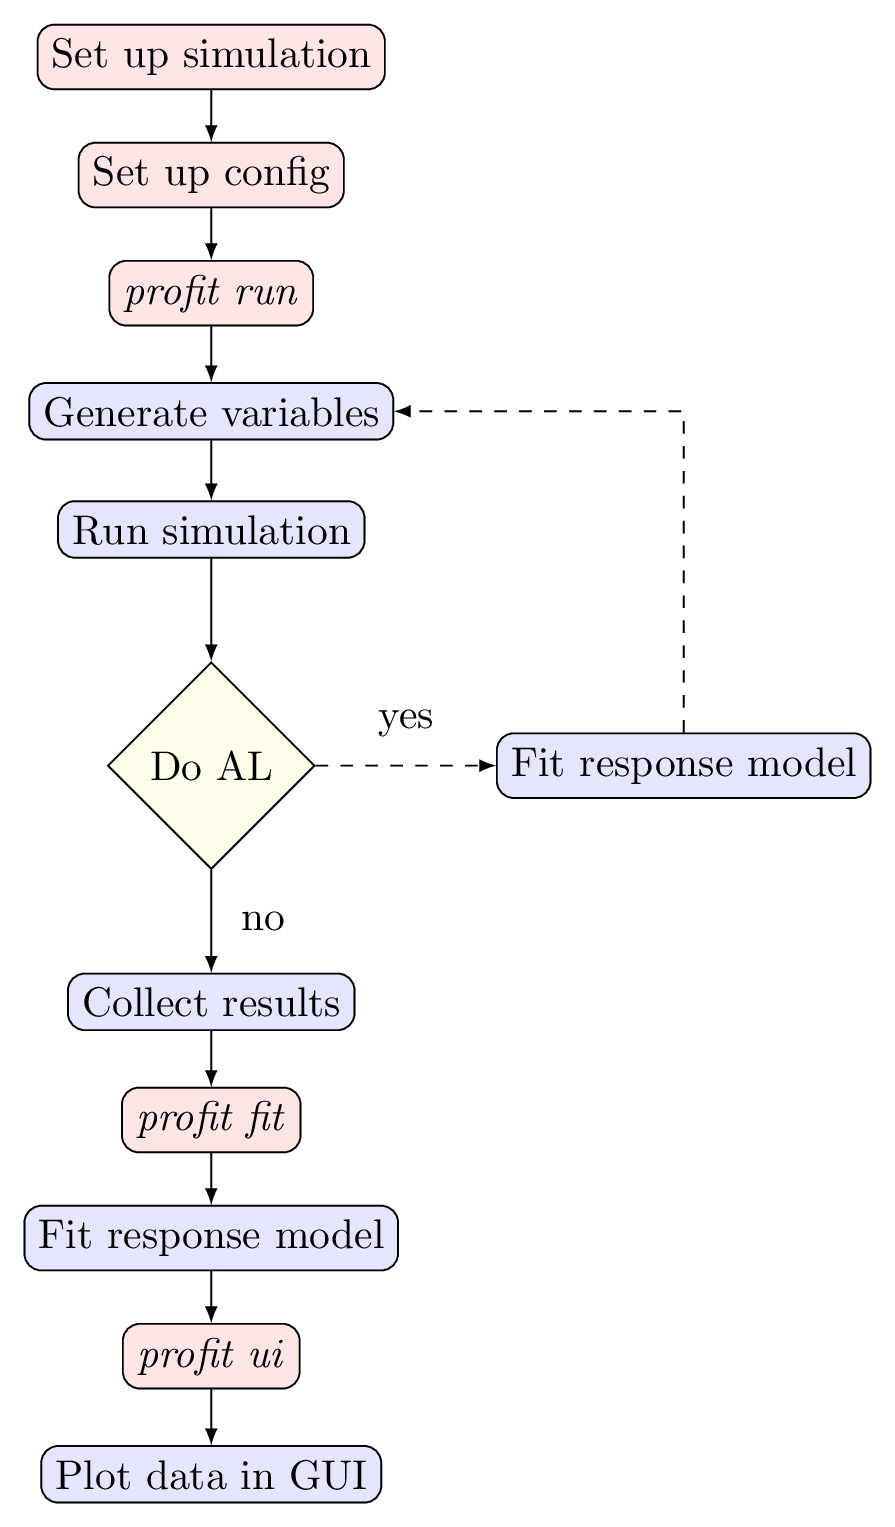
The figure below gives a graphical representation of the typical profit workflow described above. The boxes in red describe user actions while the boxes in blue are conducted by profit.

Cluster

proFit supports scheduling the runs on a cluster using slurm. This is done entirely via the configuration files and the usage doesn't change.

profit ui starts a dash server and it is possible to remotely connect to it (e.g. via ssh port forwarding)

User-supplied files

  • a configuration file: (default: profit.yaml)

    • Add parameters and their distributions via variables
    • Set paths and filenames
    • Configure the run backend (how to interact with the simulation)
    • Configure the fit / surrogate model
  • the template directory

    • containing everything a simulation run needs (scripts, links to executables, input files, etc)
    • input files use a template format where {variable_name} is substituted with the generated values
  • a custom Postprocessor (optional)

    • if the default postprocessors don't work with the simulation a custom one can be specified using the include parameter in the configuration.

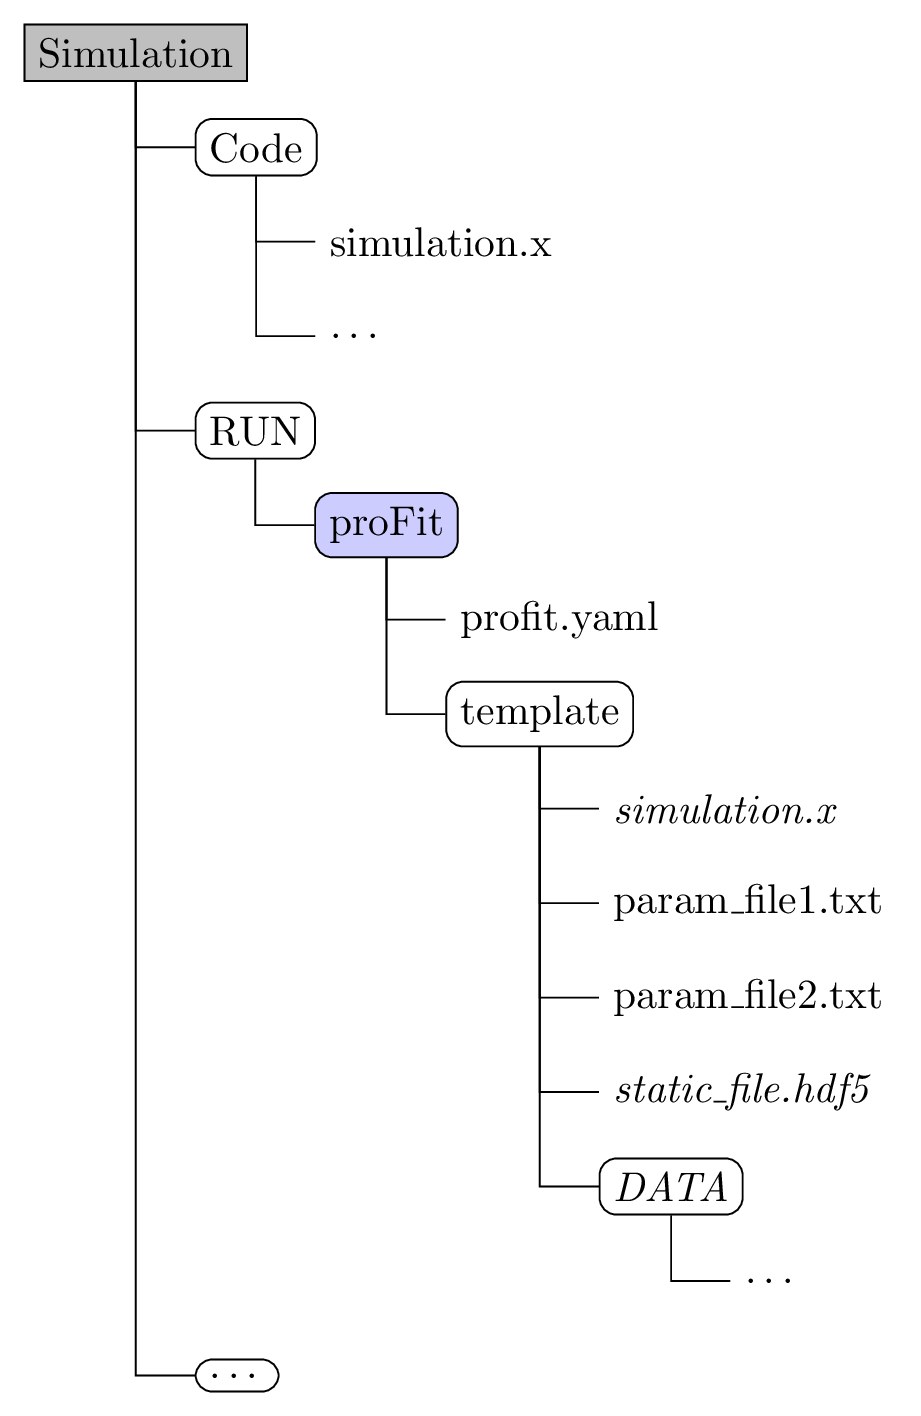
Example directory structure:

profit's People

Contributors

baptisterubino avatar kathirath avatar krystophny avatar manal44 avatar michad1111 avatar mkendler avatar pre-commit-ci[bot] avatar rykath avatar squadula avatar

Stargazers

 avatar  avatar  avatar  avatar  avatar  avatar  avatar  avatar  avatar  avatar  avatar  avatar  avatar  avatar

Watchers

 avatar  avatar  avatar  avatar

profit's Issues

Cleanup Config

Bring Config class and user interface in a clear form.

  • enhance Config options (also solves #29)
  • resolve path problems (also solves #19, #41)
  • standardize code formatting
  • update doc with Config options
  • make variable functions easily customizable (also solves #21)
  • optionally include Independent variable in inputs and treat as another parameter
  • save output as .txt or .hdf5
  • .py file with dict should also be a valid config file besides .yaml

profit binary not found on Windows/Anaconda

pip install -e . --user moves profit into %APPDATA%, which is usually not in %PATH% on Windows with Anaconda. Documentation should be updated to use pip install -e . on this setup.

Generating runs based on directory template

Many codes rely on a standardized directory structure for each run. To automatically generate run directories the user provides a template file. Placeholders for input parameters in the template file are automatically replaced by values for a specific run. This feature should be usable for both, online and offline runs, and also dynamically generated parameter vectors.

Consistent handling of relative paths

In profit.yaml and LocalCommand troubles can arise with relative paths. The most logical way from the user would be, to relate all occurances of ../ to the study directory, i.e. replace ../ by ../../../ everywhere (study/run/XX/ instead of study/).

The best place to change this is directly in LocalCommand, since the place from which people access the Python API is usually also in study, as the profit.yaml.

Symmetry of the Posterior Covariance Matrix

The posterior covariance matrix (cov_f_star) isn't perfectly symmetric.

There is an error of approximatly 1e-14:
The command : np.max(cov_f_star-np.transpose(cov_f_star)) returns a value arround 1e-14

Implement PC-Kriging with additive GP

After projecting to a low-order spectral basis (PCE for global UQ) one can model the residue by a GP with an additive kernel. This allows for modeling complex behavior and sensitivity analysis (ANOVA / Sobol indices)

Different functions doing the same task

In the file profit.sur.backend the following functions do the same task:

  • To return any of the covariance matrices K(X_train,X_train) ; K(X_test,X_test) ; K(X_test,X_train) :
  1. kernels.gp_matrix(x0, x1, a, K)
  2. gp.gp_matrix(x0, x1, a, K)
  3. gp_functions.k(x0, x1, l)
  • To return the covariance matrix K(X_train,X_train):
  1. kernels.gp_matrix(x0, x1, a, K)
  2. gp.gp_matrix_train(x, a, sigma_n) (the only difference is the added gaussian noise sigma_n on the diagonal of K(X_train,X_train))

Parameter scan to compare two codes

A user develops a new numerical method that is faster at the same accuracy than existing methods. He wants to produce plots of accuracy vs computation time for his new code as well as an existing one.

Old code

Input parameters:

  • relative tolerance, logarithmic from 1e-6 to 1e-12
    Output parameters:
  • computation time
  • accuracy

New code

Input parameters:

  • step size, logarithmic from 1e-1 to 1e-3
    Output parameters:
  • computation time
  • accuracy

It should be possible to plot two outputs against each other here. So one would fit a response model with x = computation time and y = accuracy.

Stitching together data

Implement possibility to shift x-axis of data such that two data sources are stitched together in the optimum way. This will require a hyperparameter that quantifies the relative shift.

More complete variance estimate

Include

  • Laplace approximation around MAP values (or multiple peaks) in hyperparameter space
  • Variance due to (not necessarily simple) linear mean model according to Rasmussen 2.7

Check number of cores

If the option ntask = n is used for parallel computing, check the number of available cores before starting the computation.

Integrate tool to explore conditional probability distributions

For the work with Ulrich Callies from HZG a tool was developed to explore conditional distributions with one or more variables fixed in a certain range. Then the marginal distributions of the remaining variables are plotted as histograms and/or with a kernel density estimator. This way a high-dimensional probability distribution can be explored in an intuitive way.

Consistent definition of sigma_f and sigma_n

In proFit, the hyperparameter vector used is: [ l=length-scale , sigma^2 = (sigma_n/sigma_f)^2 ] in order to normalize.

Adapt the written functions to this definition:

  1. Replace l^2 by l in the functions' arguments.
  2. Add a documentation for sigma .
  3. Add an indication about the choice of sigma_f (ex: sigma_f always equal to 1) since it isn't a parameter of the kernel functions.
  4. Handle the evantual different values for the same variable sigma_f given that it becomes an implicit argument for the functions which build the Covariance Matrices K(X_test,X_test) ; K(X_test,X_training) ; K(X_training,X_training) .

Final name for code

Redmod is too generic and SurUQ sounds too orcish. Instead of Surrogate the word parameter should be in focus. Suggestions:

  • Paris - Parameter space regression including sensitivities
  • Paras - Parameter space regression with analysis of sensitivities
  • Parami - Parameter space regression with analysis ...
  • Parma - Parameter space
  • Supar - Surrogates and UQ via Parameter space regression
  • Hypar - Handling your parameter space regression

Explore and leverage parallels to easyVVUQ

  • Starting and managment of of runs on cluster
  • Check out amzn/emukit: A Python-based toolbox of various methods in uncertainty quantification and statistical emulation: multi-fidelity, experimental design, Bayesian optimisation, Bayesian quadrature, etc.

Fix the path conventions

In some cases, to use a function in proFIt, it is required to indicate its whole path: from the root file: profit.profit. ... instead of just starting it from the current file.

Make three-digit run folders standard

Right now, run folders are created as "0, 1, 2, 3, ..., 10, 11, ...". For better sorting in the file manager and console it should be standard to have "000, 001, 002, ..." which supports up to 1000 run folders. More generally one should put a configuration option ndigit in the run section of profit.yaml that defaults to three.

Add HDF5 MPI support

When doing distributed runs on the cluster, all output must be written in a concurrency-sage way. HDF5 with MPI communication looks like a reasonable choice.

Cleanup Surrogates

Standardize surrogates. For now only Custom and GPy.

  • set structure in abstract class
  • implement interfaces to Config, so the surrogate to be used can easily be selected
  • cleanup Custom surrogate functions and add docstrings
  • make Fortran kernels user friendly
  • provide standard kernels in python
  • implement methods, so every surrogate has the same (e.g. train, add_training_data, predict, plot, etc.) and can be accessed by a standardized interface
  • implement / revise different calculation methods in backend for Custom surrogate. Make them easily extendable by future developers

Running offline with input/output files

The user would like to run his code independently from suruq. Therefore the user takes the following steps

  1. Run profit in preprocessing mode to generate input file with a table of input parameters
  2. Run code based on different parameter combinations in input file
  3. Collect results in output file with format readable by profit
  4. Do postprocessing in profit

Interfacing to input/output file should be easy and done by the user. For this purpose a txt and a hdf5 standard format will be supplied.

Implement Active learning

  • create a standardized interface between 'run' and surrogates' active learning
  • create actual Active Learning process (fills input.txt with points, that contribute the most information)
  • create test cases and benchmark

Automatic runs at specific points

The user wants to specify points where the response should be evaluated. Based on a user-supplied template she tells profit to generate a set of directories and a batch submission script.

Remarks:

  1. A template for a single code run is required as well as a for the submission script, as queuing system and specific requirements of the code are not known. One could supply "template templates" for the most common queuing systems. One should not reinvent the wheel by adding a lot of options that SLURM/PBS already supply in their file format that most users know.

Recommend Projects

  • React photo React

    A declarative, efficient, and flexible JavaScript library for building user interfaces.

  • Vue.js photo Vue.js

    ๐Ÿ–– Vue.js is a progressive, incrementally-adoptable JavaScript framework for building UI on the web.

  • Typescript photo Typescript

    TypeScript is a superset of JavaScript that compiles to clean JavaScript output.

  • TensorFlow photo TensorFlow

    An Open Source Machine Learning Framework for Everyone

  • Django photo Django

    The Web framework for perfectionists with deadlines.

  • D3 photo D3

    Bring data to life with SVG, Canvas and HTML. ๐Ÿ“Š๐Ÿ“ˆ๐ŸŽ‰

Recommend Topics

  • javascript

    JavaScript (JS) is a lightweight interpreted programming language with first-class functions.

  • web

    Some thing interesting about web. New door for the world.

  • server

    A server is a program made to process requests and deliver data to clients.

  • Machine learning

    Machine learning is a way of modeling and interpreting data that allows a piece of software to respond intelligently.

  • Game

    Some thing interesting about game, make everyone happy.

Recommend Org

  • Facebook photo Facebook

    We are working to build community through open source technology. NB: members must have two-factor auth.

  • Microsoft photo Microsoft

    Open source projects and samples from Microsoft.

  • Google photo Google

    Google โค๏ธ Open Source for everyone.

  • D3 photo D3

    Data-Driven Documents codes.