Giter Club home page Giter Club logo

youplot's Introduction


Build Status Gem Version DOI Docs Stable The MIT License

YouPlot is a command line tool that draws plots on the terminal.

📊 Powered by UnicodePlot

Installation

brew install youplot
gem install youplot
guix install youplot
conda install -c conda-forge ruby
conda install -c conda-forge compilers
gem install youplot

Quick Start

barplot histogram scatter density boxplot

uplot <command> [options] <data.tsv>

barplot

curl -sL https://git.io/ISLANDScsv \
| sort -nk2 -t, \
| tail -n15 \
| uplot bar -d, -t "Areas of the World's Major Landmasses"

barplot

# For offline user: Sorts files in a directory by size and shows a bar graph.
ls -l | awk '{print $9, $5}' | sort -nk 2 | uplot bar -d ' '

histogram

echo -e "from numpy import random;" \
        "n = random.randn(10000);"  \
        "print('\\\n'.join(str(i) for i in n))" \
| python3 \
| uplot hist --nbins 20

histogram

lineplot

curl -sL https://git.io/AirPassengers \
| cut -f2,3 -d, \
| uplot line -d, -w 50 -h 15 -t AirPassengers --xlim 1950,1960 --ylim 0,600

lineplot

# For offline users: Calculates sin values (0-2*pi) and plots a sine wave.
python3 -c '
from math import sin, pi
data = "\n".join(f"{i*pi/50}\t{sin(i*pi/50)}" for i in range(101))
print(data)' | uplot line

scatter

curl -sL https://git.io/IRIStsv \
| cut -f1-4 \
| uplot scatter -H -t IRIS

scatter

# For offline users
cat test/fixtures/iris.csv | cut -f1-4 -d, | uplot scatter -H -d, -t IRIS

density

curl -sL https://git.io/IRIStsv \
| cut -f1-4 \
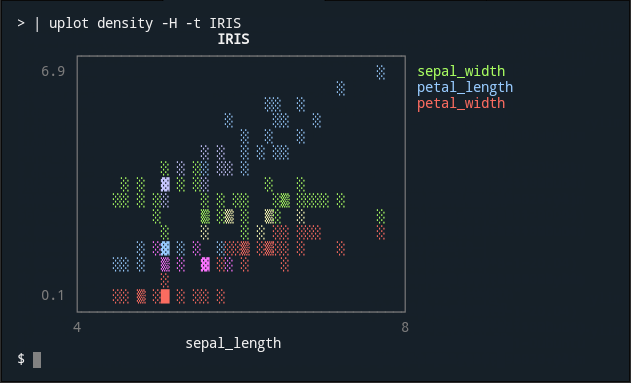
| uplot density -H -t IRIS

density

# For offline users
cat test/fixtures/iris.csv | cut -f1-4 -d, | uplot density -H -d, -t IRIS

boxplot

curl -sL https://git.io/IRIStsv \
| cut -f1-4 \
| uplot boxplot -H -t IRIS

boxplot

# For offline users
cat test/fixtures/iris.csv | cut -f1-4 -d, | uplot boxplot -H -d, -t IRIS

count

Count processes by user ID.

ps aux | awk '{print $1}' | uplot count

Count the number of chromosomes where genes are located.

cat gencode.v35.annotation.gff3 \
| grep -v '#' | grep 'gene' | cut -f1 \
| uplot count -t "The number of human gene annotations per chromosome"  -c blue

count

Note: count is not very fast because it runs in a Ruby script. This is fine in most cases, as long as the data size is small. If you want to visualize huge data, it is faster to use a combination of common Unix commands as shown below.

cat gencode.v35.annotation.gff3 | grep -v '#' | grep 'gene' | cut -f1 \
| sort | uniq -c | sort -nrk1 \
| uplot bar --fmt yx -d ' ' -t "The number of human gene annotations per chromosome"  -c blue

Usage

Commands

uplot is the shortened form of youplot. You can use either.

Command Description
cat data.tsv | uplot <command> [options] Take input from stdin
uplot <command> [options] data.tsv ... Take input from files
pipeline1 | uplot <command> -O | pipeline2 Outputs data from stdin to stdout

Subcommands

The following sub-commands are available.

command short how it works
barplot bar draw a horizontal barplot
histogram hist draw a horizontal histogram
lineplot line draw a line chart
lineplots lines draw a line chart with multiple series
scatter s draw a scatter plot
density d draw a density plot
boxplot box draw a horizontal boxplot
count c draw a barplot based on the number of occurrences (slow)
colors color show the list of available colors

Output the plot

  • -o
    • By default, the plot is output to standard error output.
    • If you want to output to standard output, Use hyphen -o - or no argument uplot s -o | .

Output the input data

  • -O
    • By default, the input data is not shown anywhere.
    • If you want to pass the input data directly to the standard output, Use hyphen -O - or no argument uplot s -O |.
    • This is useful when passing data to a subsequent pipeline.

Header

  • -H
    • If input data contains a header line, you need to specify the -H option.

Delimiter

  • -d
    • You do not need to use -d option for tab-delimited text since the default value is tab.
    • To specify a blank space, you can use uplot bar -d ' ' data.txt.

Real-time data

  • -p --progress
    • Experimental progressive mode is currently under development.
    • ruby -e 'loop{puts rand(100)}' | uplot line --progress

Show detailed options for subcommands

  • --help
    • The --help option will show more detailed options for each subcommand.
    • uplot hist --help

Set columns as x-axis or y-axis

  • YouPlot treats the first column as the X axis and the second column as the Y axis. When working with multiple series, the first column is the X axis, the second column is series Y1, the third column is series Y2, and so on.

  • If you pass only one column of data for line and bar, YouPlot will automatically use a sequential number starting from 1 as the X-axis.

  • --fmt

    • --fmt xyy --fmt xyxy --fmt yx options give you a few more choices. See youplot <command> --help for more details.
    • The fmt option may be renamed in the future.
    • The -x and -y options might be used to specify columns in the future.
  • Use awk '{print $2, $1}' to swap columns. Use paste to concatenate series.

Categorical data

  • With GNU datamash, you can manage to handle categorized data.
    • cat test/fixtures/iris.csv | sed '/^$/d' | datamash --header-in --output-delimiter=: -t, -g5 collapse 3,4 | cut -f2-3 -d: | sed 's/:/\n/g' | uplot s -d, -T --fmt xyxy
    • This is not so easy...

Time series

  • Not yet supported.

YouPlot Configuration (youplotrc)

You can specify default options in a configuration file in YAML format. For more information, enter the following command.

uplot --config

Tools that are useful to use with YouPlot

Contributing

YouPlot is a library under development, so even small improvements like typofix are welcome! Please feel free to send us your pull requests.

  • Report bugs
  • Fix bugs and submit pull requests
  • Write, clarify, or fix documentation
    • English corrections by native speakers are welcome.
  • Suggest or add new features
  • Make a donation

Development

# fork the main repository by clicking the Fork button. 
git clone https://github.com/your_name/YouPlot
bundle install             # Install the gem dependencies
bundle exec rake test      # Run the test
bundle exec rake install   # Installation from source code
bundle exec exe/uplot      # Run youplot (Try out the edited code)
Do you need commit rights to my repository?
Do you want to get admin rights and take over the project?
If so, please feel free to contact us.

Acknowledgements

License

MIT License.

youplot's People

Contributors

284km avatar gemmaro avatar kikiseries avatar kojix2 avatar muxator avatar to226 avatar

Stargazers

 avatar  avatar  avatar  avatar  avatar  avatar  avatar  avatar  avatar  avatar  avatar  avatar  avatar  avatar  avatar  avatar  avatar  avatar  avatar  avatar  avatar  avatar  avatar  avatar  avatar  avatar  avatar  avatar  avatar  avatar  avatar  avatar  avatar  avatar  avatar  avatar  avatar  avatar  avatar  avatar  avatar  avatar  avatar  avatar  avatar  avatar  avatar  avatar  avatar  avatar  avatar  avatar  avatar  avatar  avatar  avatar  avatar  avatar  avatar  avatar  avatar  avatar  avatar  avatar  avatar  avatar  avatar  avatar  avatar  avatar  avatar  avatar  avatar  avatar  avatar  avatar  avatar  avatar  avatar  avatar  avatar  avatar  avatar  avatar  avatar  avatar  avatar  avatar  avatar  avatar  avatar  avatar  avatar  avatar  avatar  avatar  avatar  avatar  avatar  avatar

Watchers

 avatar  avatar  avatar  avatar  avatar  avatar  avatar  avatar  avatar  avatar  avatar  avatar  avatar  avatar  avatar  avatar  avatar  avatar  avatar  avatar  avatar

youplot's Issues

Log scales ?

Is log scales possible? Any plans to add it? Thanks.

Progressive mode

It may not be a very practical idea. But I would like to see a progressive mode. Some programs take a long time to run and gradually output the results to standard output. In that case, waiting until all the output is finished would take a long time. I'd like to have a mechanism to pass the results to the next pipeline before all the outputs are finished. However, I think it would be very difficult to create such a mechanism.

Why are my line charts ugly?

1692144530

I use alacritty as my terminal, and the line charts do not look like the one in the screenshots. Am I doing something wrong?

Format the bar labels as integer (or omit entirely)

I'm using the following command (example)

<...data...> | uplot bar -c blue -t "sindresorhus/awesome" --xlabel "commits (last 12m)"

to generate a bar chart like this:
image

In this case, the X value will always be an integer. Any way to drop that .0 and display it as a whole number? Or remove the label altogether and just print an x-axis at the top or bottom?

Count does not support height parameter

Following the README example for the count plot, when setting the height there is an unknown keyword: height error thrown by the initialize function.

$ cat gencode.v43.annotation.gff3 | grep -v '#' | grep 'gene' | cut -f1 | uplot count -t "The number of human gene annotations per chromosome" -c blue -h 80 
/opt/homebrew/Cellar/youplot/0.4.5/libexec/gems/unicode_plot-0.0.5/lib/unicode_plot/plot.rb:10:in `initialize' 
unknown keyword: height 

Installed via homebrew.
YouPlot: 0.4.5
MacOS: 13.2.1 (Apple Silicon)

Not able to install it

Hi,
when I run gem install youplot, I get

ERROR:  Error installing youplot:
        ERROR: Failed to build gem native extension.

    current directory: /var/lib/gems/2.7.0/gems/enumerable-statistics-2.0.7/ext/enumerable/statistics/extension
/usr/bin/ruby2.7 -I /usr/lib/ruby/vendor_ruby -r ./siteconf20230210-37033-1c7xhuv.rb extconf.rb
mkmf.rb can't find header files for ruby at /usr/lib/ruby/include/ruby.h

You might have to install separate package for the ruby development
environment, ruby-dev or ruby-devel for example.

extconf failed, exit code 1

How to solve it?

Thank you

Provide binary for linux

It'd be great to have a way to try out this package without going through the ruby toolchain.

This package looks interesting, but I couldn't find a way to try it out. I've never worked with ruby/gems before, and I ran into some file permission issues trying to set that all up. Having the package available through a cross-platform package manger would certainly be convenient, but a simple binary on github would be very useful at the moment; especially for us non-ruby folk.

Relevant:

Even if the configuration file is present, you may get a message that it is not detected.

Command

youplot --config

Error

Configuration file not found.
It should be a YAML file, like this example:
  width : 40
  height : 20
By default, YouPlot will look for the configuration file in these locations:
  .youplot.yml
  .youplotrc
  /home/kojix2/.youplotrc
  /home/kojix2/.youplot.yml
  /home/kojix2/.config/youplot/youplotrc
  /home/kojix2/.config/youplot/youplot.yml
If you have the file elsewhere, you can specify its location with the `MYYOUPLOTRC` environment variable.

provide install via Homebrew

Project looks great, just thinking it would be nice to have install available via os package manager as well.

Meaning of -H option. With header? Or without header?

csvtk is a great command line tool.
In csvtk, the -H option means that there are no header lines.

In YouPlot, on the other hand, the -H option means that there is a header line.

I thought about reversing the meaning of the -H option in YouPlot.

No.

YouPlot is designed to be used with other Unix command line tools.
It is true that YouPlot can display CSV files.
However, it is more likely that you will get data from standard input.

YouPlot uses tab delimiters by default.
Since many command line tools produce tab-delimited output.

Because of this policy, the meaning of the -H option will not change.

This might make a bit of confusion when using csvtk and YouPlot.
However, I have decided to stick with the current policy.
I may change my mind again in the future.

So if you have an idea, feel free to enter your opinion in the input box below.

Working with categorical data

YouPlot does not handle category data easily.

YouPlot is a simple command line tool. I don't want to add functionality to YouPlot.
I would like to make more use of other command line tools that can handle categorical data.
The problem is that there is no such tool.

Gnu datamash has the ability to handle categorical data by group by and collapse. However, this is quite inconvenient.

I am looking for ideas to handle categorical data in YouPlot.

configuration file

YouPlot is a Ruby script, and its configuration is easy.
However, it may be useful to have a configuration file.
I'm not sure if this is really necessary. It's just an idea.

test data?

Because of network reasons, I can't download the sample data using curl. Can you provide it in github conveniently? Thank you.

Introduce 'l' as a short form of line

Currently, there are four sub commands: line, lines, lineplot, and lineplots.
In practice, however, lineplot and lineplots are rarely used.

line is relatively long compared to s, the short form of scatter.
So I would like to introduce 'l' as a short form of line.

The problem is that there are two types of line: line and lines.
We need to consider whether there will be any confusion between the two types of lines.

uplot: command not found

I suspect documentation is not complete, not sure how to resolve this:

macbook:test$ gem install youplot
Fetching youplot-0.4.5.gem
Fetching unicode_plot-0.0.5.gem
Fetching enumerable-statistics-2.0.7.gem
Building native extensions. This could take a while...
Successfully installed enumerable-statistics-2.0.7
Successfully installed unicode_plot-0.0.5
Successfully installed youplot-0.4.5
Parsing documentation for enumerable-statistics-2.0.7
Installing ri documentation for enumerable-statistics-2.0.7
Parsing documentation for unicode_plot-0.0.5
Installing ri documentation for unicode_plot-0.0.5
Parsing documentation for youplot-0.4.5
Installing ri documentation for youplot-0.4.5
Done installing documentation for enumerable-statistics, unicode_plot, youplot after 1 seconds
3 gems installed
macbook:test$ uplot
-bash: uplot: command not found

Recommend Projects

  • React photo React

    A declarative, efficient, and flexible JavaScript library for building user interfaces.

  • Vue.js photo Vue.js

    🖖 Vue.js is a progressive, incrementally-adoptable JavaScript framework for building UI on the web.

  • Typescript photo Typescript

    TypeScript is a superset of JavaScript that compiles to clean JavaScript output.

  • TensorFlow photo TensorFlow

    An Open Source Machine Learning Framework for Everyone

  • Django photo Django

    The Web framework for perfectionists with deadlines.

  • D3 photo D3

    Bring data to life with SVG, Canvas and HTML. 📊📈🎉

Recommend Topics

  • javascript

    JavaScript (JS) is a lightweight interpreted programming language with first-class functions.

  • web

    Some thing interesting about web. New door for the world.

  • server

    A server is a program made to process requests and deliver data to clients.

  • Machine learning

    Machine learning is a way of modeling and interpreting data that allows a piece of software to respond intelligently.

  • Game

    Some thing interesting about game, make everyone happy.

Recommend Org

  • Facebook photo Facebook

    We are working to build community through open source technology. NB: members must have two-factor auth.

  • Microsoft photo Microsoft

    Open source projects and samples from Microsoft.

  • Google photo Google

    Google ❤️ Open Source for everyone.

  • D3 photo D3

    Data-Driven Documents codes.