react-financial / react-financial-charts Goto Github PK
View Code? Open in Web Editor NEWCharts dedicated to finance.
Home Page: https://react-financial.github.io/react-financial-charts/
License: MIT License
Charts dedicated to finance.
Home Page: https://react-financial.github.io/react-financial-charts/
License: MIT License
Dependabot will increase the package-lock.json only to widen the versions.
I'd like to always increase versions to avoid confusion.
Hello,
Thank you for your great project. I would like to know if this issue with the changes which made has been resolved or your chart also has the same problem?
rrag/react-stockcharts#715
I'm trying to create a custom interactive object and it'd be useful to have the interactive components and utils used in the default components such as MouseLocationIndicator, ClickableCircle, getValueFromOverride etc...
when dynamically adding a drawing this.nodes in saveNodeType function in interactive/utils.ts is undefined, which crashes the app
add a drawing
error is fixed by this check
  return node => {
+    if (isDefined(this.nodes)) {
      if (isNotDefined(node) && isDefined(this.nodes[type])) {
        delete this.nodes[type]
      } else {
        this.nodes[type] = node
      }
+    } else {
+      this.nodes = []
+    }
   }
}
#### Please tell us about your environment

- Version: 0.5.1
- Browser: [all]

#### Other information

TypeError: this.nodes is undefined
saveNodeType/<

  63298 |     delete this.nodes[type];
  63299 |   } else {
  63300 |     // @ts-ignore
> 63301 |     this.nodes[type] = node;
        |     ^  63302 |   } // console.error(this.nodes)
  63303 |
  63304 | };
when we apply indicators to the chart it can not take over the size from the chart, it needs to go below the chart when applied and when is removed the chart must go back to its size.
it is not available.
When I try to add an interactive element such as a Trendline I get the following error:
TypeError: Cannot destructure property 'textWidth' of 'this.state' as it is null. in the component HoverTextNearMouse line 103.
The error is thrown after selecting the second point of the Trendline.
I also tried with a Fibonacci retracement and in this case the error occurs at the first click.
Looking at the code I see that the state is never being initialized as the constructor is missing.
Is there anyway to set the default zoom?
Right now my chart shows all data available, but I'd like it to default zoom to only the last week. What is the correct prop to set it?
Thanks for the great work btw!
It seems that there's no documentation on how to make InteractiveYCoordinate work and all my tests failed so I'm assuming it is not supported yet.
I currently see a "TypeError: Cannot set property 'priceCoordinate' of undefined" Error.
Boxes for items like orders or dynamic supports and resistances.
Please see example below:

Nice library. Any chance of adding Line Break charts to it in the future?
I think there are four mouse behaviors requiring improvements.
Activate zoom in and zoom out only when the chart is on focus, i.e., after the user clicked on it. This is helpful when the user scroll across the whole page where the chart is not the only components. The current setup will create a disturbance for the users and mess up their desired chart setup.
The direction of movement of the drawings when scrolling left and right should be consistent with the natural direction of the scrolling when on a touchpad (e.g., using two fingers). The current direction is opposite and creates poor user experience. I know this the correct direction when people used to use a mouse to drag the scrolling bar. However, when more and more users are more familiar to smart phones/touchpad/iPad, when they scroll left, they mean the content should go left.
It should not be a blank canvas when users scroll left or right or zoom in too much. That is not what most users want. When users try to move the chart to as left as possible, that normally only means they want to see the current price (in the context of other recent candle sticks as seen by default). Maybe we can still show a couple of blank spaces to indicate that there are no more candles hidden on the right, but there should be no more blank spaces than that. It is the same case when users try to move the chart content as right as possible and when users try to zoom in. Things become really annoying when the chart becomes a tight ball of mess when users do a fast zoom in (maybe accidentally), considering the difficulty to make things back to normal. The solution would be NEVER to allow the first and last candlestick to leave the left and right Y axis more than a couple of blank space, respectively.
When zooming out, the most recent candlestick should be fixed close to the Y axis instead of being hidden when it is originally not hidden. This is because the most recent candlestick is the most important data during trading, and most traders would like to keep it in view.
Hi!
When I use e.g.
import {
  CandlestickSeries,
  Chart,
  EdgeIndicator,
  MouseCoordinateX,
  MouseCoordinateY,
  OHLCTooltip,
  XAxis,
  YAxis,
  ZoomButtons,
} from 'react-financial-charts'
Then I get errors for everything except Chart.
If I go to lib/index.js in the node_modules then I see
export { ChartCanvas } from "./ChartCanvas";
export { Chart } from "./Chart";
//# sourceMappingURL=index.js.map
So that makes sense :)
hello everyone I implementing OHLC chart and refer on storybook/tooltip, but I got an error
SyntaxError: Unexpected token 'export'
when import code
import { Chart, ChartCanvas } from 'react-financial-charts';
my code is same as file example
Thanks,
Hello,
when I apply real data and price to this chart. and when I am watching the history of the chart, and the chart gets new data, it jumps to the beginning of the chart.
and chart is not stable.
I want to see the history of the chart and go a bit back, but with real data, when it gets new data, it jumps to the beginning.
When I scroll all the way left/right, the chart continues to scroll indefinitely.
I would prefer the chart to stop at the first/last data point.
I tried setting xExtents={[minX, maxX]}, but I doesn't change anything.
I dont know if could fix the issue of scrolling chart even when no longer have data, cause the blank chart?
Hi all 👋
first of all thanks for this fork and re-write! It looks like one of the most complete financial graphing libs for react and I. definitely would like to get it up and running for my own project.
When I create a stock chart there seems to be a padding or offset by it's own width (see screenshots).

The expected behaviour is that the chart fits into its container, like so:

Here are my deps:
"dependencies": {
    "@testing-library/jest-dom": "^5.11.4",
    "@testing-library/react": "^11.1.0",
    "@testing-library/user-event": "^12.1.10",
    "@types/jest": "^26.0.20",
    "@types/node": "^14.14.22",
    "@types/react": "^17.0.0",
    "@types/react-dom": "^17.0.0",
    "d3-dsv": "^2.0.0",
    "d3-time-format": "^3.0.0",
    "date-fns": "^2.16.1",
    "react": "^17.0.1",
    "react-dom": "^17.0.1",
    "react-financial-charts": "^1.0.1",
    "react-scripts": "4.0.1",
    "styled-components": "^5.2.1",
    "typescript": "^4.1.3",
    "web-vitals": "^0.2.4"
}
I tried it with both a custom graph and by copying the exact files from your first storybook example.
From what I can see it's caused by the container which holds the canvas. If I remove its width style, everything seems to snap into place just fine (see second screenshot).
Maybe it's just something that I did wrong, looking forward to your answer!
I'd like to display "events" on the graph which would be represented as always-opened tooltips containing some text.
For example, given a scatter plot, I'd like the tooltip of each point to be always opened.
I can't seem to find anything close to this behaviour. Is it possible? If not, would it be hard to implement? I may work on this depending on your answers.
Thanks
I used react-stockcharts before, Are these methods in /lib/helper removed?
import { fitDimensions, fitWidth } from 'react-stockcharts/lib/helper';

I'm using logarithmic scale here. Circles move out from line
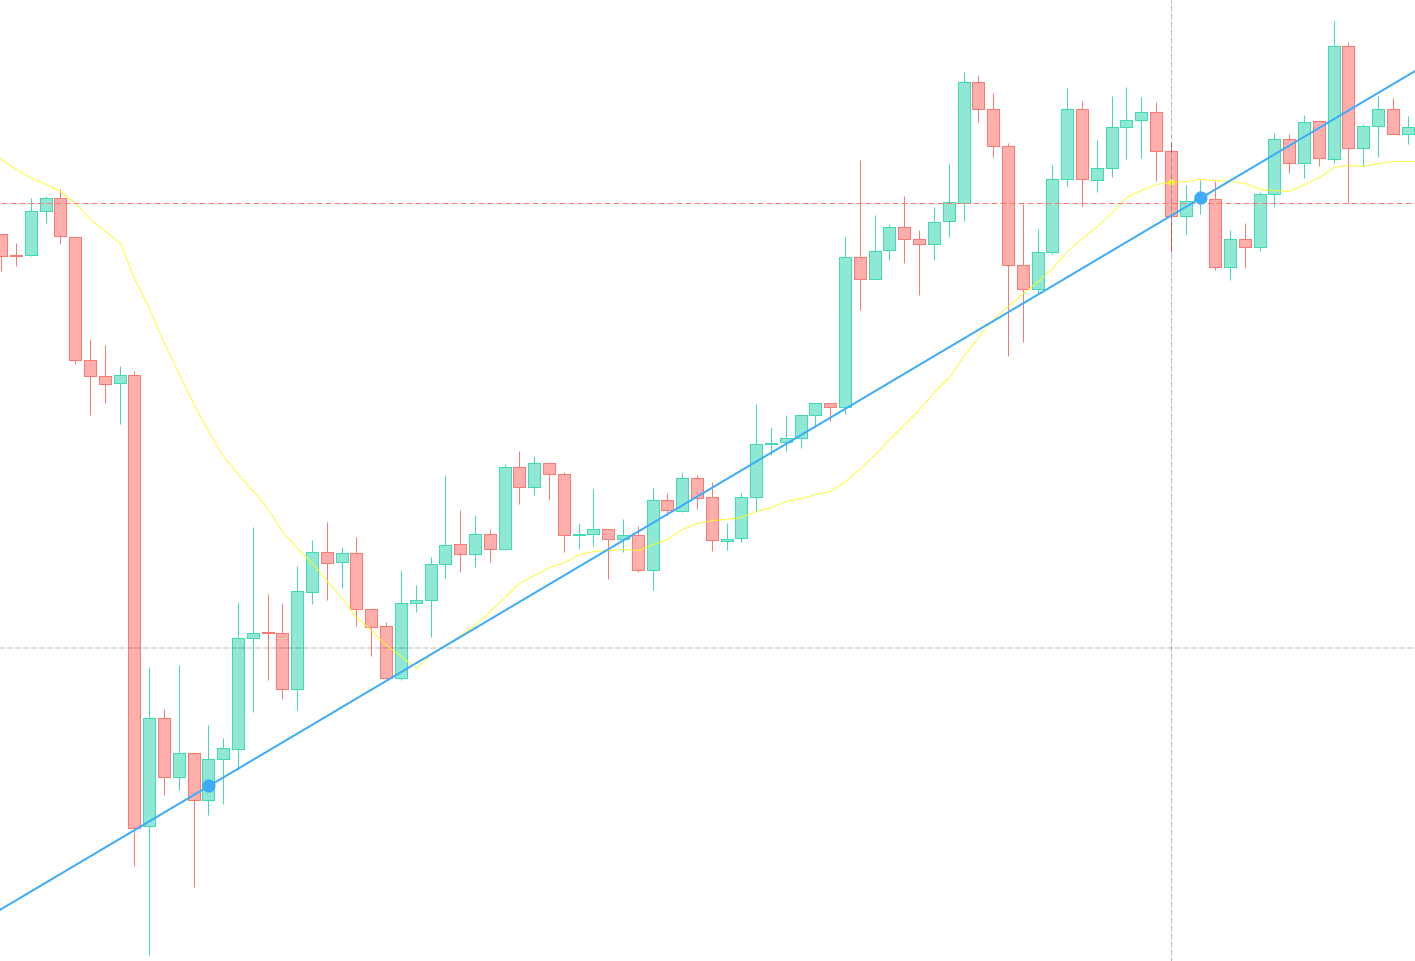
I'm using linear scale here. Circles are on the line
Have you any solution for logarithmic Y scale?
Interactives working wrong with logScale.
I am trying to import classes from this library which works when using the app, but when I am running npm t, the tests fail with:
    /home/xxxxxxxx/git/test/node_modules/react-financial-charts/lib/index.js:1
    ({"Object.<anonymous>":function(module,exports,require,__dirname,__filename,global,jest){export * from "@react-financial-charts/annotations";
                                                                                             ^^^^^^

    SyntaxError: Unexpected token 'export'

      1 | import logo from './logo.svg';
      2 | import './App.css';
    > 3 | import {
        | ^
      4 |   elderRay
      5 | } from "react-financial-charts";
      6 | function App() {

      at Runtime.createScriptFromCode (node_modules/jest-runtime/build/index.js:1350:14)
      at Object.<anonymous> (src/App.js:3:1)

Test Suites: 1 failed, 1 total
It should pass.
I tried different babel and different jest configs (transformIgnorePatterns and such; different things I found when looking for this error), without success.
How to reproduce:
npx create-react-app react-financial-charts-test-failure
cd react-financial-charts-test-failure
npm i --save react-financial-charts

// insert any import to App.js
import {elderRay} from "react-financial-charts";
and then try npm t.
Maybe somebody knows something.
How can I draw horizontal line in this chart?
If I get two points and draw horizontal line, chart gets deformed, in general I would like to draw horizontal line.
Unable to install without --force or --legacy-peer-deps
$ npm i react-financial-charts

npm ERR! code ERESOLVE
npm ERR! ERESOLVE unable to resolve dependency tree
npm ERR!
npm ERR! While resolving: [email protected]
npm ERR! Found: [email protected]
npm ERR! node_modules/react
npm ERR!   react@"^17.0.1" from the root project
npm ERR!
npm ERR! Could not resolve dependency:
npm ERR! peer react@"^16.0.0" from [email protected]Should install without errors.
From the React 17 release blog post:
We’ve only had to change fewer than twenty components out of 100,000+ in the Facebook product code to work with these changes, so we expect that most apps can upgrade to React 17 without too much trouble
I am using the library now, installed with --legacy-peer-deps, without any trouble. However, I'm not familiar enough with the internals of this library to know if anything might break by updating.
hello everyone, I want to ask how to implement this library? should I buy a license to develop using this library? cause I check on https://reactivemarkets.github.io/react-financial-charts/?path=/docs there is no full code, thanks.
You need to set opacity to change the stroke opacity.
You should set stroke opacity to change the stroke opacity.
The current behavior isn't clear without checking the code.
Hi there,
Is there any way to change the color of dates in X,Y axis? Our app uses the dark theme so we want the white color of dates.
It would be great if we can set the text color as a prop.
The opacity defaults to 1.
The opacity should use the alpha channel
It's a pain to have to set both opacity and colour if the colour has an alpha channel.
When touch dragging to the left the chart moves left.
When touch dragging to the right the chart move right.
The reverse:
When touch dragging to the left the chart moves right. e.g. more points in the past are shown
When touch dragging to the right the chart moves left. e.g. more points in the future are shown
Hi Mark,
I've never used Typescript, so am learning how it works, while retrofitting this into a React app. Great work by the way.
It seems like it's mostly there, except I'm getting the following error:

The offending line is:
export default withSize({ style: { minHeight: 600 } })(withDeviceRatio()(StockChart));
I'm 99.9% sure the syntax is correct, and the types are legit too. Any idea what I'm doing wrong?
Panning is not working on Chrome DevTool and mobile.
It's was OK on v1.0.0-alpha.16, so I suspect d3 upgrade is cause of problem.
You have to set axisAt on Axis' and at on Coordinates.
They should default settings and be the same prop.
When I miss a part of the data, the chart acts like the data was 0, so it draws a line from the last point to 0.
I'd like the line to "stop in mid-air" and not go all the way down to 0 before going back up to the next point.
arrowWidth is ignored - arrow never gets rendered.
arrow should be rendered according to arrowWidth.
arrowWidth works properly in react-stockcharts (latest ver, 0.7.8)
The default fill is a bit of a horrible gray.
A nicer default color.
the same problem of the last chart which I saw and in this chart still remained.
https://github.com/rrag/react-stockcharts
is that when the chart gets real data, indicators and drawing tools show wrong and incorrect.
they are not stable and they can not calculate the right when there is real data, works only for stable data.
Zoom out when I update new data
Fix current Zooming
Hi, I want create realtime chart, so I update chart data frequently
When I update new data(ex, 200 data -> 201 data), zoom setting is initialized
I want fix zoom setting that were previously changed by the user
I already try updating example
(https://github.com/reactivemarkets/react-financial-charts/blob/master/packages/stories/src/features/updating/BasicLineSeries.tsx)
(https://github.com/reactivemarkets/react-financial-charts/blob/master/packages/stories/src/data/withUpdatingData.tsx)
but this is not work my project
How can I do that?
Hey, might not be a bug, but a default behaviour that I'm too stupid to get around - there is a limitation to how far out I can scroll that seem to depend on the amount of data visible. Same thing happens in the example:
.
How can I zoom out further? I didn't find any direct method to do so, there also seems not to be any direct feedback to how far I am so I can maybe limit the amount of data that I put into the chart.
Can You please assist?
is possible make tween effect on Pan (dragging) and the same effect when chart zoom?
hi can u show example of use this libary?
Subcharts have fixed heights and can't be resized by user.
Users being able to resize subcharts by dragging the edges.
Hey!
I have been looking through the code/examples - I couldn't find a simple example of a "zoom" feature where you can select a sub-part of the chart by click-and-dragging on the chart?
Is that not a feature? or did I just miss it?
I am new to this place and finding it difficult to follow the documentation. Do you guys have a gitter/ slack/ discord group?
I'm trying to plot a chart using values fetched from an API and I don't wish to store them as a tsv file.
Thanks
~Rushi
is such feature implemented or planned?
Hi, I saw some examples to make chart
https://github.com/reactivemarkets/react-financial-charts/blob/master/packages/stories/src/features/StockChart.tsx
but I can't import most of thigs from "react-financial-charts"
Here is my code:
import React from 'react';
import {
  ema,
  discontinuousTimeScaleProviderBuilder,
} from 'react-financial-charts';

const MainChart = ({ data, height, dateTimeFormat, width, ratio }) => {
  // const xScaleProvider = discontinuousTimeScaleProviderBuilder().inputDateAccessor(
  //   (d) => d.date,
  // );
  const ema26 = ema()
    .id(2)
    .options({ windowSize: 26 })
    .merge((d, c) => {
      d.ema26 = c;
    })
    .accessor((d) => d.ema26);

  console.log(ema26);
  return <div>Test Component!</div>;
};

export default MainChart;
but I can't build like this:

How can I import most of things?
When I try to put a Chart in an external component I get this error:
TypeError: Cannot destructure property 'origin' of 'this.context.chartConfig.find(...)' as it is undefined
Looks like a Chart must be a direct descendant of the ChartCanvas component.
We should be able to organize the code using external components as it could get pretty messy.
Could this be related to the old context api?
A declarative, efficient, and flexible JavaScript library for building user interfaces.
🖖 Vue.js is a progressive, incrementally-adoptable JavaScript framework for building UI on the web.
TypeScript is a superset of JavaScript that compiles to clean JavaScript output.
An Open Source Machine Learning Framework for Everyone
The Web framework for perfectionists with deadlines.
A PHP framework for web artisans
Bring data to life with SVG, Canvas and HTML. 📊📈🎉
JavaScript (JS) is a lightweight interpreted programming language with first-class functions.
Some thing interesting about web. New door for the world.
A server is a program made to process requests and deliver data to clients.
Machine learning is a way of modeling and interpreting data that allows a piece of software to respond intelligently.
Some thing interesting about visualization, use data art
Some thing interesting about game, make everyone happy.
We are working to build community through open source technology. NB: members must have two-factor auth.
Open source projects and samples from Microsoft.
Google ❤️ Open Source for everyone.
Alibaba Open Source for everyone
Data-Driven Documents codes.
China tencent open source team.