| piecewise-regression: | fitting straight line models with breakpoints |
|---|---|
| Author: | Charlie Pilgrim |
| Version: | 1.2.1 |
| Github: | https://github.com/chasmani/piecewise-regression |
| Documentation: | https://piecewise-regression.readthedocs.io/en/master/index.html |
| Paper: | https://joss.theoj.org/papers/10.21105/joss.03859 |

Easy-to-use piecewise regression (aka segmented regression) in Python. For fitting straight lines to data where there are one or more changes in gradient (known as breakpoints). Based on Muggeo's paper "Estimating regression models with unknown break-points" (2003).
When using the package, please cite the accompanying paper.
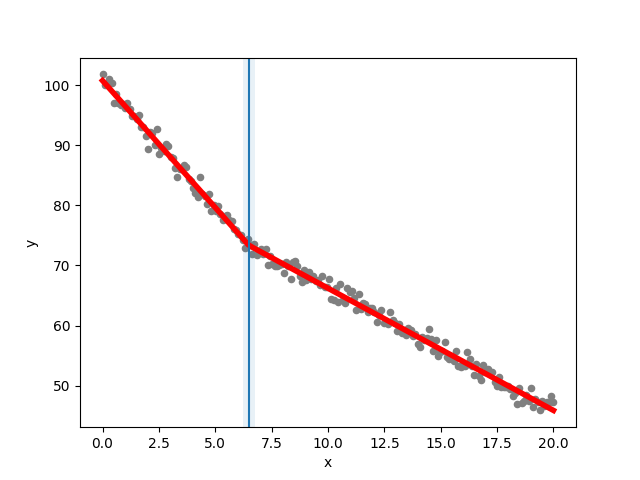
Example:
Code examples below, and more in this Google Colab Jupyter Notebook.
You can install piecewise-regression using python's pip package index
pip install piecewise-regression
The package is tested on Python 3.7, 3.8 and 3.9.
The package requires some x and y data to fit. You need to specify either a) some initial breakpoint guesses as start_values or b) how many breakpoints you want to fit as n_breakpoints (or both). Here is an elementary example, assuming we already have some data x and y:
import piecewise_regression
pw_fit = piecewise_regression.Fit(x, y, n_breakpoints=2)
pw_fit.summary()
For demonstration purposes, substitute with your own data to fit.
Start-off generating some data with a breakpoint:
import piecewise_regression
import numpy as np

alpha_1 = -4
alpha_2 = -2
constant = 100
breakpoint_1 = 7
n_points = 200
np.random.seed(0)
xx = np.linspace(0, 20, n_points)
yy = constant + alpha_1*xx + (alpha_2-alpha_1) * np.maximum(xx - breakpoint_1, 0) + np.random.normal(size=n_points)
Fit the model:
# Given some data, fit the model
pw_fit = piecewise_regression.Fit(xx, yy, start_values=[5], n_breakpoints=1)

# Print a summary of the fit
pw_fit.summary()
Example output:
                    Breakpoint Regression Results
====================================================================================================
No. Observations                      200
No. Model Parameters                    4
Degrees of Freedom                    196
Res. Sum of Squares               193.264
Total Sum of Squares              46201.8
R Squared                        0.995817
Adjusted R Squared               0.995731
Converged:                           True
====================================================================================================
====================================================================================================
                    Estimate      Std Err            t        P>|t|       [0.025       0.975]
----------------------------------------------------------------------------------------------------
const                100.726        0.244       413.63     3.1e-290       100.25       101.21
alpha1              -4.21998       0.0653      -64.605    4.37e-134      -4.3488      -4.0912
beta1                2.18914       0.0689       31.788            -       2.0533        2.325
breakpoint1          6.48706        0.137            -            -       6.2168       6.7573
----------------------------------------------------------------------------------------------------
These alphas(gradients of segments) are estimated from betas(change in gradient)
----------------------------------------------------------------------------------------------------
alpha2              -2.03084       0.0218      -93.068    3.66e-164      -2.0739      -1.9878
====================================================================================================

Davies test for existence of at least 1 breakpoint: p=5.13032e-295 (e.g. p<0.05 means reject null hypothesis of no breakpoints at 5% significance)
This includes estimates for all the model variables, along with confidence intervals. The Davies test is a hypothesis test for the existence of at least one breakpoint, against the null hypothesis of no breakpoints.
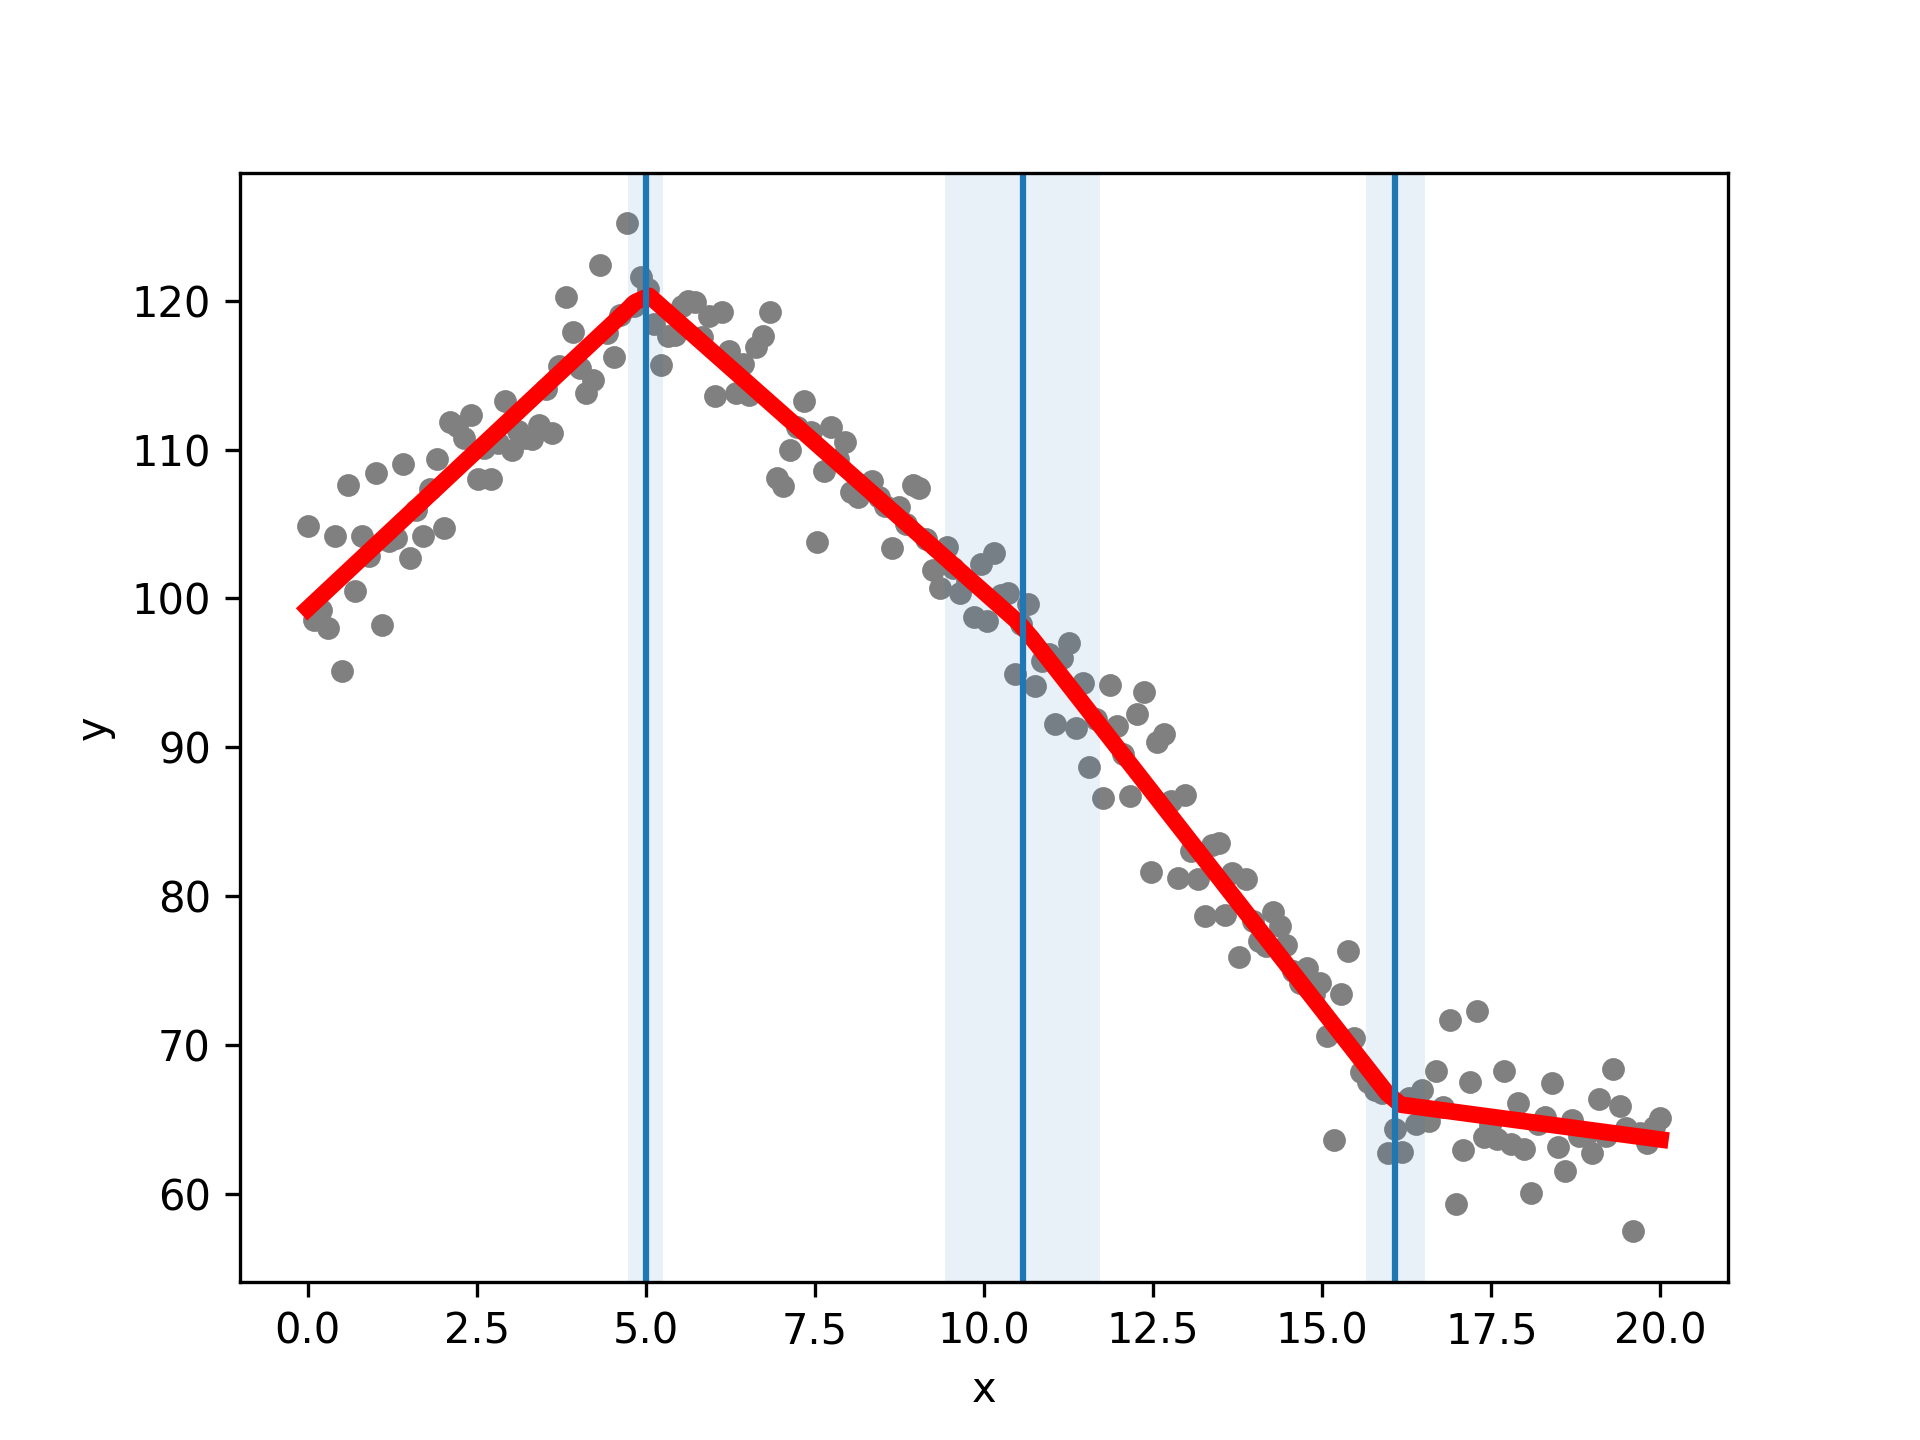
Optional: Plotting the data and model results:
import matplotlib.pyplot as plt

# Plot the data, fit, breakpoints and confidence intervals
pw_fit.plot_data(color="grey", s=20)
# Pass in standard matplotlib keywords to control any of the plots
pw_fit.plot_fit(color="red", linewidth=4)
pw_fit.plot_breakpoints()
pw_fit.plot_breakpoint_confidence_intervals()
plt.xlabel("x")
plt.ylabel("y")
plt.show()
plt.close()
You can extract data as well:
# Get the key results of the fit
pw_results = pw_fit.get_results()
pw_estimates = pw_results["estimates"]
The package implements Muggeo's iterative algorithm (Muggeo "Estimating regression models with unknown break-points" (2003)) to find breakpoints quickly. This method simultaneously fits breakpoint positions and the linear models for the different fit segments, and it gives confidence intervals for all the model estimates. See the accompanying paper for more details.
Muggeo's method doesn't always converge on the best solution - sometimes, it finds a locally optimal solution or doesn't converge at all. For this reason, the Fit method also implements a process called bootstrap restarting which involves taking a bootstrapped resample of the data to try to find a better solution. The number of times this process runs can be controlled with n_boot. To run the Fit without bootstrap restarting, set n_boot=0.
If you do not have (or do not want to use) initial guesses for the number of breakpoints, you can set it to n_breakpoints=3, and the algorithm will randomly generate start_values. With a 50% chance, the bootstrap restarting algorithm will either use the best currently converged breakpoints or randomly generate new start_values, escaping the local optima in two ways in order to find better global optima.
As is often the case with fitting non-linear models, even with these measures, the algorithm is not guaranteed to converge to a global optimum. However, increasing n_boot raises the probability of global convergence at the cost of computation time.
In addition to the main Fit tool, the package also offers a ModelSelection option based on the Bayesian Information Criterion (BIC). This additional tool is experimental and not as thorough as the main Fit function. In particular, the models are generated with random start_values, which can influence the model fit and give different values for the BIC. The tool can help explore other possible models but should not be used to choose the best model at this time.
ms = piecewise_regression.ModelSelection(x, y, max_breakpoints=6)

# The above line should be, replacing x, y with xx, yy (as x, y, returns not defined error
# ms = piecewise_regression.ModelSelection(xx, yy, max_breakpoints=6)
Example output:
                 Breakpoint Model Comparision Results
====================================================================================================
n_breakpoints            BIC    converged          RSS
----------------------------------------------------------------------------------------------------
0                     421.09         True       1557.4
1                     14.342         True       193.26
2                     22.825         True       191.23
3                     24.169         True       182.59
4                     29.374         True       177.73
5                                   False
6                                   False

Minimum BIC (Bayesian Information Criterion) suggests the best model
The data of the model fits can be accessed in
ms.models
For a robust comparision, you could run the ModelSelection tools many times and take the lowest BIC for each model.
The package includes comprehensive tests.
To run all tests, from the main directory run (requires the pytest library):
pytest
To get code coverage, run (requires pytest and pytest-cov libraries):
pytest --cov=./
There are also a series of simulation tests that check the estimates have realistic confidence intervals, and the Davies test gives realistic p-values. These can be found in the folder "tests-manual".
See requirements.txt for specific version numbers. Required packages, and their uses are:
- matplotlib for plotting.
- numpy for simple data handling and data transformations.
- scipy for statistical tests including using t-distributions and Gaussians.
- statsmodels for performing ordinary least squares.
We welcome community participation!
Sourced from Open Source Guide: How to contribute.
Open an issue in the following situations:
- Report an error you can’t solve yourself
- Discuss a high-level topic or idea (for example, community, vision or policies)
- Propose a new feature or other project ideas
Tips for communicating on issues:
- If you see an open issue that you want to tackle, comment on the issue to let people know you’re on it. That way, people are less likely to duplicate your work.
- If an issue was opened a while ago, it’s possible that it’s being addressed somewhere else, or has already been resolved, so comment to ask for confirmation before starting work.
- If you opened an issue, but figured out the answer later on your own, comment on the issue to let people know, then close the issue. Even documenting that outcome is a contribution to the project.
Open a pull request in the following situations:
- Submit trivial fixes (for example, a typo, a broken link or an obvious error)
- Start work on a contribution that was already asked for, or that you’ve already discussed, in an issue
Tips for submitting PRs:
- Reference any relevant issues or supporting documentation in your PR (for example, “Closes #37.”)
- Include screenshots of the before and after if your changes include differences in HTML/CSS. Drag and drop the images into the body of your pull request.
- Test your changes by running them against any existing tests if they exist and create new ones when needed. Whether tests exist or not, make sure your changes don’t break the existing project.
- Contribute in the style of the project to the best of your abilities.
To install from source:
git clone https://github.com/chasmani/piecewise-regression
cd piecewise_regression
python3 setup.py install --user


