rapidsai / cuxfilter Goto Github PK
View Code? Open in Web Editor NEWGPU accelerated cross filtering with cuDF.
Home Page: https://docs.rapids.ai/api/cuxfilter/stable/
License: Apache License 2.0
GPU accelerated cross filtering with cuDF.
Home Page: https://docs.rapids.ai/api/cuxfilter/stable/
License: Apache License 2.0
Is your feature request related to a problem? Please describe.
Currently only mean and count work.
Describe the solution you'd like
Add support for sum, max, min
Adding support that allows for multiple users to concurrently interact with the dashboard
Dear developers,
I encounter problems rendering on the GPU engine running the GTC demo example.
The hard/software components are the following: DGX-1 with V100-32GB on OS 4.0.5 (Ubuntu 18.04.2 LTS). The V100 run driver version 410.104. The CUDA-Version is 10.0. The system was idle during my tests, so there should not be any memory issues.
While the test-file seems to get loaded correctly (it displays the number of aggregated mortgages), when trying to render with the GPU engine, I cannot get any visualization out of the webinterface, even though I already waited for more than an hour in the screenshot-state to get some:

If I switch to the CPU engine everything works fine within about 60 seconds:

I built and ran the docker-container for cuxfilter with a few configuration and the loaded dataset. I am actually doing this with
docker build -t lmichel-viz .
docker run --runtime=nvidia -e NVIDIA_VISIBLE_DEVICES=0,1 -p 80:80 --env-file ./config.env -v /local/disk/data:/usr/src/app/node_server/uploads --rm -d lmichel-viz
The config.env-File still has the contents of the original one (https://github.com/rapidsai/cuxfilter/blob/master/config.env). I only changed the server-ip to localhost and added my mapbox-token, which should not make any difference for my problem.
Do you have any idea how to solve this problem? If you need any additional information, please let me know.
Thanks,
Linus
When issuing docker build command(step 2 in installation), I get following error.
any ideas?
Solving environment: ...working... failed
PackagesNotFoundError: The following packages are not available from current channels:
Current channels:
To search for alternate channels that may provide the conda package you're
looking for, navigate to
https://anaconda.org
and use the search bar at the top of the page.
Location of incorrect documentation
In our datashader charts section, each section is missing the title parameter in the example code string. it is there in the parameters section
https://docs.rapids.ai/api/cuxfilter/stable/charts/datashader_charts.html#
This can make some users miss the feature or think that it doesn't exist
My company only allows port 80 and 443 oubound.
anyway to make this demo work on port 80?
I've tried to change config.jason "demos_serve_port_external": 80"
and also mapping -p 80:3005 neither works.
any other internal code I have to change to port 80?
Thanks
Report needed documentation
It would be nice to have a gallery of plots in the docs with each one linking to a simple example. This is great for users who want to do a visual search of the features available in the library when trying to find a good starting point. It's also great for users who want to try something quickly and see how far they get. This is a great way to pull in drive-by users. Some examples of this in other plotting libraries are...
Describe the documentation you'd like
Having a gallery of different plot styles with linked example code.
Steps taken to search for needed documentation
Skimmed through all of the docs looking for this. Also searched "gallery".
Is your feature request related to a problem? Please describe.
Problem running the client-server architecture for running dashboards, when using cuxfilter within a container
Describe the solution you'd like
A better server implementation(may be use reverse proxy on top of it), to eliminate port mess.
Open to discussion, @exactlyallan
cuDatashader repo to remain but be for experimental and SOL projects. Datashader to be the default to simplify import and install.
Describe the bug
I am getting no module named cuxfilter when I run import cuxfilter within rapids docker container (0.13 release). Same error for the import datashader. Note that cuXfilter works fine in the rapids docker 0.12 release.
I am using docker + examples (non dev environment )
.
Steps/Code to reproduce bug
Expected behavior
import cuxfilter and import datashader should work without generating any error.
Environment details (please complete the following information):
docker pull & docker run commands useddocker pull rapidsai/rapidsai-nightly:cuda10.1-runtime-ubuntu16.04
Currently, datashader has the ability to
They use holoviews for that. https://datashader.org/getting_started/Interactivity.html. Hoping that we can do that for some of our smaller datasets, as it would be incredibly useful. I understand the latency would be far greater if we added metadata for millions of dots, but i'm taking thousands, like clustered points
Its just idea to work with and/or suggestion...
The graph visualization is emerging as well quite quickly although the storage layer is still the bottleneck (not much scallable graph database exists and those which does sharding accross nodes are not well proven yet - one for all is dgraph), but still visualization of graph data is something Rapids shouldn't leave behind (as soon as you work with Gunrock and support cuGraph API).
So here is one cool candidate on graph visualizations based on WebGL tech:
https://github.com/vasturiano/3d-force-graph
Maybe something to integrate with cuGraph via cuxfilter architecture.
I wish i could add custom text to the side bar. This would be useful for explaining the chart and usage, making a "poor man's legend" or associating information that would be hard through given means or current capabilities.
Describe the bug
When running the example "auto accidents" demo code from the readme, when i try to display the webapp page, i get this error:
---------------------------------------------------------------------------
BrowserError                              Traceback (most recent call last)
<ipython-input-1-3da17c61f810> in async-def-wrapper()
     26
     27 #run the dashboard as a webapp:
---> 28 d.show('jupyter-notebook/lab-url')

/opt/conda/envs/rapids/lib/python3.7/site-packages/cuxfilter/dashboard.py in preview(self)
    397             port=port, websocket_origin=url, show=False, start=True
    398         )
--> 399         await screengrab("http://" + url)
    400         temp_server.stop()
    401         from IPython.core.display import Image, display

/opt/conda/envs/rapids/lib/python3.7/site-packages/cuxfilter/assets/screengrab.py in screengrab(url)
      3
      4 async def screengrab(url):
----> 5     browser = await launch({"slowMo": 5})
      6     page = await browser.newPage()
      7     await page.setViewport(

/opt/conda/envs/rapids/lib/python3.7/site-packages/pyppeteer/launcher.py in launch(options, **kwargs)
    309         option with extreme caution.
    310     """
--> 311     return await Launcher(options, **kwargs).launch()
    312
    313

/opt/conda/envs/rapids/lib/python3.7/site-packages/pyppeteer/launcher.py in launch(self)
    187
    188         connectionDelay = self.options.get('slowMo', 0)
--> 189         self.browserWSEndpoint = self._get_ws_endpoint()
    190         logger.info(f'Browser listening on: {self.browserWSEndpoint}')
    191         self.connection = Connection(

/opt/conda/envs/rapids/lib/python3.7/site-packages/pyppeteer/launcher.py in _get_ws_endpoint(self)
    231             raise BrowserError(
    232                 'Browser closed unexpectedly:\n{}'.format(
--> 233                     self.proc.stdout.read().decode()
    234                 )
    235             )

BrowserError: Browser closed unexpectedly:
[0103/233226.837818:ERROR:zygote_host_impl_linux.cc(89)] Running as root without --no-sandbox is not supported. See https://crbug.com/638180.
Steps/Code to reproduce bug
in a fresh docker pull of 0.12 nightlies, and run this setup:
#install cuXfilter
conda install -c rapidsai-nightly cuxfilter=0.12 cudatoolkit=10.1

#get rid of the libxcomposite.so.1 error
apt-get update
apt-get install libxcomposite1 libxcursor1 libxdamage1 libxfixes3 libxi6 libxrandr2 libxtst6 libcups2 libxss1 libasound2 libpangocairo-1.0-0 libpango-1.0-0 libatk1.0-0 libgtk-3-0 libgdk-pixbuf2.0-0
Then run the code from the README
import cuxfilter

#update data_dir if you have downloaded datasets elsewhere
DATA_DIR = './data'
from cuxfilter.sampledata import datasets_check
datasets_check('auto_accidents', base_dir=DATA_DIR)

cux_df = cuxfilter.DataFrame.from_arrow('./data/auto_accidents.arrow')
cux_df.data['ST_CASE'] = cux_df.data['ST_CASE'].astype('float64')

label_map = {1: 'Sunday',    2: 'Monday',    3: 'Tuesday',    4: 'Wednesday',   5: 'Thursday',    6: 'Friday',    7: 'Saturday',    9: 'Unknown'}
gtc_demo_red_blue_palette = [ (49,130,189), (107,174,214), (123, 142, 216), (226,103,152), (255,0,104) , (50,50,50) ]

#declare charts
chart1 = cuxfilter.charts.datashader.scatter_geo(x='dropoff_x', y='dropoff_y', aggregate_col='ST_CASE',
                                         color_palette=gtc_demo_red_blue_palette)
chart2 = cuxfilter.charts.panel_widgets.multi_select('YEAR')
chart3 = cuxfilter.charts.bokeh.bar('DAY_WEEK', x_label_map=label_map)
chart4 = cuxfilter.charts.bokeh.bar('MONTH')

#declare dashboard
d = cux_df.dashboard([chart1, chart2, chart3, chart4], layout=cuxfilter.layouts.feature_and_double_base,theme = cuxfilter.themes.light, title='Auto Accident Dataset')

#preview the dashboard inside the notebook(non-interactive) with layout
await d.preview()

#run the dashboard as a webapp:
d.show('jupyter-notebook/lab-url')
and go to the proxy port
Expected behavior
I see the pretty pictures (just for you, @exactlyallan :) )
Environment details (please complete the following information):
docker pull & docker run commands useddocker pull rapidsai/rapidsai-nightly:cuda10.1-runtime-ubuntu16.04-py3.7
docker run --gpus all --rm -it -p 8888:8888 -p 8787:8787 -p 8786:8786
rapidsai/rapidsai-nightly:cuda10.1-runtime-ubuntu16.04-py3.7
When you create a dashboard in a remote system, jupyter returns a string of text that contains a link
d.show(10.***.***.***:8888)
Dashboard running at http://10.***.***.***:8888/proxy/51975/
the http is shown as a clickable link in some versions of jupyter lab. That is cool and useful...but...
The issue is that that link terminates before the final /, so it ends with proxy/51975 instead of proxy/51975/. Without the final / , the chart never loads and upon inspection, shows bokeh errors. With the /, it loads just fine. However, as it is a link, which you click, and there is no message to cut and paste the complete http string, including the /, the experience is broken.
Can we add a message, a button, or correct the link forming to provide the user the intended experience?
Add support to pass a parameter (autoscale=True/False) that allows for the axis range to be automatically calculated from the data and adjust the visuals accordingly
What is your question?
It looks like pyproj both in environments (like this one) and the recipe itself. Am curious what is motivating this tight pinning. Are there changes in later versions of pyproj that break this? If so, what are they?
I wish that cuXFilter could bring in Boolean data types direct from the dataframe.
Right now, i have to do df['bool'] = df['bool']*1 or df['bool'] = df['bool'].astype('int8') to convert the column to int, which cuXFilter can read. When I chart this, instead of having True and False as the Labels, i get 1 and 0, which is sub-optimal
When data size increases, single GPU memory can get filled up quickly. Also multiple charts in the
layout can create many groupby operations, requiring 2-3X additional memory than the data size.
Having dask_cudf support can address this issue, as it would help to distribute workflow across multiple GPUs.
Describe the bug
Widgets including datasize indicator are not displayed in the widget bar on the left side of the dashboard.
Large number "chart" type that displays truncated number like "12k" in bold font.
Describe the bug
I am following the instructions to build cuXfilter from source. I get the following error when I update conda env using cuxfilter_dev_cuda10.1.yml:
ERROR:
Collecting package metadata (repodata.json): done
Solving environment: failed

ResolvePackageNotFound:
  - cudf[version='>=0.13']
Steps/Code to reproduce bug
CUXFILTER_HOME=$(pwd)/cuxfilter
git clone https://github.com/rapidsai/cuxfilter.git $CUXFILTER_HOME
cd $CUXFILTER_HOME
2. conda create --name cuxfilter_dev
3. conda activate cuxfilter_dev
conda install -c rapidsai-nightly -c nvidia -c conda-forge \
    -c defaults cudf=0.13 python=3.7 cudatoolkit=10.1
conda env update --file conda/environments/cuxfilter_dev_cuda10.1.yml
That step generates the error above.
Expected behavior
rapidsai-nightly is missing in the channel list in cuxfilter_dev_cuda10.1.yml, and name does not match with the env name- cuxfilter_dev. But even though I perform these updates, I still get the same error.
We should install cuXfilter from source without any issue.
Environment details (please complete the following information):
docker pull & docker run commands usedAdditional context
Add any other context about the problem here.
I experimented with cuDF, but at moment working on new streaming platform and would like to introduce GPU accelerated real time analytics as front db, I will hint a streaming platform design in general just as sequence of steps:
data source -> topic(with s3 auto sink) -> data standartization (spark with griffin) -> topic (with s3 auto sink) -> schema standartization (spark) -> clean data topic (with s3 sink), these are highly atomic data more normalized.
Now this clean data topis(s) i would like to use Spark to materialize in set of different cuDFs for application analytics (turn into more denormalized sets for fast access). Spark will be reasonsble to stream data in and keep cuDFs enough large so they can fit into GPU ram.
These cuDFs will be registerd (or that is idea in our data catalog solution), so eventually user will be able to pick them from dashboard and start using them.
Q1: Can be cuDF shared accross processes? So Spark/Dask will update data in cuDF and cuxfilter will access it to query only(read access)?
Q2: Do you plan to reach with cuxfilter something like OmniSci is having with their Immerse Visual Analytics system? So you can have multiple data sets (cuDFs) and you can use them in dashboards and dynamically by drag and drop style work with them?
https://www.omnisci.com/demos/ships/
I know this topic requires wider discussion, just more asking if reaching such point is your vision or not.
Anyway thank you for your hard and cool interesting work on this.
Ladislav
I am taking cuxfilter as an example of machine learning Apps and wish to modify the codes to localCUDACluster. The only example which uses Sanic and Dask is
from sanic import Sanic
from sanic import response

from tornado.platform.asyncio import BaseAsyncIOLoop, to_asyncio_future
from distributed import LocalCluster, Client


app = Sanic(__name__)


def square(x):
    return x**2


@app.listener('after_server_start')
async def setup(app, loop):
    # configure tornado use asyncio's loop
    ioloop = BaseAsyncIOLoop(loop)

    # init distributed client
    app.client = Client('tcp://localhost:8786', loop=ioloop, start=False)
    await to_asyncio_future(app.client._start())


@app.listener('before_server_stop')
async def stop(app, loop):
    await to_asyncio_future(app.client._shutdown())


@app.route('/<value:int>')
async def test(request, value):
    future = app.client.submit(square, value)
    result = await to_asyncio_future(future._result())
    return response.text(f'The square of {value} is {result}')


if __name__ == '__main__':
    # Distributed cluster should run somewhere else
    with LocalCluster(scheduler_port=8786, nanny=False, n_workers=2,
                      threads_per_worker=1) as cluster:
        app.run(host="0.0.0.0", port=8000)
from Sanic wiki.
Sadly, it does not wok if we just use LocalCUDACluster instead of LocalCluster with proper imports. Even the orginal codes does not work anymore. Hardly find any example on LocalCUDACluster and python web frameworks. So is there a plan to upgrade cuxfilter to distributed version? It would be the only example on github. Thank you very much.
Describe the bug
Docs directory is 190MB, contains large binary data, clones are taking a long time.
Steps/Code to reproduce bug
git clone ...
Expected behavior
Expect quick clones, large binary data in git LFS.
Environment details (please complete the following information):
N/A
Additional context
Is git the right place to have those files at all?
Is your feature request related to a problem? Please describe.
Add support for pydeck charts in the dashboards
Additional context
https://github.com/uber/deck.gl/tree/master/bindings/python/pydeck
I wish I could use cuxfilter for visualization in google colab, a bash file will be very helpful.
Feature Requests related to Dashboards grouped together. Will be updated as implemented.
Is your feature request related to a problem? Please describe.
Add support for altair charts while creating dashboards
Additional context
https://altair-viz.github.io/
I followed all instructions, I downloaded data set and map to the docker container, following ls from container:
root@a909fae45a85:/usr/src/app# ls -la /usr/src/app/node_server/uploads
total 3578988
drwxrwxr-x 2 1000 1000       4096 Dec 27 07:19 .
drwxrwxr-x 1 root root       4096 Dec 27 07:23 ..
-rw-rw-r-- 1 1000 1000 3664867524 Nov 29 17:22 146M_predictions_v2.arrow
So data are there, but when I open http://localhost:43004/demos/examples/demo1.html (note I SSH forward 3004 port from server to laptop), I got this page:
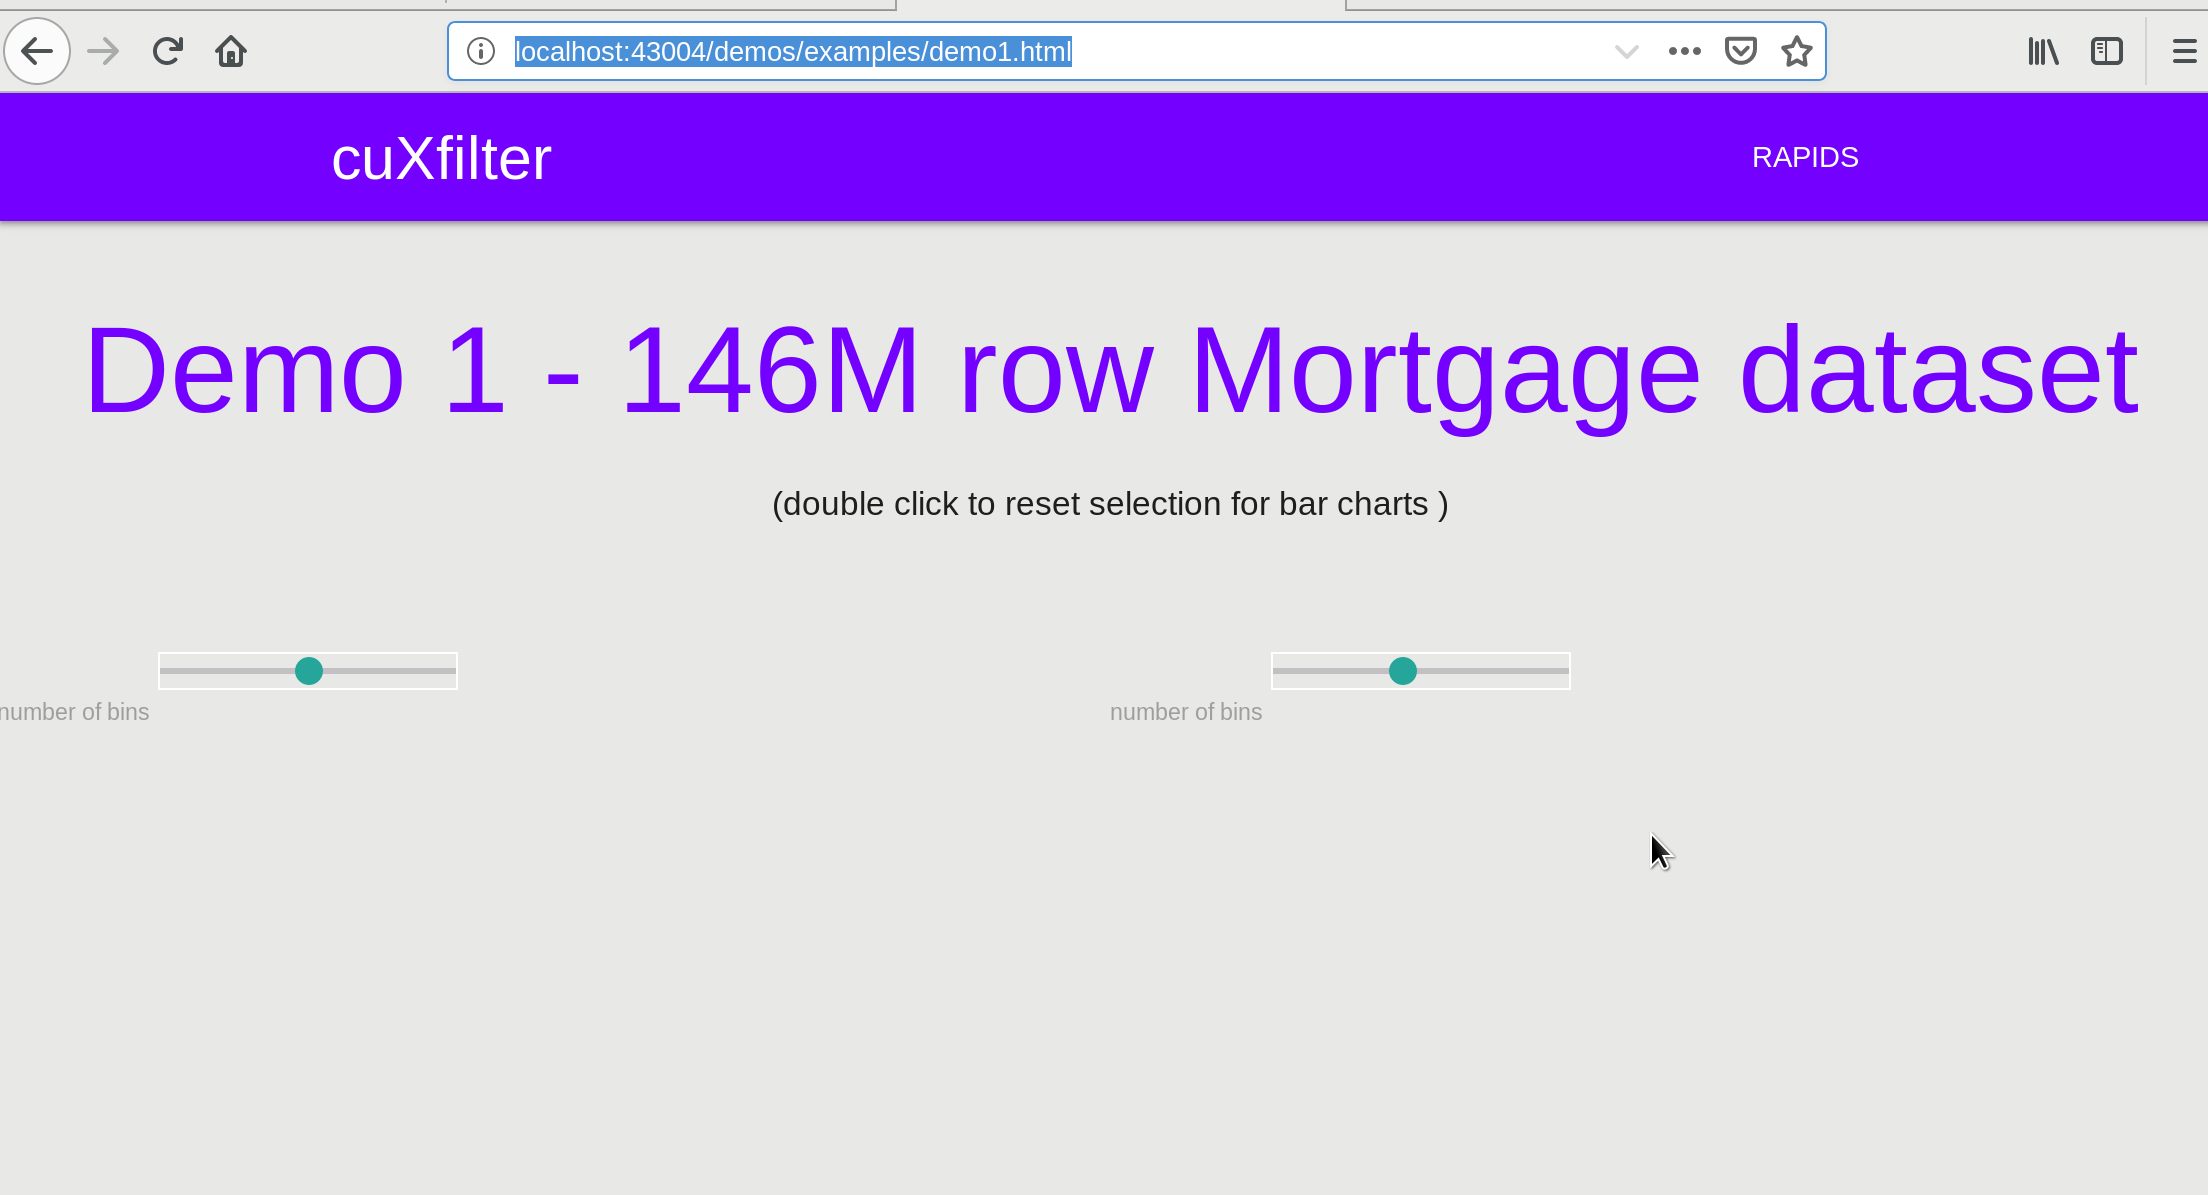
I think its just something related to data upload, or maybe mistake on my side... maybe it will be good to add some kind of logging.
Was really enjoying cuxfilter, but add_chart doesn't function as its name implies and it's frustrating.
To add a chart, you have to create a new chart and then run it, which gives you a new link to view it on - not update your old chart. The docs does not make its functionality - or usefulness - clear, as you could have done that the standard way of creating a new dashboard, without add_chart, and it would have made more sense
can we:
add_chart in the docsadd_chart, as its usefulness is suspectadd_chart update dashboard dynamically without needing to create a new dashboard.Describe the bug
When trying to use deckgl.charopleth3d , it seems that the name of the column in the dataframe somehow influences if the data gets rendered at all. As far as I can tell from experimentation, column names that are uppercase work for some reason.
Steps/Code to reproduce bug
import cudf
import numpy as np
import cuxfilter

geoJSONSource ='https://raw.githubusercontent.com/rapidsai/cuxfilter/GTC-2018-mortgage-visualization/javascript/demos/GTC%20demo/src/data/zip3-ms-rhs-lessprops.json'

size = 1000

color=np.random.randint(50,100, size=size)
zip_fake = np.random.randint(1,50, size = size)
y = np.random.randint(5000,70000, size=size)
df = cudf.DataFrame( {'Zip': zip_fake,
                      'color':color,
                    'elevation': y})
cux_df = cuxfilter.DataFrame.from_dataframe(df)

cux_df.data['Zip'].astype('float64')
cux_df.data['elevation'].astype('float64')
cux_df.data['color'].astype('float64')

chart0 = cuxfilter.charts.deckgl.choropleth3d( x='Zip', color_column='color', color_aggregate_fn='mean', elevation_column='elevation', elevation_factor=1, elevation_aggregate_fn='sum',  geoJSONSource=geoJSONSource, data_points=size
)

#declare dashboard
d = cux_df.dashboard([chart0],theme = cuxfilter.themes.light, title='test dashboard')

d.app(notebook_url='')
Expected behavior
Chart should be rendered for any column name given the same data.
Environment details (please complete the following information):
docker pull rapidsai/rapidsai:cuda10.1-runtime-ubuntu18.04
docker run --runtime=nvidia -it -v ~/workdir:/mnt -p 8888:8888 rapidsai/rapidsai:cuda10.1-runtime-ubuntu18.04
Additional context
Add any other context about the problem here.
Is your feature request related to a problem? Please describe.
When we have multiple line charts with a common x-axis(time series charts), a feature like stacked lines as part of a single chart, or tabs at the top to select a specific line chart would be helpful.
Describe the solution you'd like
An easy way to group multiple line charts and display in a single block of space in the dashboard, either stacked or as multiple tabs at the top
Describe alternatives you've considered
Right now the only option is to display all line charts one below the other
Is your feature request related to a problem? Please describe.
The whole web community would profit from a decoupling of some features features of cuxfilter. Instead of adapating major visualization pacakges to cuxfilter, we could expose the features as API and let the JS community create novel solution.
Describe the solution you'd like
Expose some API for React/JS users to leverage on cuxfilter. The first use case would be for electron/local apps as the size of the data set could impose some problems.
Describe alternatives you've considered
Use cudf directly and expose them through a flask API.
Additional context
Although Jupyter notebook is the main target of cuxfilter, I think the package would have incredible success if the whole JS community could leverage on it.
Is your feature request related to a problem? Please describe.
Currently the debouncing effect while scrolling in cudatashader plots is implemented on the server side, where the timeout variable is used in cudatashader/custom_extensions file, to ignore the callback function execution for rendering for that amount of time.
Describe the solution you'd like
front-end scrolling debouncing and update data on panning only when click is released. Transition should have the effect similar to this -> https://bokeh.pydata.org/en/latest/docs/user_guide/webgl.html where gray subsampled data while larger data plot is being rendered.
Is your feature request related to a problem? Please describe.
Add support for plotly charts as one of the options while creating dashboards
Additional context
https://plot.ly/python/getting-started/
Is your feature request related to a problem? Please describe.
I wish cuXfilter would let me label the values of Datashader plots with a different mapping, as it can with the Bokeh plots.
Example, if i have to use numeric 1 and 0, I'd like to be able to relabel them as True and False, Yes and No or Positive and Negative on the plot.
The only alternate is explicitly telling the reader to make the mapping in their mind in the notebook or as part of the title and show 1 and 0.
I am trying to setup a docker image but get the below errors. I appreciate if anyone can have suggestions.
> [email protected] install /usr/src/app/demos/GTC demo/node_modules/gl
> prebuild-install || node-gyp rebuild

prebuild-install WARN install Request timed out
make: Entering directory '/usr/src/app/demos/GTC demo/node_modules/gl/build'
  CXX(target) Release/obj.target/angle_common/angle/src/common/Float16ToFloat32.o
make: 5: Command not found
angle/src/angle_common.target.mk:147: recipe for target 'Release/obj.target/angle_common/angle/src/common/Float16ToFloat32.o' failed
make: Leaving directory '/usr/src/app/demos/GTC demo/node_modules/gl/build'
make: *** [Release/obj.target/angle_common/angle/src/common/Float16ToFloat32.o] Error 127
gyp ERR! build error
gyp ERR! stack Error: `make` failed with exit code: 2
gyp ERR! stack     at ChildProcess.onExit (/usr/lib/node_modules/npm/node_modules/node-gyp/lib/build.js:196:23)
gyp ERR! stack     at emitTwo (events.js:126:13)
gyp ERR! stack     at ChildProcess.emit (events.js:214:7)
gyp ERR! stack     at Process.ChildProcess._handle.onexit (internal/child_process.js:198:12)
gyp ERR! System Linux 3.10.0-957.12.2.el7.x86_64
gyp ERR! command "/usr/bin/node" "/usr/lib/node_modules/npm/node_modules/node-gyp/bin/node-gyp.js" "rebuild"
gyp ERR! cwd /usr/src/app/demos/GTC demo/node_modules/gl
gyp ERR! node -v v8.16.1
gyp ERR! node-gyp -v v5.0.3
gyp ERR! not ok
npm WARN [email protected] No repository field.
npm WARN optional SKIPPING OPTIONAL DEPENDENCY: [email protected] (node_modules/fsevents):
npm WARN notsup SKIPPING OPTIONAL DEPENDENCY: Unsupported platform for [email protected]: wanted {"os":"darwin","arch":"any"} (current: {"os":"linux","arch":"x64"})

npm ERR! code ELIFECYCLE
npm ERR! errno 1
npm ERR! [email protected] install: `prebuild-install || node-gyp rebuild`
npm ERR! Exit status 1
npm ERR!
npm ERR! Failed at the [email protected] install script.
npm ERR! This is probably not a problem with npm. There is likely additional logging output above.

npm ERR! A complete log of this run can be found in:
npm ERR!     /root/.npm/_logs/2019-08-23T04_24_38_777Z-debug.log
The command '/bin/bash -c npm install && npm run build' returned a non-zero code: 1
Describe the bug
When attempting to use a multi_select widget on a dashboard with a 2D cuxfilter choropleth chart, the chart fails to update and throws an error indicating it was expecting an elevation aggregation function.
Steps/Code to reproduce bug
After adding a multi_select widget to the code from the cuxfilter choropleth docs:
import cudf
import cuxfilter

geoJSONSource='https://raw.githubusercontent.com/rapidsai/cuxfilter/GTC-2018-mortgage-visualization/javascript/demos/GTC%20demo/src/data/zip3-ms-rhs-lessprops.json'
size = 999

cux_df = cuxfilter.DataFrame.from_dataframe(
    cudf.DataFrame({
                    'color':np.random.randint(20,30, size=size*10)/100,
                    'zip': list(np.arange(1,size+1))*10,
                    'group': np.random.randint(10, size=size*10)
    })
)

chart0 = cuxfilter.charts.choropleth( x='zip', color_column='color', color_aggregate_fn='mean',
        geoJSONSource=geoJSONSource, data_points=size, add_interaction=True
)

group_select = cuxfilter.charts.multi_select('group')

d = cux_df.dashboard([chart0, group_select],theme = cuxfilter.themes.dark, title='Mortgage Dashboard')
d.show(notebook_url='localhost:8888')
the widget does not work on the dashboard, with error traceback:
tornado.application - ERROR - Exception in callback functools.partial(<bound method IOLoop._discard_future_result of <tornado.platform.asyncio.AsyncIOMainLoop object at 0x7fcede0bdfd0>>, <Future finished exception=AttributeError("'Choropleth' object has no attribute 'elevation_aggregate_fn'",)>)
Traceback (most recent call last):
  File "/opt/conda/envs/rapids/lib/python3.6/site-packages/tornado/ioloop.py", line 743, in _run_callback
    ret = callback()
  File "/opt/conda/envs/rapids/lib/python3.6/site-packages/tornado/ioloop.py", line 767, in _discard_future_result
    future.result()
  File "/opt/conda/envs/rapids/lib/python3.6/site-packages/tornado/gen.py", line 748, in run
    yielded = self.gen.send(value)
  File "/opt/conda/envs/rapids/lib/python3.6/site-packages/bokeh/server/session.py", line 70, in _needs_document_lock_wrapper
    result = yield yield_for_all_futures(func(self, *args, **kwargs))
  File "/opt/conda/envs/rapids/lib/python3.6/site-packages/bokeh/server/session.py", line 191, in with_document_locked
    return func(*args, **kwargs)
  File "/opt/conda/envs/rapids/lib/python3.6/site-packages/bokeh/document/document.py", line 1127, in wrapper
    return doc._with_self_as_curdoc(invoke)
  File "/opt/conda/envs/rapids/lib/python3.6/site-packages/bokeh/document/document.py", line 1113, in _with_self_as_curdoc
    return f()
  File "/opt/conda/envs/rapids/lib/python3.6/site-packages/bokeh/document/document.py", line 1126, in invoke
    return f(*args, **kwargs)
  File "/opt/conda/envs/rapids/lib/python3.6/site-packages/bokeh/document/document.py", line 916, in remove_then_invoke
    return callback(*args, **kwargs)
  File "/opt/conda/envs/rapids/lib/python3.6/site-packages/panel/viewable.py", line 678, in _change_event
    self.set_param(**self._process_property_change(events))
  File "/opt/conda/envs/rapids/lib/python3.6/site-packages/param/parameterized.py", line 1219, in inner
    return fn(*args, **kwargs)
  File "/opt/conda/envs/rapids/lib/python3.6/site-packages/param/parameterized.py", line 2573, in set_param
    return self_or_cls.param.set_param(*args,**kwargs)
  File "/opt/conda/envs/rapids/lib/python3.6/site-packages/param/parameterized.py", line 1365, in set_param
    self_._batch_call_watchers()
  File "/opt/conda/envs/rapids/lib/python3.6/site-packages/param/parameterized.py", line 1480, in _batch_call_watchers
    watcher.fn(*events)
  File "/opt/conda/envs/rapids/lib/python3.6/site-packages/cuxfilter/charts/panel_widgets/plots.py", line 470, in widget_callback
    dashboard_cls._query_datatiles_by_indices(event.old, event.new)
  File "/opt/conda/envs/rapids/lib/python3.6/site-packages/cuxfilter/dashboard.py", line 630, in _query_datatiles_by_indices
    self._data_tiles[chart.name],
  File "/opt/conda/envs/rapids/lib/python3.6/site-packages/cuxfilter/charts/core/aggregate/core_aggregate_choropleth.py", line 507, in query_chart_by_indices
    temp_agg_function = self.elevation_aggregate_fn
AttributeError: 'Choropleth' object has no attribute 'elevation_aggregate_fn'
Environment details (please complete the following information):
docker pull & docker run commands useddocker pull rapidsai/rapidsai:cuda10.1-runtime-ubuntu18.04docker run --name rapids --gpus all --rm -it -p 8888:8888 -p 8787:8787 -p 8786:8786 rapidsai/rapidsai:cuda10.1-runtime-ubuntu18.04Additional context
N/A
Describe the bug
Widgets not displayed in the new layout-based dashboards for all layouts
Steps/Code to reproduce bug
from cuXfilter import charts
import cuXfilter
from bokeh import palettes
from cuXfilter.layouts import layout_1

layout_1.num_chart_per_row = 1

cux_df = cuXfilter.DataFrame.from_arrow('/home/ajay/data/146M_predictions_v2.arrow')

chart0 = charts.bokeh.choropleth(x='zip', y='delinquency_12_prediction', aggregate_fn='mean',
                                  geo_color_palette=palettes.Inferno256,
                                  geoJSONSource = 'https://raw.githubusercontent.com/rapidsai/cuxfilter/master/javascript/demos/GTC%20demo/src/data/zip3-ms-rhs-lessprops.json',
                                  data_points=1000, width=1100, x_range=(-126, -66), y_range=(23, 50))

chart1 = charts.panel_widgets.range_slider('dti', width=400, height=400)
chart2 = charts.panel_widgets.range_slider('delinquency_12_prediction',data_points=50, width=400, height=400)
chart3 = charts.panel_widgets.range_slider('borrower_credit_score',data_points=50, width=400, height=400)

d = cux_df.dashboard([chart0, chart1], layout=layout_1)

d.add_charts([chart2, chart3])

await d.preview()
Inline preview of how the dashboard on .show() would look like as a webapp.
Additional context
import cudf
from cuXfilter import charts, DataFrame

df = cudf.DataFrame({'key': [0, 1, 2, 3, 4], 'val':[float(i + 10) for i in range(5)]})
cux_df = DataFrame.from_dataframe(df)

line_chart = charts.bokeh.line('key', 'val', data_points=5)
bar_chart = charts.bokeh.bar('key', 'val', data_points=5)
d = cux_df.dashboard([line_chart, bar_chart], title='Custom dashboard', data_size_widget=True)


d.preview()
output(image) preview of how the dashboard would look like in a full screen environment
So imagine I have multi gpu cluster (GPU node count > 1), I can see few general scenarios (there could be more):
Multiple user sessions can share the cuDF, and they execute same operations on load
Multiple user sessions can share the cuDF, but they execute different operations
Multiple user sessions have different cuDF, they execute same operations (either the functions are generic, or the data model is the same)
Multiple user sessions have different cuDF, they execute completely different operations
Q: How is cuxfilter ready for such scenarios? Is there some generic managment construct?
Q: How can I assign just some GPUs in cluster?
Q: Are aggregations (as per demo histogram) persisted in GPU memory and therefore accessible, or they are just returned to user and result is forgotten and again recalculated on next request?
Its really cool, because this can really boost real time aggregations or larger dataset aggregations.
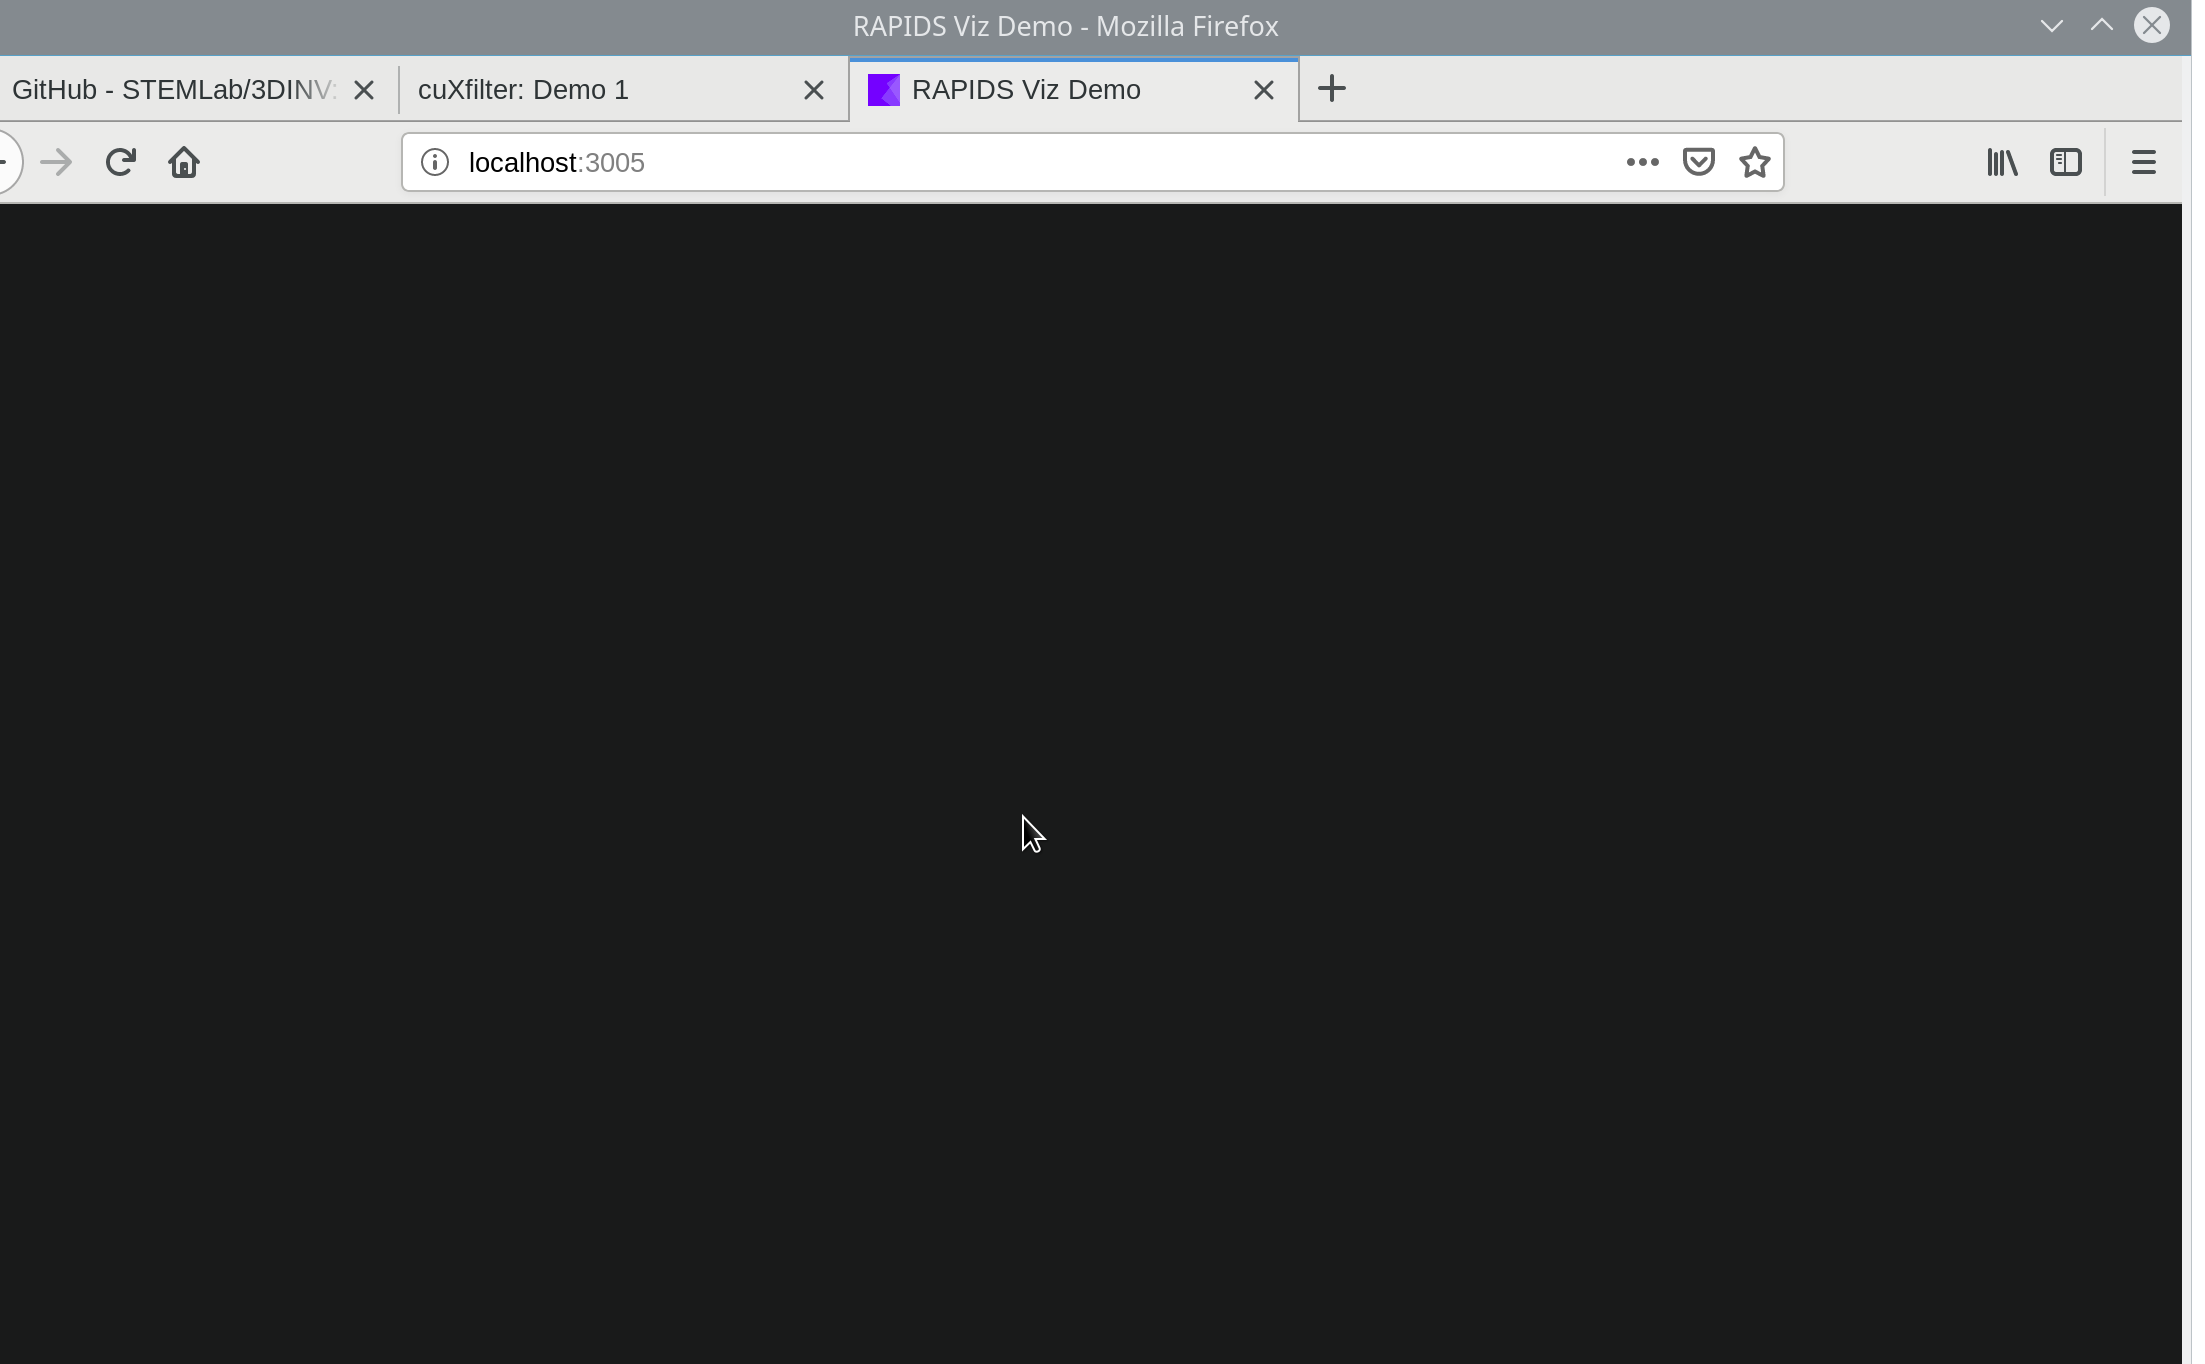
Hi there,
I managed to build the container deployed it on a remote server with it's ip_server address configured. demo/examples & GTC_Demo throws the error message at the subject. In Jupyter it seems to be working as I am getting bar charts and graphs from the dataset. Anyway what's happening here?
Thanks,
Tommy
I can display /demo page on port 3004 populated with data, but when accessing http://localhost:3005/ only black screen occurs
Is your feature request related to a problem? Please describe.
It would be nice to have a way to plot an image using an array of data (like a CuPy array). For example, here is Bokeh's image plot. Also here are some examples from Matplotlib.
Describe the solution you'd like
Basically something like image or imshow would capture my needs.
It's worth noting that people plotting images usually expect the origin to be in the upper left. For some interesting discussion in a case where a library deviated from this please see issue ( bokeh/bokeh#1666 ). Though it could make sense to have a user configurable origin to smooth over these differences.
Describe alternatives you've considered
Heatmap is close, but not quite what I'm looking for. It results in the image looking less smooth than one would like. That said, it could be a reasonable starting point if the implementations are close.
Additional context
This is mostly above, but would be happy to answer more questions. 🙂
A simple walkthrough guide to creating custom JS visualizations connected to cuDF, similar to the Mortgage Visualization Demo.
Describe the bug
When using dataframes with columns of type string, I get the following bug -> AttributeError: 'StringColumn' object has no attribute 'min'
Steps/Code to reproduce bug
from cuXfilter import charts, DataFrame
from cuXfilter.layouts import layout_1, layout_2
import cudf

df = cudf.DataFrame({'key': ['one', 'two', 'three', 'four', 'five'],'val':[float(i + 10) for i in range(5)]})

#create cuXfilter DataFrame
cux_df = DataFrame.from_dataframe(df)
line_chart = charts.bokeh.line('key', 'val', data_points=5)
bar_chart = charts.bokeh.bar('key', 'val', data_points=5)

charts = [line_chart, bar_chart]

#create the dashboard object
d = cux_df.dashboard(charts, title='Custom dashboard', data_size_widget=True)

#display the dashboard as a web-app
d.app()
Stack trace
AttributeError                            Traceback (most recent call last)
<ipython-input-2-4916d3157f84> in <module>
     13
     14 #create the dashboard object
---> 15 d = cux_df.dashboard(charts, title='Custom dashboard', data_size_widget=True)
     16
     17 #display the dashboard as a web-app

~/cuxfilter-design/cuXfilter/dataframe.py in dashboard(self, charts, layout, title, data_size_widget, warnings)
    117
    118         """
--> 119         return DashBoard(charts, self.data, layout, title, data_size_widget, warnings)

~/cuxfilter-design/cuXfilter/dashboard.py in __init__(self, charts, data, layout, title, data_size_widget, warnings)
     75             for chart in charts:
     76                 self._charts[chart.name] = chart
---> 77                 chart.initiate_chart(self)
     78
     79         self._title = title

~/cuxfilter-design/cuXfilter/charts/core/aggregate/core_aggregate_line.py in initiate_chart(self, dashboard_cls)
     77
     78         '''
---> 79         self.min_value = dashboard_cls._data[self.x].min()
     80         self.max_value = dashboard_cls._data[self.x].max()
     81         if self.stride is None:

~/anaconda3/envs/cudf_0.8/lib/python3.7/site-packages/cudf/dataframe/series.py in min(self, axis, skipna, dtype)
   1708         """
   1709         assert axis in (None, 0) and skipna is True
-> 1710         return self._column.min(dtype=dtype)
   1711
   1712     def max(self, axis=None, skipna=True, dtype=None):

AttributeError: 'StringColumn' object has no attribute 'min'What is your question?
I am just trying to pack some demo for our team and the original GTC demo is gone, its completely removed or just moved elsewhere? ...ok I can search in commit history to find ./demos folder removal as well, but maybe someone can enlighten me? 💃
Is your feature request related to a problem? Please describe.
Add support for bokeh heatmap chart type to be used in a crossfilter enabled dashboard
Describe the solution you'd like
https://bokeh.pydata.org/en/latest/docs/gallery/les_mis.html as one of the types that can be added to the dashboard with crossfilter functionalities enabled
Describe alternatives you've considered
There is an option to use the cudatashader heatmaps but that is not hoverable, and as interactive(info on hover, individual data-point selection to filter) as a bokeh heatmap is.
Integrate large scale network graph charts into cuXfilter via datashader.
A declarative, efficient, and flexible JavaScript library for building user interfaces.
🖖 Vue.js is a progressive, incrementally-adoptable JavaScript framework for building UI on the web.
TypeScript is a superset of JavaScript that compiles to clean JavaScript output.
An Open Source Machine Learning Framework for Everyone
The Web framework for perfectionists with deadlines.
A PHP framework for web artisans
Bring data to life with SVG, Canvas and HTML. 📊📈🎉
JavaScript (JS) is a lightweight interpreted programming language with first-class functions.
Some thing interesting about web. New door for the world.
A server is a program made to process requests and deliver data to clients.
Machine learning is a way of modeling and interpreting data that allows a piece of software to respond intelligently.
Some thing interesting about visualization, use data art
Some thing interesting about game, make everyone happy.
We are working to build community through open source technology. NB: members must have two-factor auth.
Open source projects and samples from Microsoft.
Google ❤️ Open Source for everyone.
Alibaba Open Source for everyone
Data-Driven Documents codes.
China tencent open source team.