Giter Club home page Giter Club logo

tmap's Introduction

tmap: thematic maps in R

R-CMD-check Codecov test coverage CRAN CRAN checks Downloads License r-universe

tmap is an actively maintained open-source R-library for drawing thematic maps. The API is based on A Layered Grammar of Graphics and resembles the syntax of ggplot2, a popular R-library for drawing charts.

Classic World Map Bubble Map Bubble Map World facets US Choropleth US Choropleth London Crimes London Crimes London Crimes London Crimes

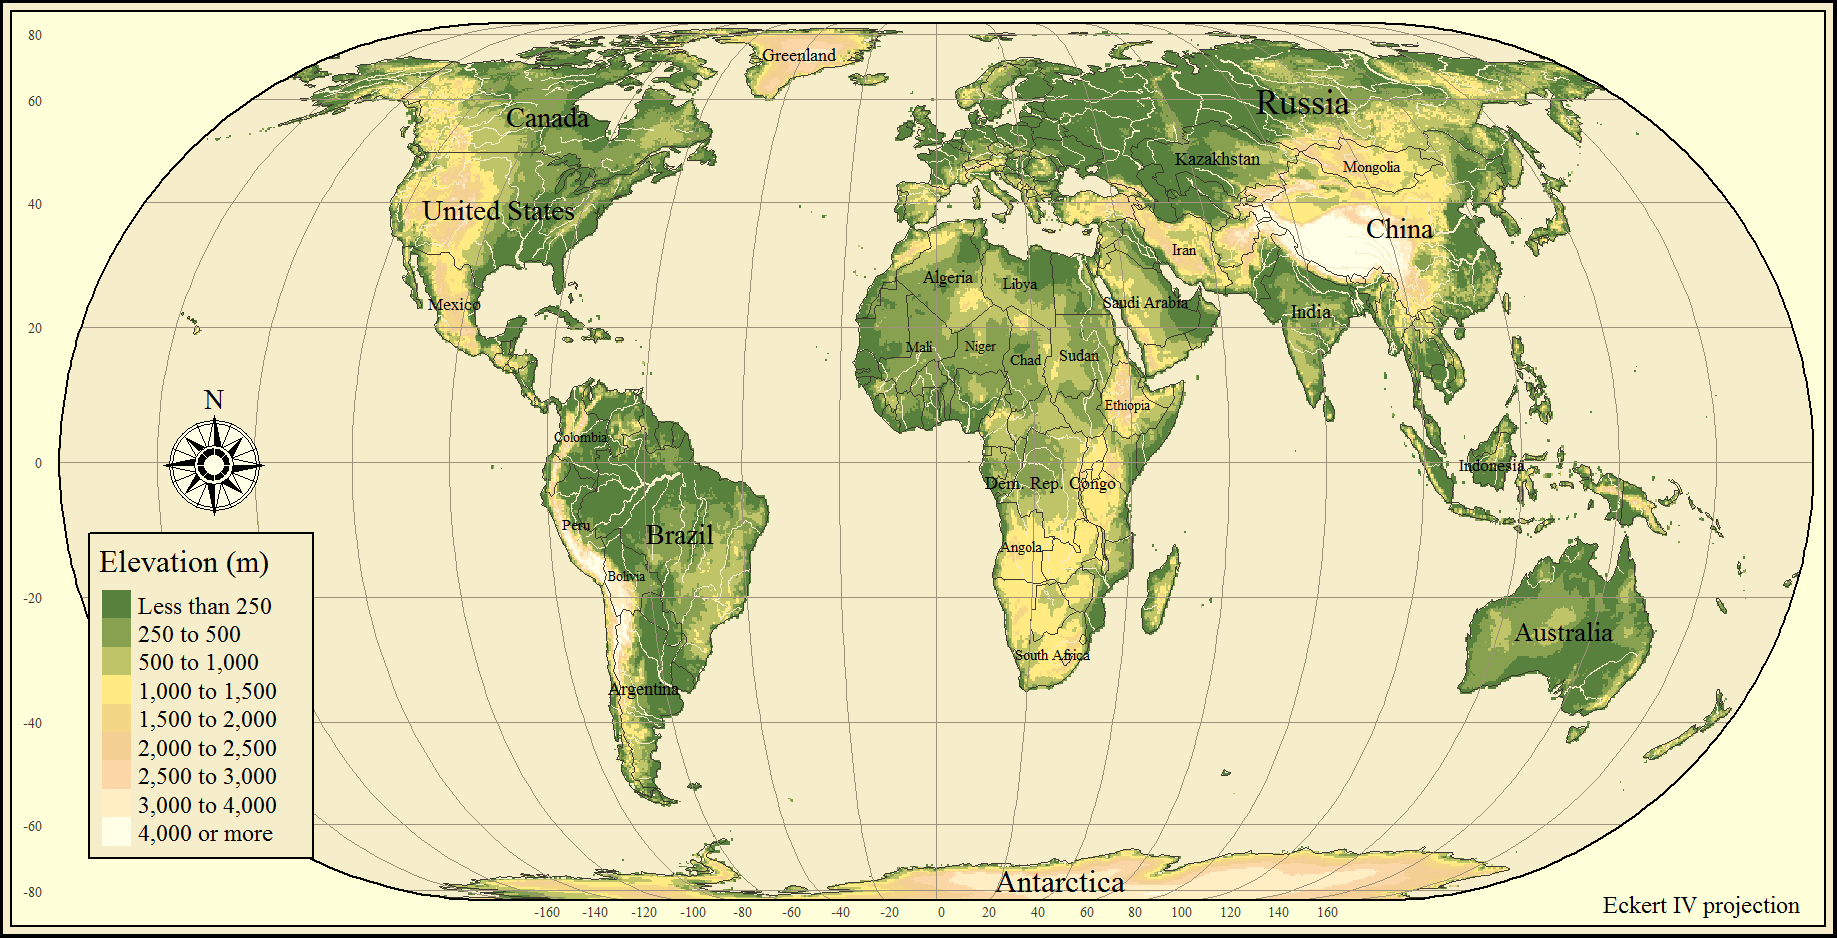
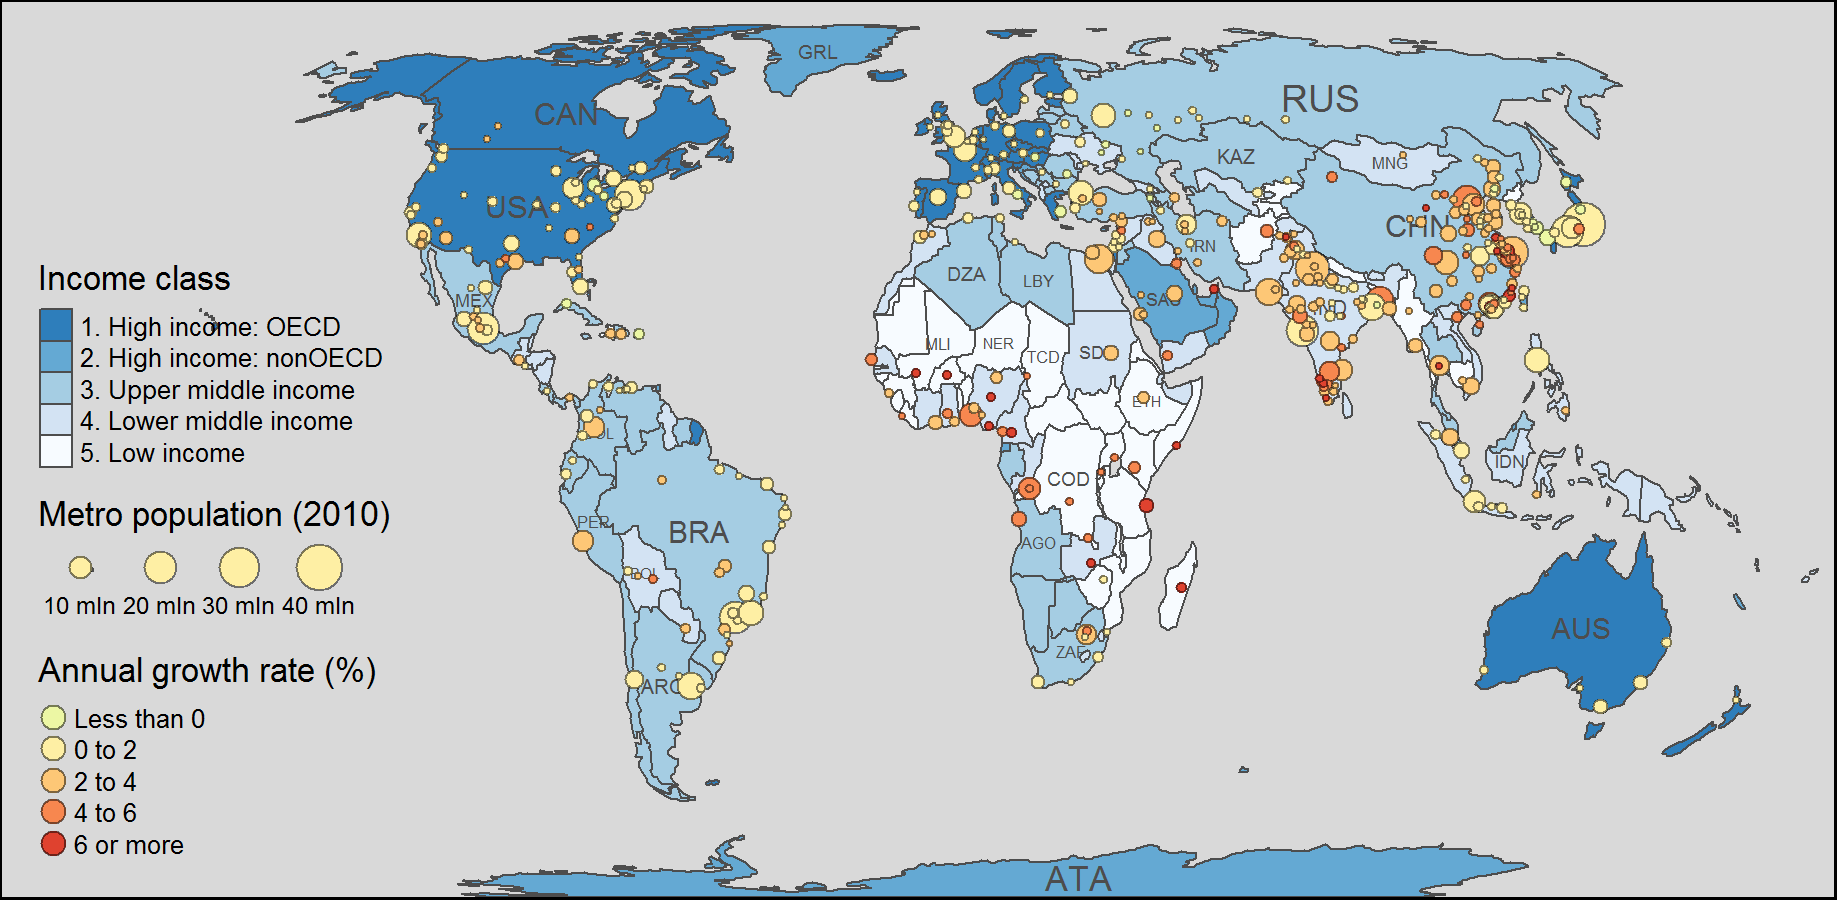
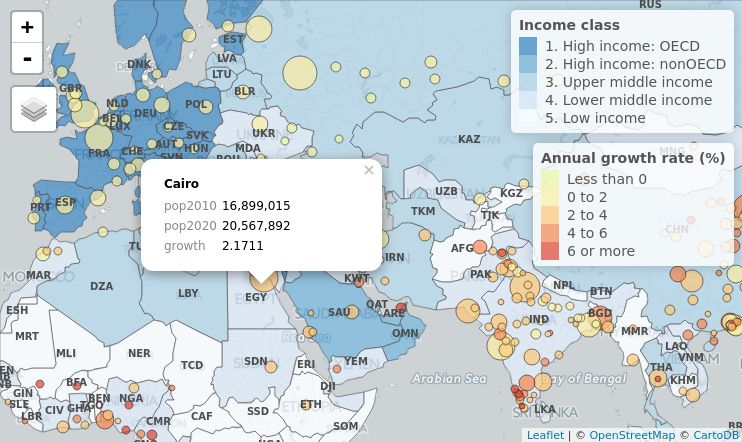
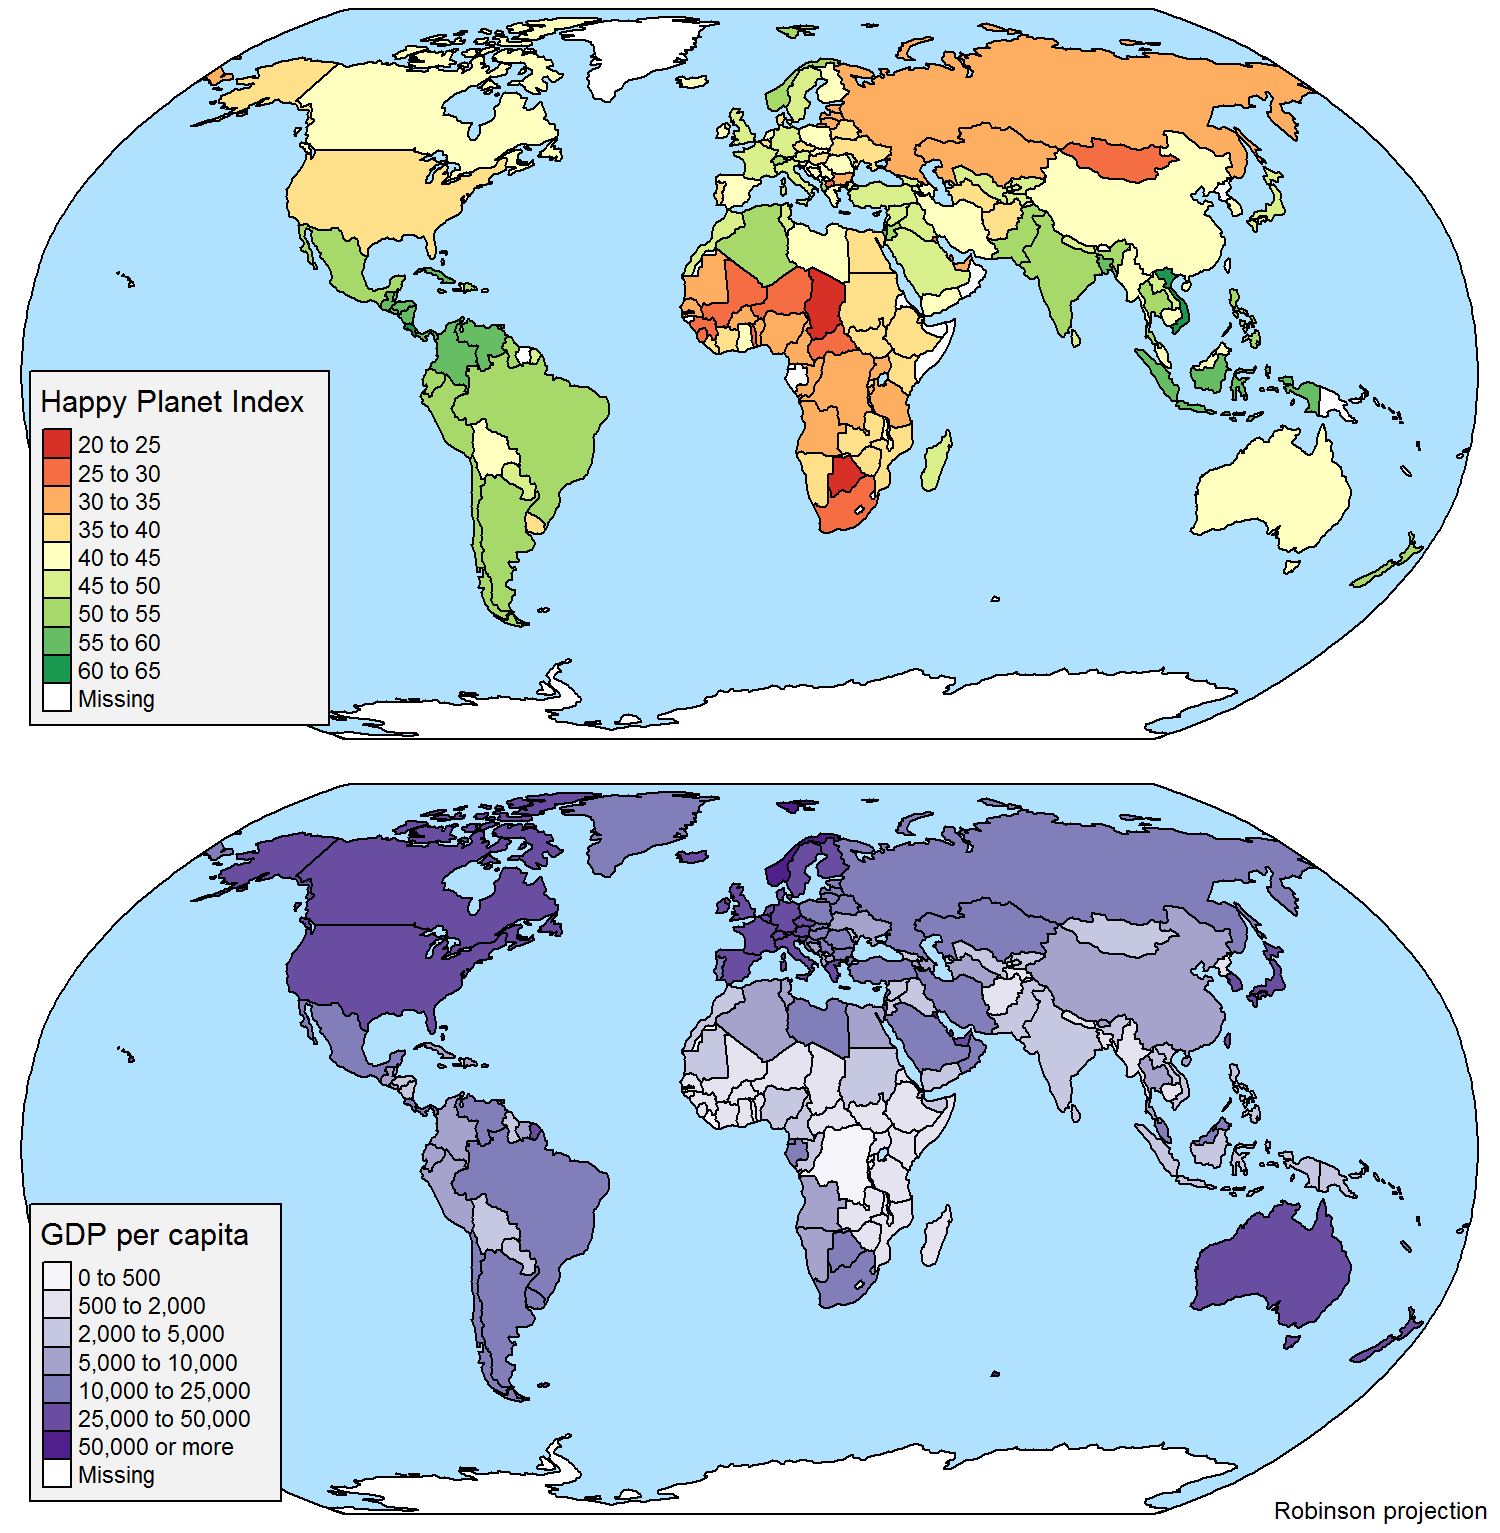
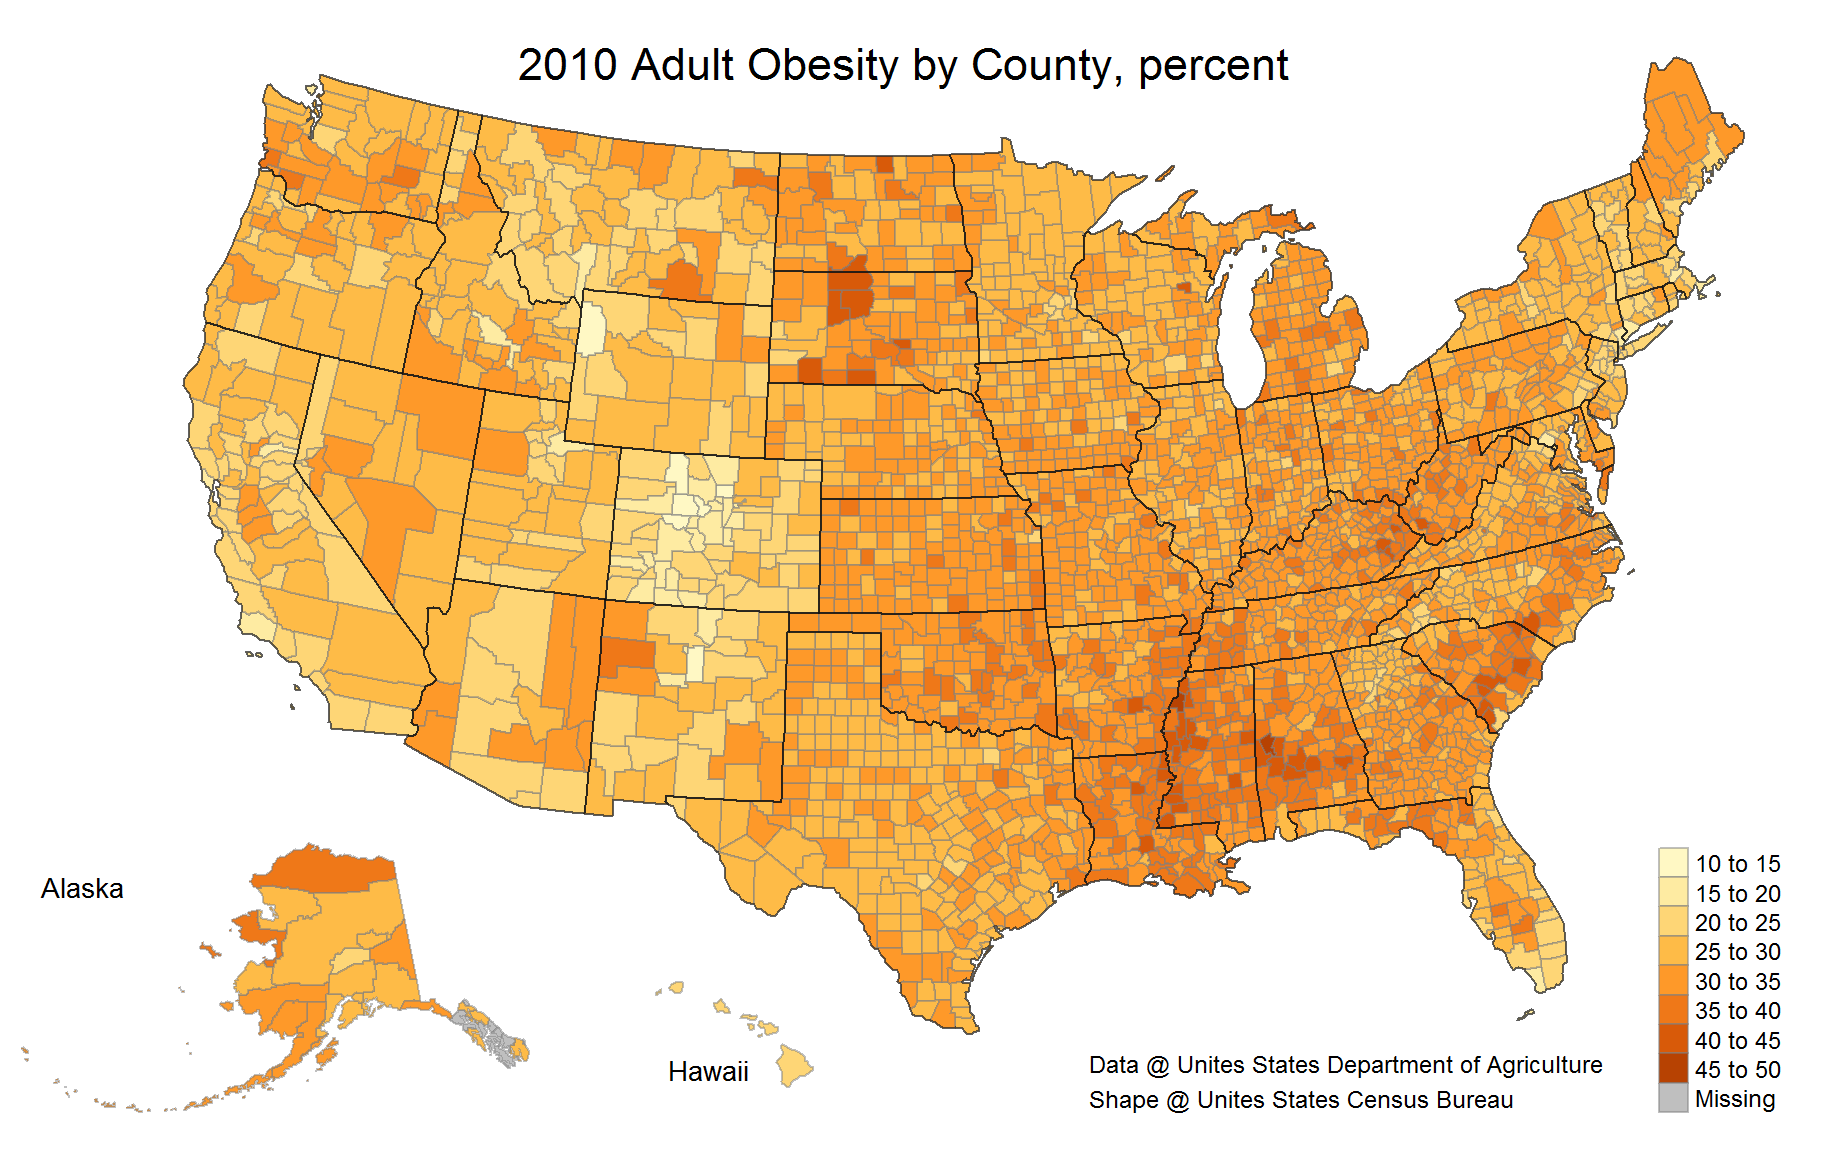
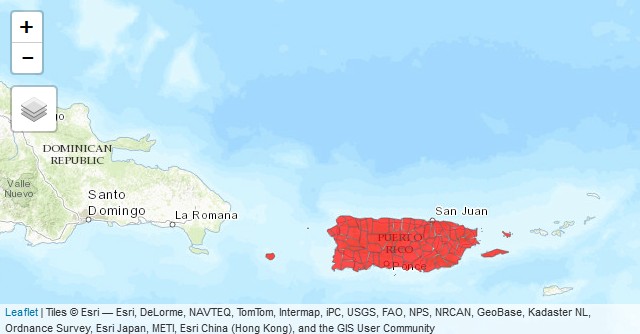
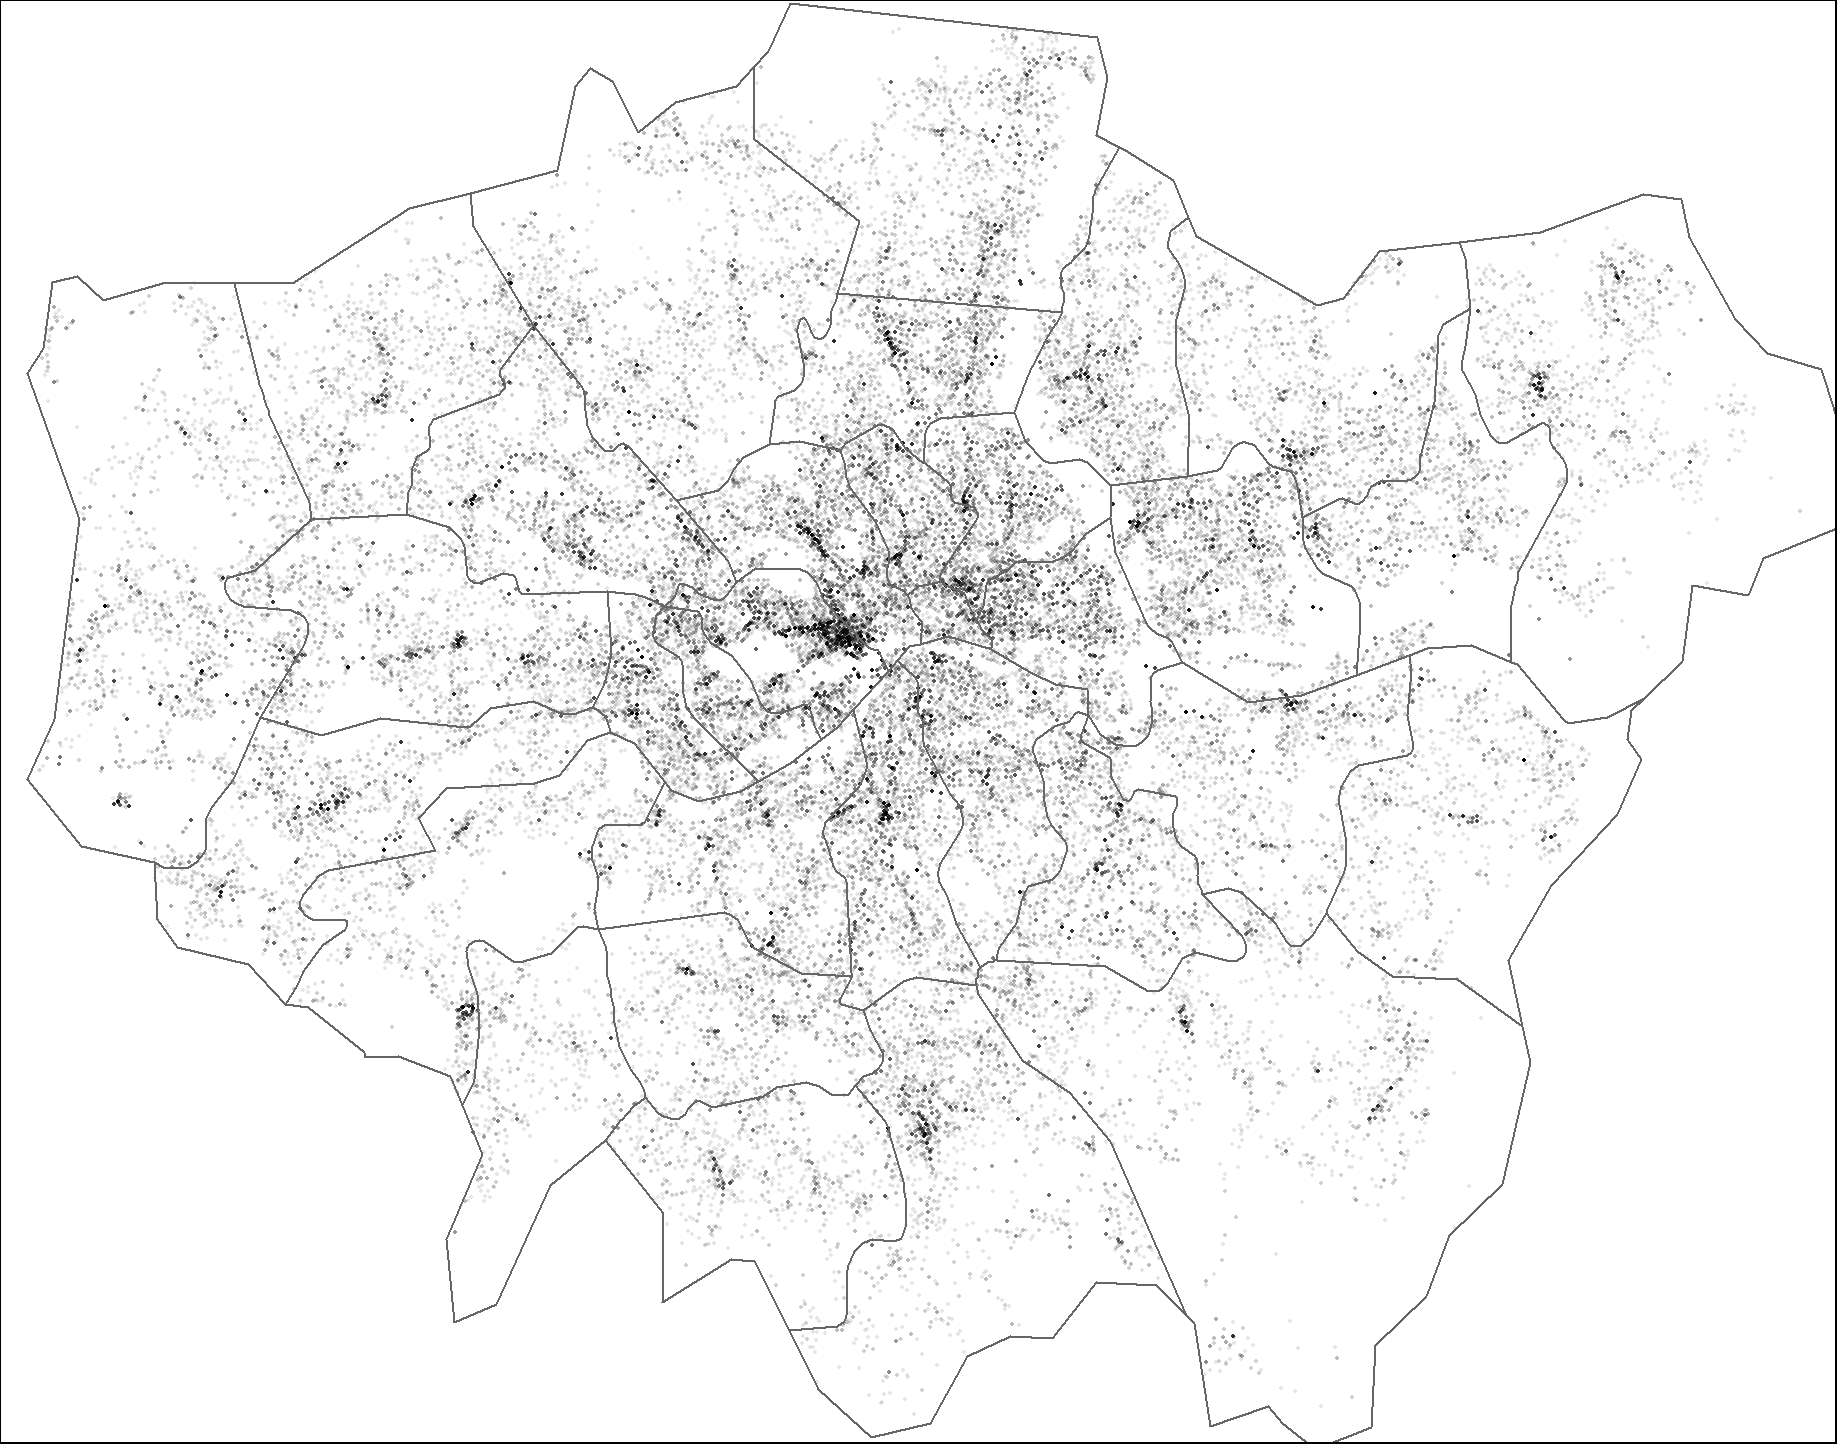
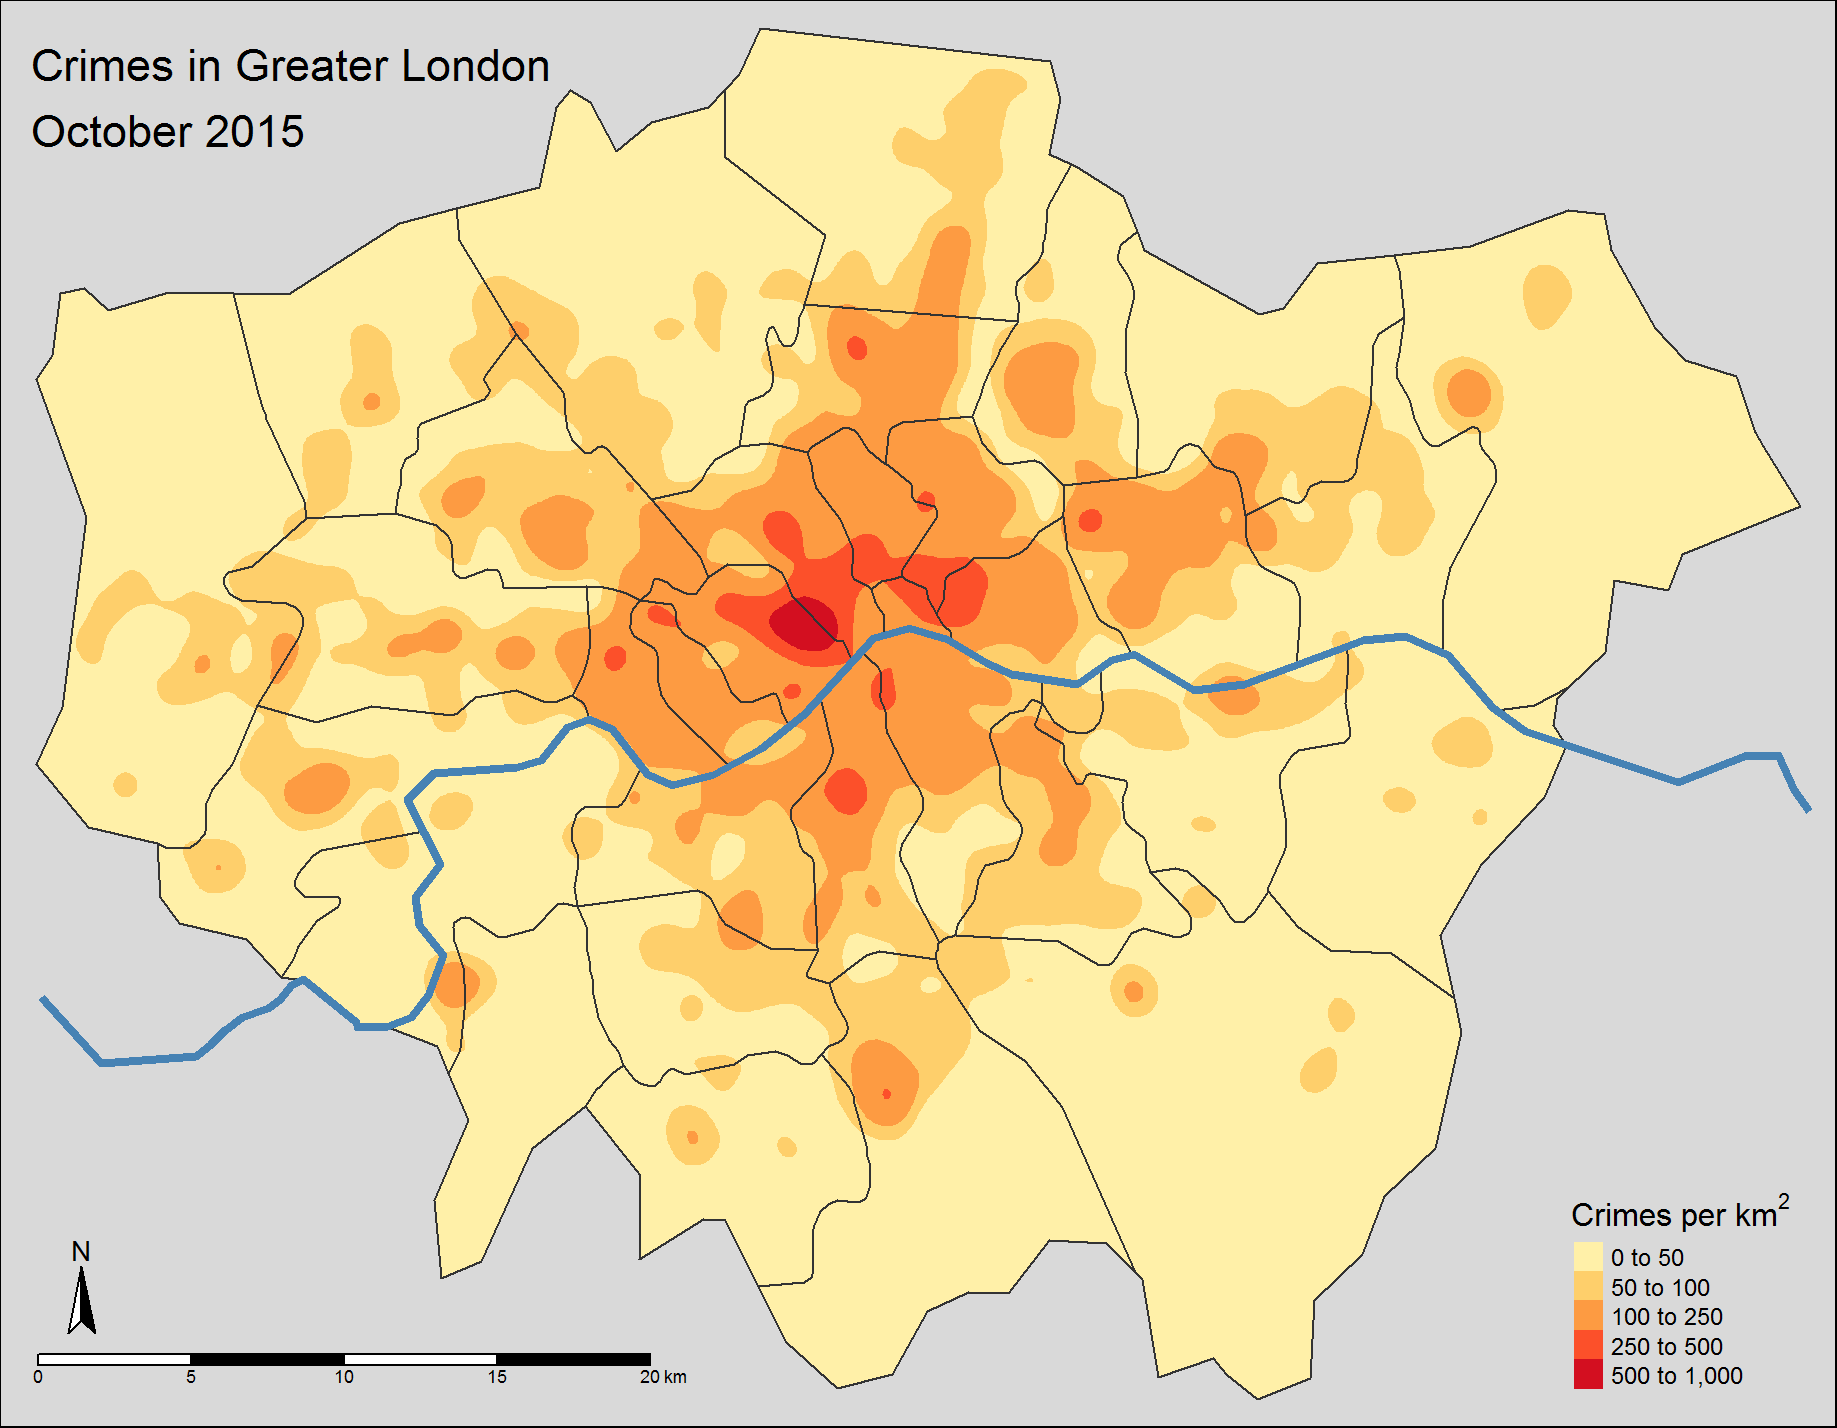
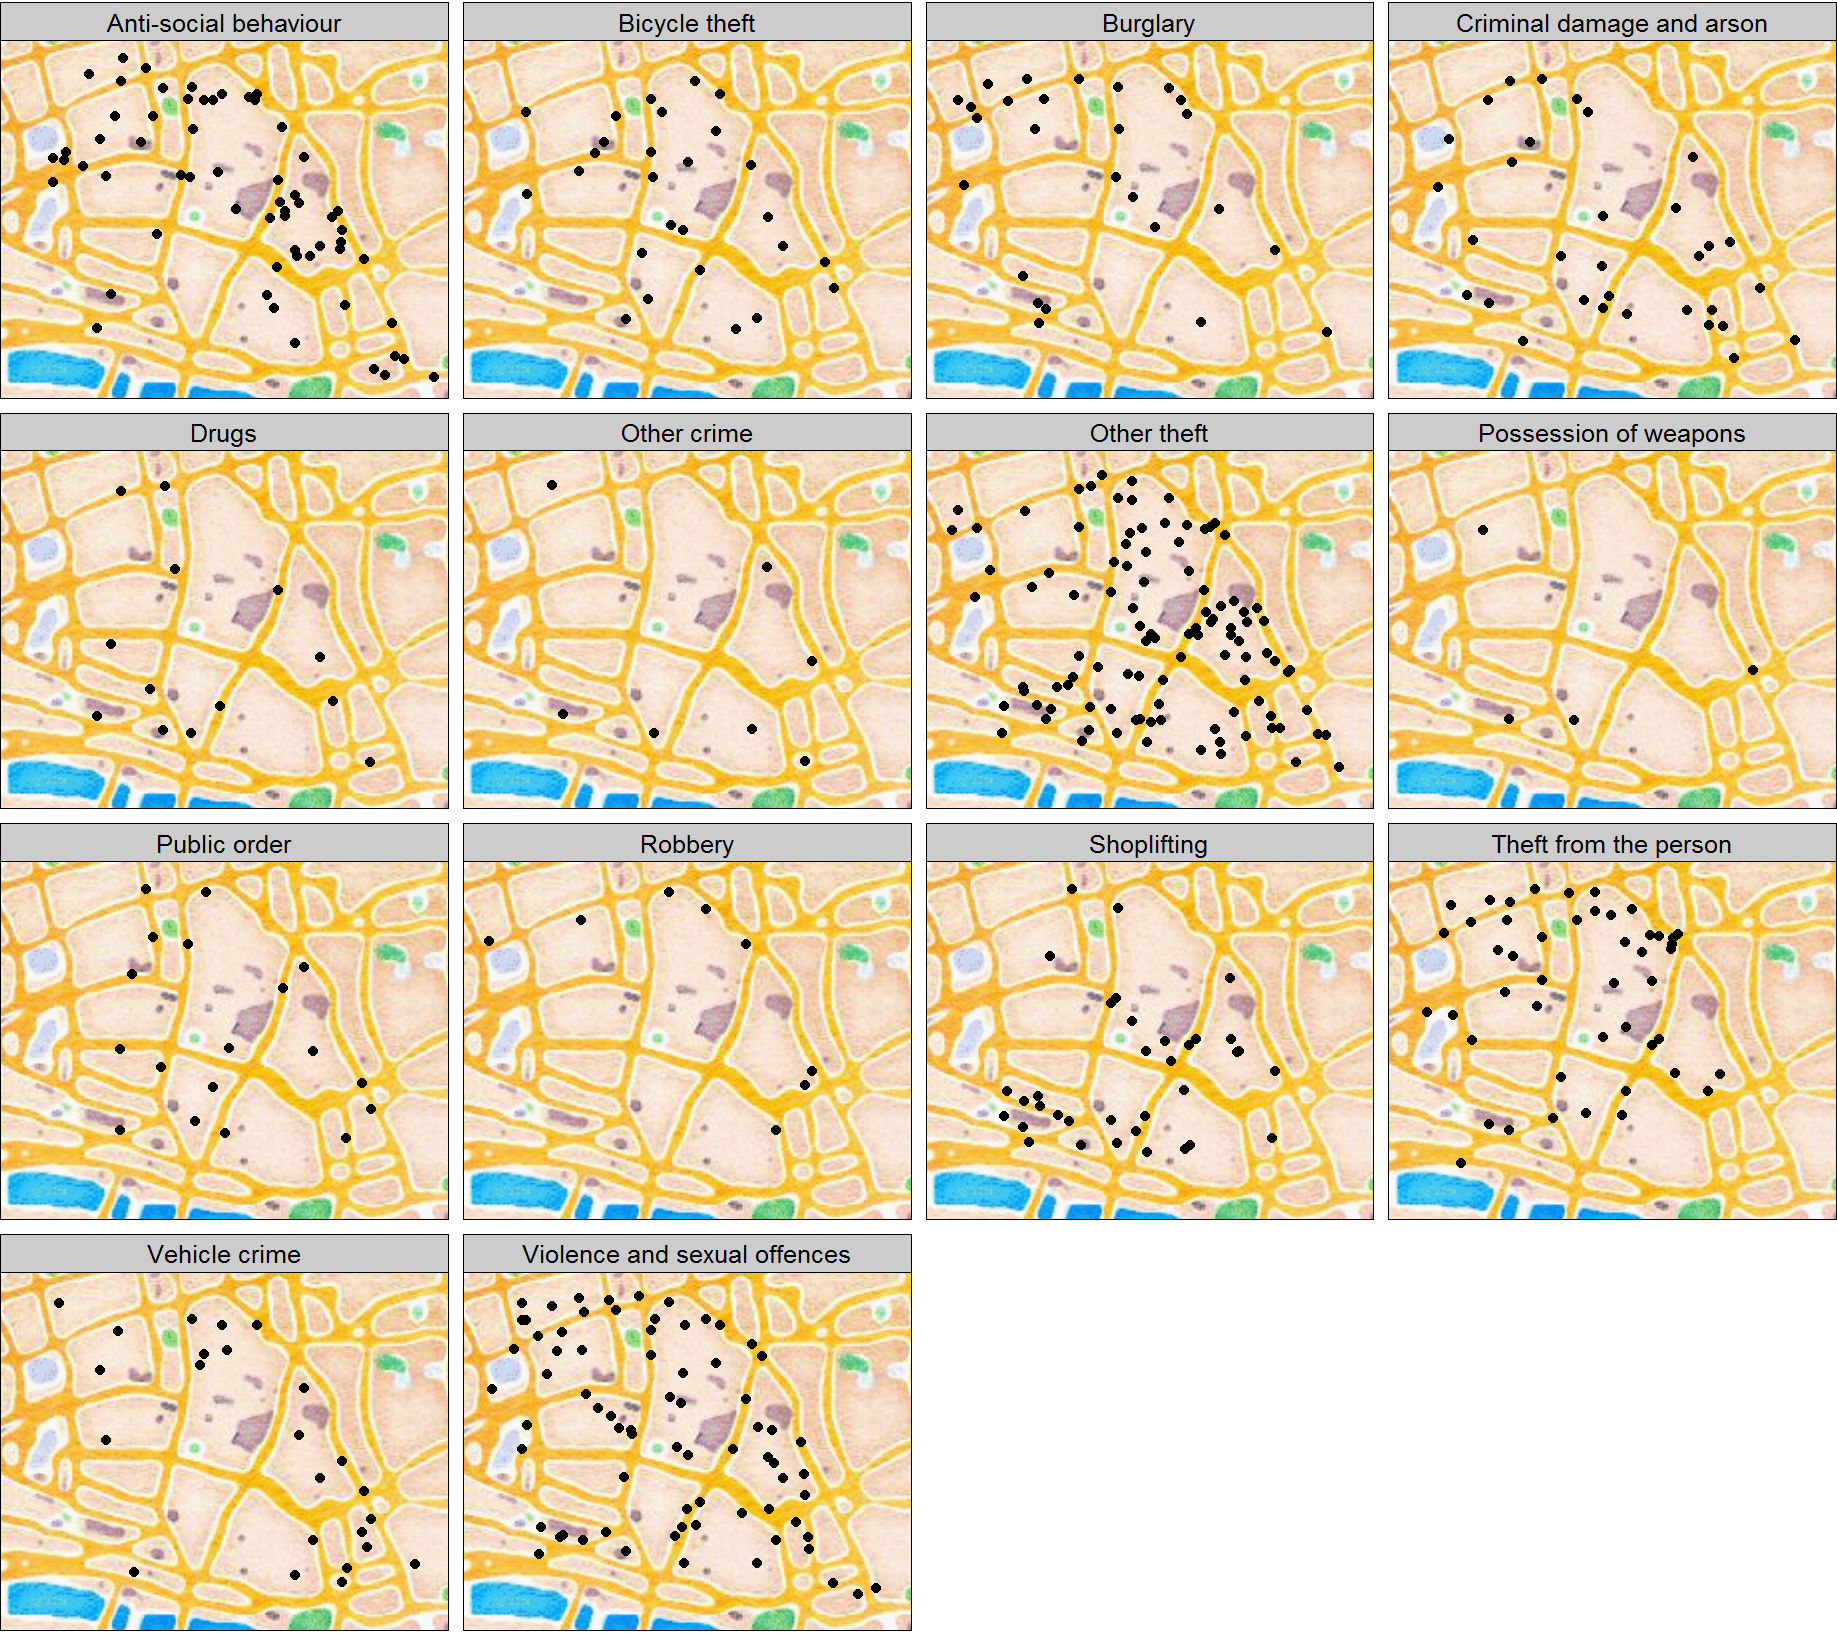
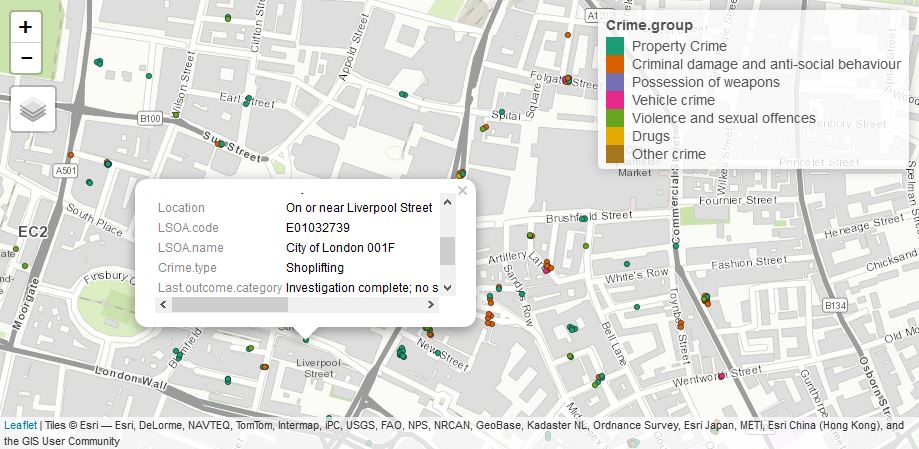
See below the source code for these images.

Installation

tmap is available on CRAN. Installation is straightforward:

install.packages("tmap")

For Linux and macOS users who are new to working with spatial data in R, this may fail since additional (non-R) libraries are required (which are automatically installed for Windows users).

Windows No additional installation required.

Linux (Ubuntu) See https://geocompx.org/post/2020/installing-r-spatial-packages-linux/. Please address installation issues in this issue.

macOS See https://www.kyngchaos.com/. Please address installation issues in this issue.

Development

The latest development version can be installed using remotes. In order to use the development version of tmap, it is recommended to use the development version of tmaptools as well:

# install.packages("remotes")
install_github("r-tmap/tmap")

# On Linux, with pak
# install.packages("pak")
pak::pak("r-tmap/tmap")

# Or from r-universe
install.packages("tmap", repos = c("https://r-tmap.r-universe.dev", "https://cloud.r-project.org"))

See NEWS for the latest features and improvements and the issue list for discussions of enhancements and bugs.

Do you want to help with the development of the package? Please let us know! Any feedback, requests, tips, or bug reports are welcome!

Usage

library(tmap)

Reference

Tennekes, M., 2018, tmap: Thematic Maps in R, Journal of Statistical Software, 84(6), 1-39

This paper has been written for tmap 1.11-2. See the reproducible code using tmap 2.x.

Vignettes

tmap v3: get started!

tmap: what is changed in recent versions?

Tutorials

tmap in RMarkdown

Presentations

Other resources

Getting help

There are two main places to get help with tmap:

  1. stackoverflow is a great source of answers to common tmap questions. It is also a great place to get help, once you have created a reproducible example that illustrates your problem. Please tag your questions with tmap.
  2. If you have a request or if think your problem is caused by a bug, please open an issue, preferably with a reproducible example.

tmap's People

Contributors

asifm avatar beansisfat avatar behrica avatar ccamara avatar colinfay avatar dieghernan avatar edzer avatar ivanpalm avatar jannes-m avatar joelgombin avatar johnaclouse avatar kant avatar kbrevoort avatar matthieustigler avatar mpadge avatar mtennekes avatar nfrechen avatar nowosad avatar olivroy avatar philmikejones avatar pmur002 avatar promerpr avatar rlzijdeman avatar robinlovelace avatar see24 avatar sjewo avatar stragu avatar timelyportfolio avatar wibeasley avatar

Stargazers

 avatar  avatar  avatar  avatar  avatar  avatar  avatar  avatar  avatar  avatar  avatar  avatar  avatar  avatar  avatar  avatar  avatar  avatar  avatar  avatar  avatar  avatar  avatar  avatar  avatar  avatar  avatar  avatar  avatar  avatar  avatar  avatar  avatar  avatar  avatar  avatar  avatar  avatar  avatar  avatar  avatar  avatar  avatar  avatar  avatar  avatar  avatar  avatar  avatar  avatar  avatar  avatar  avatar  avatar  avatar  avatar  avatar  avatar  avatar  avatar  avatar  avatar  avatar  avatar  avatar  avatar  avatar  avatar  avatar  avatar  avatar  avatar  avatar  avatar  avatar  avatar  avatar  avatar  avatar  avatar  avatar  avatar  avatar  avatar  avatar  avatar  avatar  avatar  avatar  avatar  avatar  avatar  avatar  avatar  avatar  avatar  avatar  avatar  avatar  avatar

Watchers

 avatar  avatar  avatar  avatar  avatar  avatar  avatar  avatar  avatar  avatar  avatar  avatar  avatar  avatar  avatar  avatar  avatar  avatar  avatar  avatar  avatar  avatar  avatar  avatar  avatar  avatar  avatar  avatar

tmap's Issues

Raster image transparency problem

I have a raster image which I overlay over a (partially filled) polygon layer and I want that the filled polygons "shine through" for every raster point which is NA.

I played with all combinations of 'alpha' and colorNA, but don't get it working.

It is the default behavior of using two calls to plot:

plot(world.eu);plot(koppenCombined,add=T)

I can simulate it 'nearly' by using something like:

qtm(world.eu) + 
tm_shape(koppenCombined) + 
tm_raster(alpha = 0.5,colorNA = c("#FFFFFFFF"))

but it is not the same, as in this case the whole second layer is semi-transparent (so 'pale')

I only want the NA dots of the raster layer to be (full) transparent.

The documentation of raster::plot says:

colNA: The color to use for the background (default is transparent)

It seems to me that I cannot get the same effect by using 'colorNA' from tm_raster()

crop rasters

crop_shape only works with points, lines and polygons, not yet with raster shapes.

map scale bar and north arrow

A map scale bar and north arrow were (and still are) on the wishlist.
We could add the layer functions tm_scale(metric="km", position) and tm_north(degrees=0, position). As for the tm_scale, the map coordinate units have to be known (or specified). This could be either done in tm_scale itself, or in tm_shape. For calculating choropleth area densities, I assumed coordinate units to be meters by default.

How to set top/bottom outer margins?

Hi,
I'm trying to replicate the attached map layout using tmap, but I'm not finding the right values for argument outer.margins. Basically I'd like to place the title and any legend in the outer top part over a white background, and credits in the outer bottom, and have a default grey background inside the frame.

I've tried to define a layout below with different top/bottom margin values, but don't get any extra outer margin.

Thanks for any help!

windowsFonts(ArialNarrow=windowsFont("Arial Narrow"))

tm_layout_hc <- function(...) tm_layout(
    fontfamily="ArialNarrow",
    bg.color="grey80",
    outer.margins=c(4, 0, 8, 0), 
    outer.bg.color="white",
    legend.position=c("left", "top"), 
    title.snap.to.legend=T,
  aes.color=c(
    fill="darkolivegreen3", borders="black", 
    bubbles="tomato2", dots="firebrick",
    lines="steelblue", text="grey20", na="grey50"),
  aes.palette=list(seq="YlGn", div="RdYlGn", cat="Set3"),
...)

ind-rurpop-2010

Facets by two variables

I'd love to be able to facet maps by two variables, like in ggplot2 for instance. And this would be all the more useful that with ggplot2 you can't have free fill scales for choropleth maps.

Foreground / text color is fixed

tmap produces nice looking maps! Alas the foreground and text color in maps are set to "black" by default. It would be a great enhancement, if the forground color could be set as an option in tm_layout.

Credits

We should be able to add, beyond the title and the legend, some credits to the map. I think something like tm_credits(text, position, ...) would be in order.

Facets happen too easily

Reproducible example:

Run the code on this page: https://github.com/Robinlovelace/stplanr

The this is the result of the following code:

tm_shape(osm_tiles) +
  tm_raster() +
  tm_shape(rnet) +
  tm_lines(lwd = rnet$All / rnet$All) 

rplot

Not sure what's going on here - guess I've mis-understood the tmap syntax.

What I want is a plot like this but with the osm background:

rplot

tm_scale_bar doesn't work

Running the exemple

tm_shape(Europe, unit = "miles", unit.size=1609) + tm_polygons() + tm_scale_bar()

doesn't produce a scale bar.

qtm() fails on raster with on only a single value an NA

I have a raster object which values or only 1 and NA.
tmap fails to render this wit-:

Error in classIntervals(x, n, style = style) : single unique value

 x=raster(ncol=2,nrow=2)
values(x) <- c(NA,1,1,NA)
plot(x)
qtm(x)

plot works, while qtm fails.

By replacing NA with 0, it works as well.
But I get the the raster from a file with the NA present, so I suppose it should work as well here.

Anchorpoints for positioning legend and tm_text labels

Hi Martijn,
I produced a lot of figures with your package and it's working really well!
If I look back at my workflow, it would be a great enhancement, if the positioning achor points ("top left corner", "center" and so on) could be explicitly defined.

In my usecase this had been useful in an specific situation:
I produced multiple maps for the same shapefile with different variables. The automatic legend placement wasn't optimal, so I had to position the legend manually. For different legends I had to change the position argument, because the size of the legend changed. An anchor point for positioning the legend at the top left corner (i put the legend on the right side of the plot) would fix this problem and makes reusing the positioning for many plots usable.

An similar problem occured while using xmod and ymod with 'tm_text'. After printing a map into a grid-viewport, the automatic positioning of the labels was wrong (to much space between point coordinates and label), so I set them manually via the xmod and ymod option. This was somehow time consuming, because I wanted the label left from the coordinates and the position anchor was in the center of the label and had to set different values for labels of different length.

Here is an example for tm_text:

library(tmap)
data(NLD_muni, NLD_prov)

# autoplacement
tm_shape(NLD_prov) +    tm_fill("population", style="quantile") + tm_borders() + tm_shape(NLD_muni[c(114,30,50,200),]) + tm_dots("green") + tm_text("name", auto.placement=T)

# static xmod an ymod
tm_shape(NLD_prov) +    tm_fill("population", style="quantile") + tm_borders() + tm_shape(NLD_muni[c(114,30,50,200),]) + tm_dots("green") + tm_text("name", auto.placement=F, xmod=2.5, ymod=0.1)

# mimimc the autoplacement with xmod an ymod - manual adjustment needed for every entry
tm_shape(NLD_prov) +    tm_fill("population", style="quantile") + tm_borders() + tm_shape(NLD_muni[c(114,30,50,200),]) + tm_dots("green") + tm_text("name", auto.placement=F, xmod=c(1.7,3.5,2.5,2.2), ymod=0.3)

Mathematical annotation

Hi Martijn,

another point on my wishlist:
I'd like to see support for mathematical annotations. At the moment it is not possible to use expression() in a legend title.

I see, that this is not an easy task, because the use of expression will break code at many places. Maybe there are alternative solutions?

tmap installation failed until I manually installed Shiny

FYI I have used tmap with no problem on 2 other systems, but when I tried to install it on a fresh R installation, the tmap install failed saying there was no package "shiny." Maybe that should be added to the package dependencies? Installation worked fine after I first manually installed shiny.

I really like the tmap package and am looking forward to any work you do on interactive maps!

Thanks.

inconsistent legend behaviour

Whether subtitles are used in the legend is not completely consistent.

Compare:

data(World)

rivers$constant <- factor("Rivers")
tm_shape(World) +
    tm_fill() +
tm_shape(rivers) +
    tm_lines(col="constant", palette="dodgerblue3") +
tm_layout_World("World map")

and

rivers$constant <- factor("Rivers")
tm_shape(World) +
    tm_fill() +
tm_shape(rivers) +
    tm_lines(col="constant", palette="dodgerblue3") 

Maybe this is desired, but it can actually become a problem when there is more than one legend item:

data(cities)
cities$constant <- factor("Cities")

tm_shape(World) +
    tm_fill() +
tm_shape(rivers) +
    tm_lines(col="constant", palette="dodgerblue3") +
tm_shape(cities) +
    tm_bubbles(size=1, col = "constant") +
tm_layout("A map")

Interactivity (part 2)

Please check out the new branch called leaflet, which will soon be merged to the master branch. Today, I managed to output tmap interactively by using leaflet. I turned out to be pretty straightforward.

The old interactive itmap also worked (thanks again @timelyportfolio), but had some flaws and did not support zoomable OSM tiles. The new approach is easy maintainable, since it just a wrapper of leaflet (wonderful package, thanks @jcheng5)

Some remarks:

  • It (obviously) does not support small multiples. For convenience, I just take the first small multiple.
  • The projection is always Mercator.
  • The legend is limited to a legend of polygon colors, I guess(?)
  • Map attributes, such as compass, are not shown.

The two examples in https://github.com/mtennekes/tmap/blob/leaflet/examples/itmap.R work. I'll implement text, lines and raster images soon.

What I would also like is a master opacity slider in leaflet to control the overall opacity of the layers. Don't no if it's possible, and if not, a opacity or alpha argument to itmap will do.

bb bug?

I've encountered a weird error with bb, which I can't fully understand, even by looking (quickly) at the source code.

This code:

bb(x = matrix(c(881247, 905582, 6232997, 6257704), nrow = 2, ncol = 2, dimnames = list(c("x", "y"), c("min", "max"))),
   ext = 1.2,
   projection = "+proj=lcc +lat_1=44 +lat_2=49 +lat_0=46.5 +lon_0=3 +x_0=700000 +y_0=6600000 +ellps=GRS80 +units=m +no_defs",
   current.projection = "+proj=lcc +lat_1=44 +lat_2=49 +lat_0=46.5 +lon_0=3 +x_0=700000 +y_0=6600000 +ellps=GRS80 +units=m +no_defs")

leads to an error: Error in .spTransform_Polygon(input[[i]], to_args = to_args, from_args = from_args, : failure in Polygons 1 Polygon 1 points 1

whereas

bb(x = matrix(c(881247, 905582, 6232997, 6257704), nrow = 2, ncol = 2, dimnames = list(c("x", "y"), c("min", "max"))),
   ext = 1.2)

works, as well as:

bb(x = matrix(c(881247, 905582, 6232997, 6257704), nrow = 2, ncol = 2, dimnames = list(c("x", "y"), c("min", "max"))),
   ext = 1.2,
#   projection = "+proj=lcc +lat_1=44 +lat_2=49 +lat_0=46.5 +lon_0=3 +x_0=700000 +y_0=6600000 +ellps=GRS80 +units=m +no_defs",
   current.projection = "+proj=lcc +lat_1=44 +lat_2=49 +lat_0=46.5 +lon_0=3 +x_0=700000 +y_0=6600000 +ellps=GRS80 +units=m +no_defs")

or

bb(x = matrix(c(5, 45, 6, 46), nrow = 2, ncol = 2, dimnames = list(c("x", "y"), c("min", "max"))),
   ext = 1.2,
   projection = "longlat",
   current.projection = "longlat")

and this lags:

bb(x = matrix(c(881247, 905582, 6232997, 6257704), nrow = 2, ncol = 2, dimnames = list(c("x", "y"), c("min", "max"))),
   ext = 1.2,
   projection = "+proj=lcc +lat_1=44 +lat_2=49 +lat_0=46.5 +lon_0=3 +x_0=700000 +y_0=6600000 +ellps=GRS80 +units=m +no_defs",
   # current.projection = "+proj=lcc +lat_1=44 +lat_2=49 +lat_0=46.5 +lon_0=3 +x_0=700000 +y_0=6600000 +ellps=GRS80 +units=m +no_defs"
   )

What am I missing here?

raster issue

Just for the record, tmap doesn't work well with R-devel. The problem is not caused by raster, in a simple example:

as.vector(1:4)
# works

library(raster)
as.vector(1:4)
# throws: Error in as.vector(1:4) : argument "mode" is missing, with no default

Also, this example fails with R-devel:

# load SpatialGridDataFrame
data(meuse.grid)
coordinates(meuse.grid) = c("x", "y")
gridded(meuse.grid) = TRUE
class(meuse.grid)

# cast to RasterBrick (throws error in R-devel, works in R 3.2.3)
as(meuse.grid, "RasterBrick")

# alternative (also throws error in R-devel, works in R 3.2.3)
brick(meuse.grid)

I already contacted Robert Hijmans about it...

Default font

I think the defult value of the fontfamily argument to the tm_layout function should be whatever default font family the device is using. That's particularly useful in knitr, for example (with somethink like this)

opts_chunk$set(
               dev = "cairo_pdf",
               dev.args = list(family = 'A750-Sans-Light'),
 )

allow legend for tm_borders

Currently the tm_borders does not forsee to have a legend.

In my map I draw a red border arround some polygons and I would be usefull to be able to add a legend, which says:

"---- area of xxxxx" (where ---- would be a small red line)

Interactivity

A follow-up thread from mtennekes@75d70a8

Below on overview on the ideas regarding interactivity so far. I'm also trying to figure out how the interactivity works from a user perspective. Comments and ideas are welcome.

Basic interactivity:

  • No zooming nor panning
  • Mouse-over:
    • show (thicker) borders of object. If objects have no color aesthetics, color highlighting/opacity can be added as well.

    • show hover text, which contains:

      1. the name/id value of the object. Each layer function (e.g. tm_bubbles) will get an id argument, in which the variable name of the id/name can be given.
      2. the values that are linked to the aesthetics of the corresponding layer.
        For example if we have a bubble map of cities, the hover text could be:

      London
      pop2010: 9,698,872
      growth: 1,19

  • How does the user enable interactivity, or is it by default interactive? I could add an argument interactive to tm_layout, that is TRUE by default.
  • Implementation: via gridSVG, maybe wrapped to an htmlwidget?

More advanced interactivity:

  • Zooming and panning
  • Mouse-over: similar to above
  • Implementation: htmlwidgets with javascript d3 and leaflet for OSM layers. In this case, tmap would be not so very different from the R package leaflet, or is it? As far as I know, that package (which I like very much) is lower level, and has some limitations (e.g. no bubble size legend). Maybe, we could also use the R package leaftlet...

Let me know what you think.

Are there plans to generalise download of raster tiles to make more tilesets available?

Not sure if this is the right place to be asking this.

But I'm wondering if there is a way to include a wider range of base maps, e.g. by using leaflet's trick of allowing the base url to be set: https://rstudio.github.io/leaflet/basemaps.html

Completely understand the desire to use mostly open data - there are more available here: http://wiki.openstreetmap.org/wiki/Slippy_map_tilenames .

Other than a general interest in this question I'm wondering about methods for accessing before/after imagery. Automating that could be really useful, e.g. for identifying poor management practice which increases flooding, as illustrated by the Google Earth imagery here: http://www.theguardian.com/commentisfree/2015/dec/29/deluge-farmers-flood-grouse-moor-drain-land

Also for @dkahle are there any plans for generalising get_map to include more tileservers? Notice that get_navermap is quite new.

Sorry this question is so broad and potentially off-topic.

examples with USAboundaries package

I think the USAboundaries package from @lmullen / @ropensci provides some interesting material for more examples or its own vignette with tmap.

As a starter, here is some code as I played around.

#devtools::install_github("ropensci/USAboundaries")

library(USAboundaries)
library(tmap)

tm_shape(us_boundaries("2000/12/31")) +
  tm_polygons("start_date",palette="-Purples")

tm_shape(us_boundaries("1800/01/01")) +
  tm_fill() +
  tm_facets(by="name")

tm_shape(us_boundaries("1800/01/01")) +
    tm_fill()  +
    tm_facets(by="name", free.coords = TRUE)

tm_shape(us_boundaries("1850/01/01")) +
    tm_fill("terr_type") +
    tm_borders()

tm_shape(us_boundaries("1850/01/01")) +
    tm_facets("terr_type") +
    tm_borders() +
    tm_fill("terr_type") 

how to deal with rJava??

I'd like your opinion on the following:

tmap requires OpenStreetMap -> rJava -> Java. The installation of Java is often a pain in the a**. For Windows, the 32 bit version of Java is typically installed, which does not work with 64bit R. For Ubuntu, I didn't manage to get openjdk to work with rJava. There are some stackoverflow posts on this topic, but they are often outdated and not always generic. In the end, I succeeded with the oracle version of Java.

Possible options:

  • Leave it as it is, so users will have to install rJava.
  • Create another package with the OSM functionality, so users can easily install the base tmap package.
  • Is it possible to show some kind of installation instructions, such as "For Windows, please install 32 or 64 bit Java depending on your current Windows configuration." Ideally, these instruction should show up via something like onLoad (onInstall does not exist:)).
  • Any other ideas?

Color schemes

New: color schemes! See cd926cd, https://github.com/mtennekes/tmap/blob/master/pkg/R/tm_layout.R#L111-L150, and https://github.com/mtennekes/tmap/blob/master/examples/tm_layout.R#47-L77 Thanks to @sjewo for the original idea of changing the font colors (see https://github.com/mtennekes/tmap/issues/33).

Now the default color values are configured in tm_layout, rather than hard-coded.

As for the default settings: I changed the bg.color back to light grey, since the quantitative color palettes are more clear that way. I started three other color schemes, of which two are based on latex beamer themes.

Your input on is more than welcome. So if you would like to change a color (palette), or add a new color scheme, please feel free to do so. I'm especially struggling with the quantitative brewer palettes with dark backgrounds and light text colors (such as cobalt). Maybe we'll have to use non-ColorBrewer palettes.

I am also thinking about adding a global option "tmap_colors", which configures the default color scheme for all tmap plots. The same can be done with tm_style by the way. The advantage is that you don't have to call tm_colors_XXX every time, which can be annoying, especially with qtm plots.

This is probably the last major update before the next CRAN version (in a couple of weeks).

Error with type = "osm-bw"

This errors:

b <- bb("Hereford")
hf <- read_osm(x = b, minNumTiles = 5, type = "osm-bw")

This is OK though:

b <- bb("Hereford")
hf <- read_osm(x = b, minNumTiles = 5, type = "osm")

Same problem if you replace Hereford with New York.

Error message:

java.lang.NullPointerException
    at edu.cens.spatial.RTileController.getTileValues(RTileController.java:117)
    at sun.reflect.GeneratedMethodAccessor4.invoke(Unknown Source)
    at sun.reflect.DelegatingMethodAccessorImpl.invoke(DelegatingMethodAccessorImpl.java:43)
    at java.lang.reflect.Method.invoke(Method.java:606)
    at RJavaTools.invokeMethod(RJavaTools.java:386)
Error in osmtile(x, y, zoom, type) : could not obtain tile: 300 384 10

tmap does not draw some polygons

I've encountered a very weird bug which I cannot wrap my head around. Since I'm not sure how to make it reproducible, I've put my test dataset here: https://www.dropbox.com/s/vzi6kfrqg0qu2up/test.Rdata?dl=0

The weird thing is that tmapseems to plot some polygons as if they were missing values, even though they're not. Consider:

downloader::download("https://www.dropbox.com/s/vzi6kfrqg0qu2up/test.Rdata?dl=1", destfile = "./test.Rdata", mode = "wb")
load("./test.Rdata")
summary(test@data$testvar)
#>    Mode   FALSE    TRUE    NA's 
#> logical    1581     870       0
library(tmap)
tm_shape(test, bbox = bb(test[test@data$cantville %in% "1399",]), ext = 1.2) + tm_borders() # no problem

tm_shape(test, bbox = bb(test[test@data$cantville %in% "1399",]), ext = 1.2) + tm_fill(col = "testvar") # problem

So here we have weird grey polygons, even though there are no missing values in the variable plotted.

Also, it works fine with the cartography package:

load("./test.Rdata")
library(cartography)
layoutLayer(extent = test[test@data$cantville %in% "1399",])
typoLayer(test, test@data, var = "testvar", border = "transparent", add = TRUE)

@mtennekes, any idea what's going on here?

Several maps within the same layout

Dear Martijn,

Congratulations on the great work done on tmap!

I found your library very useful and flexible enough to produce great maps. I have recently developed a shiny app based on tmap (https://github.com/Arevaju/mapping-tool). I was wondering if there is a simple way to include two maps within the same layout map such in the image attached (Malta and Cyprus boxes) :
eruope_map

Any ideas on how this could be addressed?

Thanks for your help.

Make `lwd` (and `lty`?) an aesthetic?

I wonder whether it could be interesting and possible to make lwd (and possibly lty) an aesthetic in tm_borders. This would allow to make things like, e.g., discontinuities mapping (I'm not sure what the exact English term for that is). The difficulty however is that we would need a dataframe with one row per border, which usually doesn't come with a SpatialPolygons*. Or should we only use computed variables, such as in discontinuities mapping? But in that case we don't have values for external borders...

What do you think? For what it's worth, the cartography package has a discontinuity mapping function: https://github.com/Groupe-ElementR/cartography/blob/master/R/discLayer.R

shell vs system in animation_tmap

Hi Martijn,

wow, really impressed of your new package, another great one like treemap.

I've rushed head-in to the animation, but when I run the examples from the documentation, I get the following error, using animation_tmap()

Error in animation_tmap({ : could not find function "shell"

From what I understand from https://stat.ethz.ch/R-manual/R-devel/library/base/html/system.html system is the actual function, although shell is directly used under Windows. Just to see if it worked, I replaced 'shell' with 'system'. Then the function starts, but I think later on there is another function call to 'shell' as the error is repeated. See here the function and output:

animation_tmap2 <- function (expr, width = 1000, height = 1000, delay = 40, filename = "animation.gif")

  • {
  • checkIM <- system("convert -version")
    
  • if (checkIM != 0) 
    
  •     stop("Could not find ImageMagick. Make sure it is installed and included in the systems PATH")
    
  • d <- paste(tempdir(), "/tmap_plots", sep = "/")
    
  • dir.create(d)
    
  • png(filename = paste(d, "plot%03d.png", sep = "/"), width = width, 
    
  •     height = height)
    
  • print(expr)
    
  • dev.off()
    
  • output <- shell(paste("convert -delay ", delay, " ", d, "/*.png \"", 
    
  •                       filename, "\"", sep = ""))
    
  • unlink(d, recursive = TRUE)
    
  • invisible()
    
  • }
    animation_tmap2({
  • tm_shape(Europe) +
    
  •     tm_fill("yellow") +
    
  •     tm_borders() +
    
  •     tm_facets(by = "name", nrow=1,ncol=1) +
    
  •     tm_layout(scale=2)
    
  • }, width=1200, height=800, delay=100, filename="European countries.gif")
    Version: ImageMagick 6.9.0-0 Q16 x86_64 2014-12-14 http://www.imagemagick.org
    Copyright: Copyright (C) 1999-2014 ImageMagick Studio LLC
    Features: DPC Modules
    Delegates (built-in): bzlib djvu fftw fontconfig freetype gslib jbig jng jp2 jpeg lcms ltdl lzma openexr png ps tiff webp x xml zlib

Error in animation_tmap2({ : could not find function "shell"

Annotation problem with tm_credits and legend.outside

Hi Martijn,

there is a little problem while using tm_credits together with factes and legend.outside=T (cran version 1.4). The first label with be reused in the plot area holding the legend (this this example)

library(tmap)
data(NLD_muni, NLD_prov)

NLD_prov$region <- c(1,1,1,1,2,2,2,2,2,3,3,3)

# legend outside
tm_shape(NLD_prov) +
    tm_fill("population", style="quantile") + tm_borders() +
    tm_facets(by="region", free.coords = TRUE, drop.units=TRUE) +
    tm_layout(outer.margins = 0, asp=0, legend.outside=T) + 
  tm_credits(c("north", "central", "south"), size=2)

# legend inside
tm_shape(NLD_prov) +
    tm_fill("population", style="quantile") + tm_borders() +
    tm_facets(by="region", free.coords = TRUE, drop.units=TRUE) +
    tm_layout(outer.margins = 0, asp=0, legend.outside=F) + 
  tm_credits(c("north", "central", "south"), size=2)

Fill polygons with pattern instead of color

I would lik to make layers like this:

https://www.google.it/url?sa=i&rct=j&q=&esrc=s&source=images&cd=&cad=rja&uact=8&ved=0ahUKEwjt9Nn015DLAhVLnRoKHePnAoMQjRwIBw&url=http%3A%2F%2Fstackoverflow.com%2Fquestions%2F21677489%2Ffill-geospatial-polygons-with-pattern-r&psig=AFQjCNEuKaSmbfZl5kI97ll5z26jhPYvbQ&ust=1456413141848808

So patterns instead of colors.
I believe this is currently not possible.

I can do those with plot(spdf, density = ...), but I did not manage to overlay this plot over the tmap layers. Is there a wy to do this ?

Add bar and pie chart to choropleth map

Would be great if bar and pie charts per area unit could be added to the thematic map, like here:
[http://www.qgis.nl/media/2012/05/ArtikelStaafdiagram05.png](like this)

Preferrably, the bar charts would be added from a list of plots that were created by ggplot2 and the plotlist names identify to which area the bar chart belongs. The bar charts are then added to the centroids of the area unit.

tm_facets(...,drop.shapes=T) does not work unless free.coords = T

Before digging into the code, I wanted to make sure that I am not just confused. Using the example provided in tmap.R, I get the result I would expect.

# Small multiples choropleth
tm_shape(NLD_muni) +
    tm_borders() +
    tm_facets(by="province") +
    tm_fill("population", style="kmeans", convert2density = TRUE) +
tm_shape(NLD_prov) +
    tm_borders(lwd=4) +
    tm_facets(by="name", free.coords=TRUE, drop.shapes=TRUE) +
tm_layout(legend.show = FALSE)

image

However, currently drop.shapes=TRUE seems to also require free.coords=TRUE, since removing the free.coords=TRUE leads to a result that I would not expect.

tm_shape(NLD_muni) +
    tm_borders() +
    tm_facets(by="province") +
    tm_fill("population", style="kmeans", convert2density = TRUE) +
    tm_shape(NLD_prov) +
    tm_borders(lwd=4) +
    tm_facets(by="name", drop.shapes=TRUE) +
    tm_layout(legend.show = FALSE)

image

Cannot plot Worldpop raster "replacement has 1 row, data has 0"

Hi,
I'm getting a weird error trying to draw a simple raster plot of the poverty map at http://www.worldpop.org.uk/data/summary/?contselect=Africa&countselect=Nigeria&typeselect=Poverty

wpov <- raster("./maps/worldpop/nga10povcons200.tif")
summary(wpov)
#         nga10povcons200
# Min.          0.0000000
# 1st Qu.       0.7974457
# Median        0.8434654
# 3rd Qu.       0.8775278
# Max.          0.9563288
# NA's          0.0000000

tm_shape(wpov) + tm_raster("nga10povcons200")
# Error in `$<-.data.frame`(`*tmp*`, "GROUP_BY", value = 1L) : 
#   replacement has 1 row, data has 0

On the other hand I can plot using spplot(wpov) no problem.

Here is a session dump.

R version 3.2.1 (2015-06-18)
Platform: x86_64-w64-mingw32/x64 (64-bit)
Running under: Windows 7 x64 (build 7601) Service Pack 1

locale:
[1] LC_COLLATE=English_United States.1252  LC_CTYPE=English_United States.1252   
[3] LC_MONETARY=English_United States.1252 LC_NUMERIC=C                          
[5] LC_TIME=English_United States.1252    

attached base packages:
[1] stats     graphics  grDevices utils     datasets  methods   base     

other attached packages:
 [1] RColorBrewer_1.1-2 raster_2.4-18      httr_1.0.0         ggplot2_1.0.1     
 [5] tmap_1.0           rgdal_1.0-4        maptools_0.8-36    sp_1.1-1          
 [9] data.table_1.9.4   rj_2.0.4-2        

loaded via a namespace (and not attached):
 [1] Rcpp_0.12.0      magrittr_1.5     MASS_7.3-43      munsell_0.4.2   
 [5] rj.gd_2.0.0-1    colorspace_1.2-6 gridBase_0.4-7   lattice_0.20-33 
 [9] R6_2.1.0         stringr_1.0.0    plyr_1.8.3       tools_3.2.1     
[13] grid_3.2.1       gtable_0.1.2     e1071_1.6-7      rgeos_0.3-11    
[17] class_7.3-13     digest_0.6.8     reshape2_1.4.1   curl_0.9.2      
[21] stringi_0.5-5    scales_0.2.5     classInt_0.1-22  jsonlite_0.9.16 
[25] foreign_0.8-65   chron_2.3-47     proto_0.3-10 

Thx! --Mel.

Recommend Projects

  • React photo React

    A declarative, efficient, and flexible JavaScript library for building user interfaces.

  • Vue.js photo Vue.js

    ๐Ÿ–– Vue.js is a progressive, incrementally-adoptable JavaScript framework for building UI on the web.

  • Typescript photo Typescript

    TypeScript is a superset of JavaScript that compiles to clean JavaScript output.

  • TensorFlow photo TensorFlow

    An Open Source Machine Learning Framework for Everyone

  • Django photo Django

    The Web framework for perfectionists with deadlines.

  • D3 photo D3

    Bring data to life with SVG, Canvas and HTML. ๐Ÿ“Š๐Ÿ“ˆ๐ŸŽ‰

Recommend Topics

  • javascript

    JavaScript (JS) is a lightweight interpreted programming language with first-class functions.

  • web

    Some thing interesting about web. New door for the world.

  • server

    A server is a program made to process requests and deliver data to clients.

  • Machine learning

    Machine learning is a way of modeling and interpreting data that allows a piece of software to respond intelligently.

  • Game

    Some thing interesting about game, make everyone happy.

Recommend Org

  • Facebook photo Facebook

    We are working to build community through open source technology. NB: members must have two-factor auth.

  • Microsoft photo Microsoft

    Open source projects and samples from Microsoft.

  • Google photo Google

    Google โค๏ธ Open Source for everyone.

  • D3 photo D3

    Data-Driven Documents codes.