pysdr / pysdr Goto Github PK
View Code? Open in Web Editor NEWA guide for using Python as a software-defined radio (SDR) framework, for extremely rapid development of SDR apps/research with beautiful GUIs
A guide for using Python as a software-defined radio (SDR) framework, for extremely rapid development of SDR apps/research with beautiful GUIs


I am trying to transmit and receive sine signal using USRP B200. I have referred the codes provided in the chapter 6 of pySDR. However I am not able to capture sine wave. The receive samples do not show any connection with the transmitted signal. I am copying the codes here.
########################
########################
import uhd
import numpy as np
import time as tim
usrp = uhd.usrp.MultiUSRP()
duration = 30 # seconds
center_freq = 900e6
sample_rate = 1e6
gain = 20 # [dB] start low then work your way up
time = np.arange(0, duration, 1/sample_rate);# create sampling instances
samples = np.sin(time)
usrp.send_waveform(samples, duration, center_freq, sample_rate, [0], gain)
########################
########################
import uhd
import numpy as np
import matplotlib.pyplot as plt
usrp = uhd.usrp.MultiUSRP()
center_freq = 900e6 # Hz
sample_rate = 1e6 # Hz
gain = 10 # dB
usrp.set_rx_rate(sample_rate, 0)
usrp.set_rx_freq(uhd.libpyuhd.types.tune_request(center_freq), 0)
usrp.set_rx_gain(gain, 0)
usrp.set_rx_agc(True, 0)
st_args = uhd.usrp.StreamArgs("fc32", "sc16")
st_args.channels = [0]
metadata = uhd.types.RXMetadata()
streamer = usrp.get_rx_stream(st_args)
recv_buffer = np.zeros((1, 1000), dtype=np.complex64)
stream_cmd = uhd.types.StreamCMD(uhd.types.StreamMode.start_cont)
stream_cmd.stream_now = True
streamer.issue_stream_cmd(stream_cmd)
duration = 20 # seconds
t_n = np.arange(0, duration, 1/sample_rate);# time axis
num_samps=len(t_n)
samples = np.zeros(num_samps, dtype=np.complex64)
for i in range(num_samps//1000):
streamer.recv(recv_buffer, metadata)
data=recv_buffer[0]
samples[i*1000:(i+1)*1000] = data
stream_cmd = uhd.types.StreamCMD(uhd.types.StreamMode.stop_cont)
streamer.issue_stream_cmd(stream_cmd)
print(len(samples))
print(samples[0:10])
plt.plot(t_n, np.real(samples),'')
plt.show()
The black text on top of the blue lines is almost invisible in the ISI plot in 13. Plot Shaping:
The labels could be made clear by shifting their y-position downward, or by changing the color of either the lines (e.g. to cyan instead of blue) or the text (e.g. red instead of black.)
pyqt5 will only support a max python version of 3.6 which was EOL 23DEC2021 and is going to be removed. I don't see how this will continue to work without a lot of manual work.

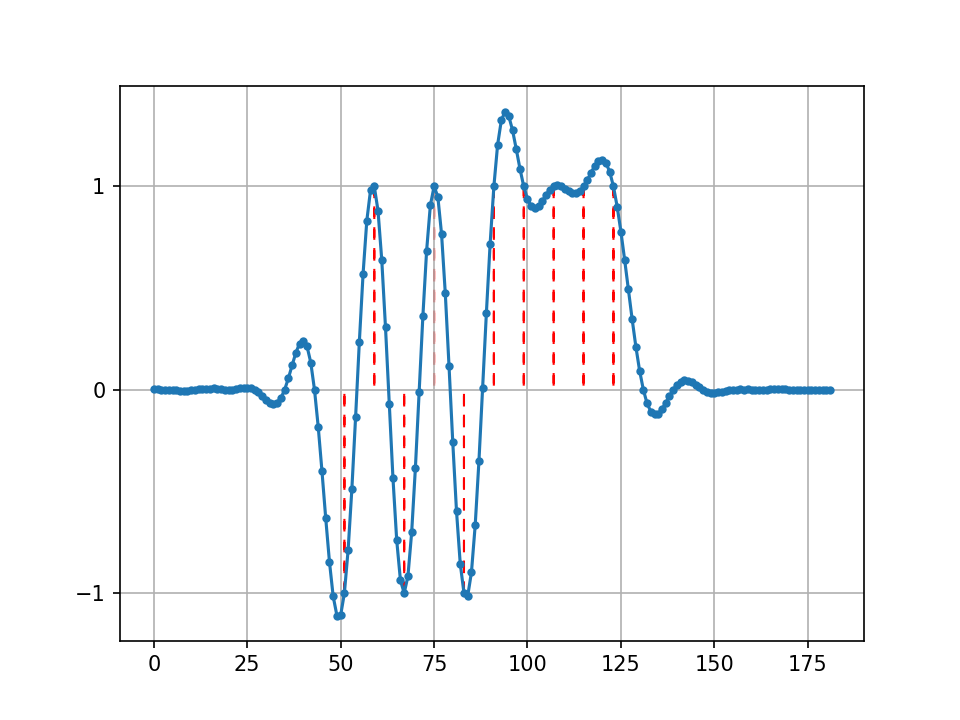
The current plot pulse-shaped plot generated in the python exercise uses 'grid' to provide reference lines:
But it would be visually helpful to emphasize the y=+1 and y=-1 lines to make it easier to note that the plotted curve has value +1 or -1 at integer values of t, and if the vertical lines went from 0 to +1 or -1, for example:
from email.base64mime import header_length
import numpy as np
import matplotlib.pyplot as plt
from scipy import signal

num_symbols = 10
sps = 8

bits = np.random.randint(0, 2, num_symbols) # Our data to be transmitted, 1's and 0's

x = np.array([])
for bit in bits:
    pulse = np.zeros(sps)
    pulse[0] = bit*2-1 # set the first value to either a 1 or -1
    x = np.concatenate((x, pulse)) # add the 8 samples to the signal

# Create our raised-cosine filter
num_taps = 101
beta = 0.35
Ts = sps # Assume sample rate is 1 Hz, so sample period is 1, so *symbol* period is 8
t = np.arange(-51, 52) # remember it's not inclusive of final number
h = np.sinc(t/Ts) * np.cos(np.pi*beta*t/Ts) / (1 - (2*beta*t/Ts)**2)

# Filter our signal, in order to apply the pulse shaping
x_shaped = np.convolve(x, h)
fig, ax = plt.subplots()
plt.plot(x_shaped, '.-')
for i in range(num_symbols):
    xpos = i*sps+num_taps//2+1
    ypos = x_shaped[xpos]
    plt.arrow(
        x=xpos, y=0, dx=0, dy=ypos,
        color="red",
        ls=(0, (5, 5))
        )
plt.grid(True)
ax.set_yticks([-1, 0, +1], minor=False)
plt.savefig("pulse_shaping_python3_grw.png", format="png", dpi=150   )
yields
A declarative, efficient, and flexible JavaScript library for building user interfaces.
🖖 Vue.js is a progressive, incrementally-adoptable JavaScript framework for building UI on the web.
TypeScript is a superset of JavaScript that compiles to clean JavaScript output.
An Open Source Machine Learning Framework for Everyone
The Web framework for perfectionists with deadlines.
A PHP framework for web artisans
Bring data to life with SVG, Canvas and HTML. 📊📈🎉
JavaScript (JS) is a lightweight interpreted programming language with first-class functions.
Some thing interesting about web. New door for the world.
A server is a program made to process requests and deliver data to clients.
Machine learning is a way of modeling and interpreting data that allows a piece of software to respond intelligently.
Some thing interesting about visualization, use data art
Some thing interesting about game, make everyone happy.
We are working to build community through open source technology. NB: members must have two-factor auth.
Open source projects and samples from Microsoft.
Google ❤️ Open Source for everyone.
Alibaba Open Source for everyone
Data-Driven Documents codes.
China tencent open source team.

