For a tutorial and usage overview, take a look at the Vimspector website.
For detailed explanation of the .vimspector.json format, see the
reference guide.
![]()


- Features and Usage
- Installation
- About
- What Vimspector is not
- Mappings
- Usage and API
- Multiple debugging sessions
- Debug profile configuration
- Customisation
- FAQ
The plugin is a capable Vim graphical debugger for multiple languages. It's mostly tested for C++, Python and TCL, but in theory supports any language that Visual Studio Code supports (but see caveats).
The Vimspector website has an overview of the UI, along with basic instructions for configuration and setup.
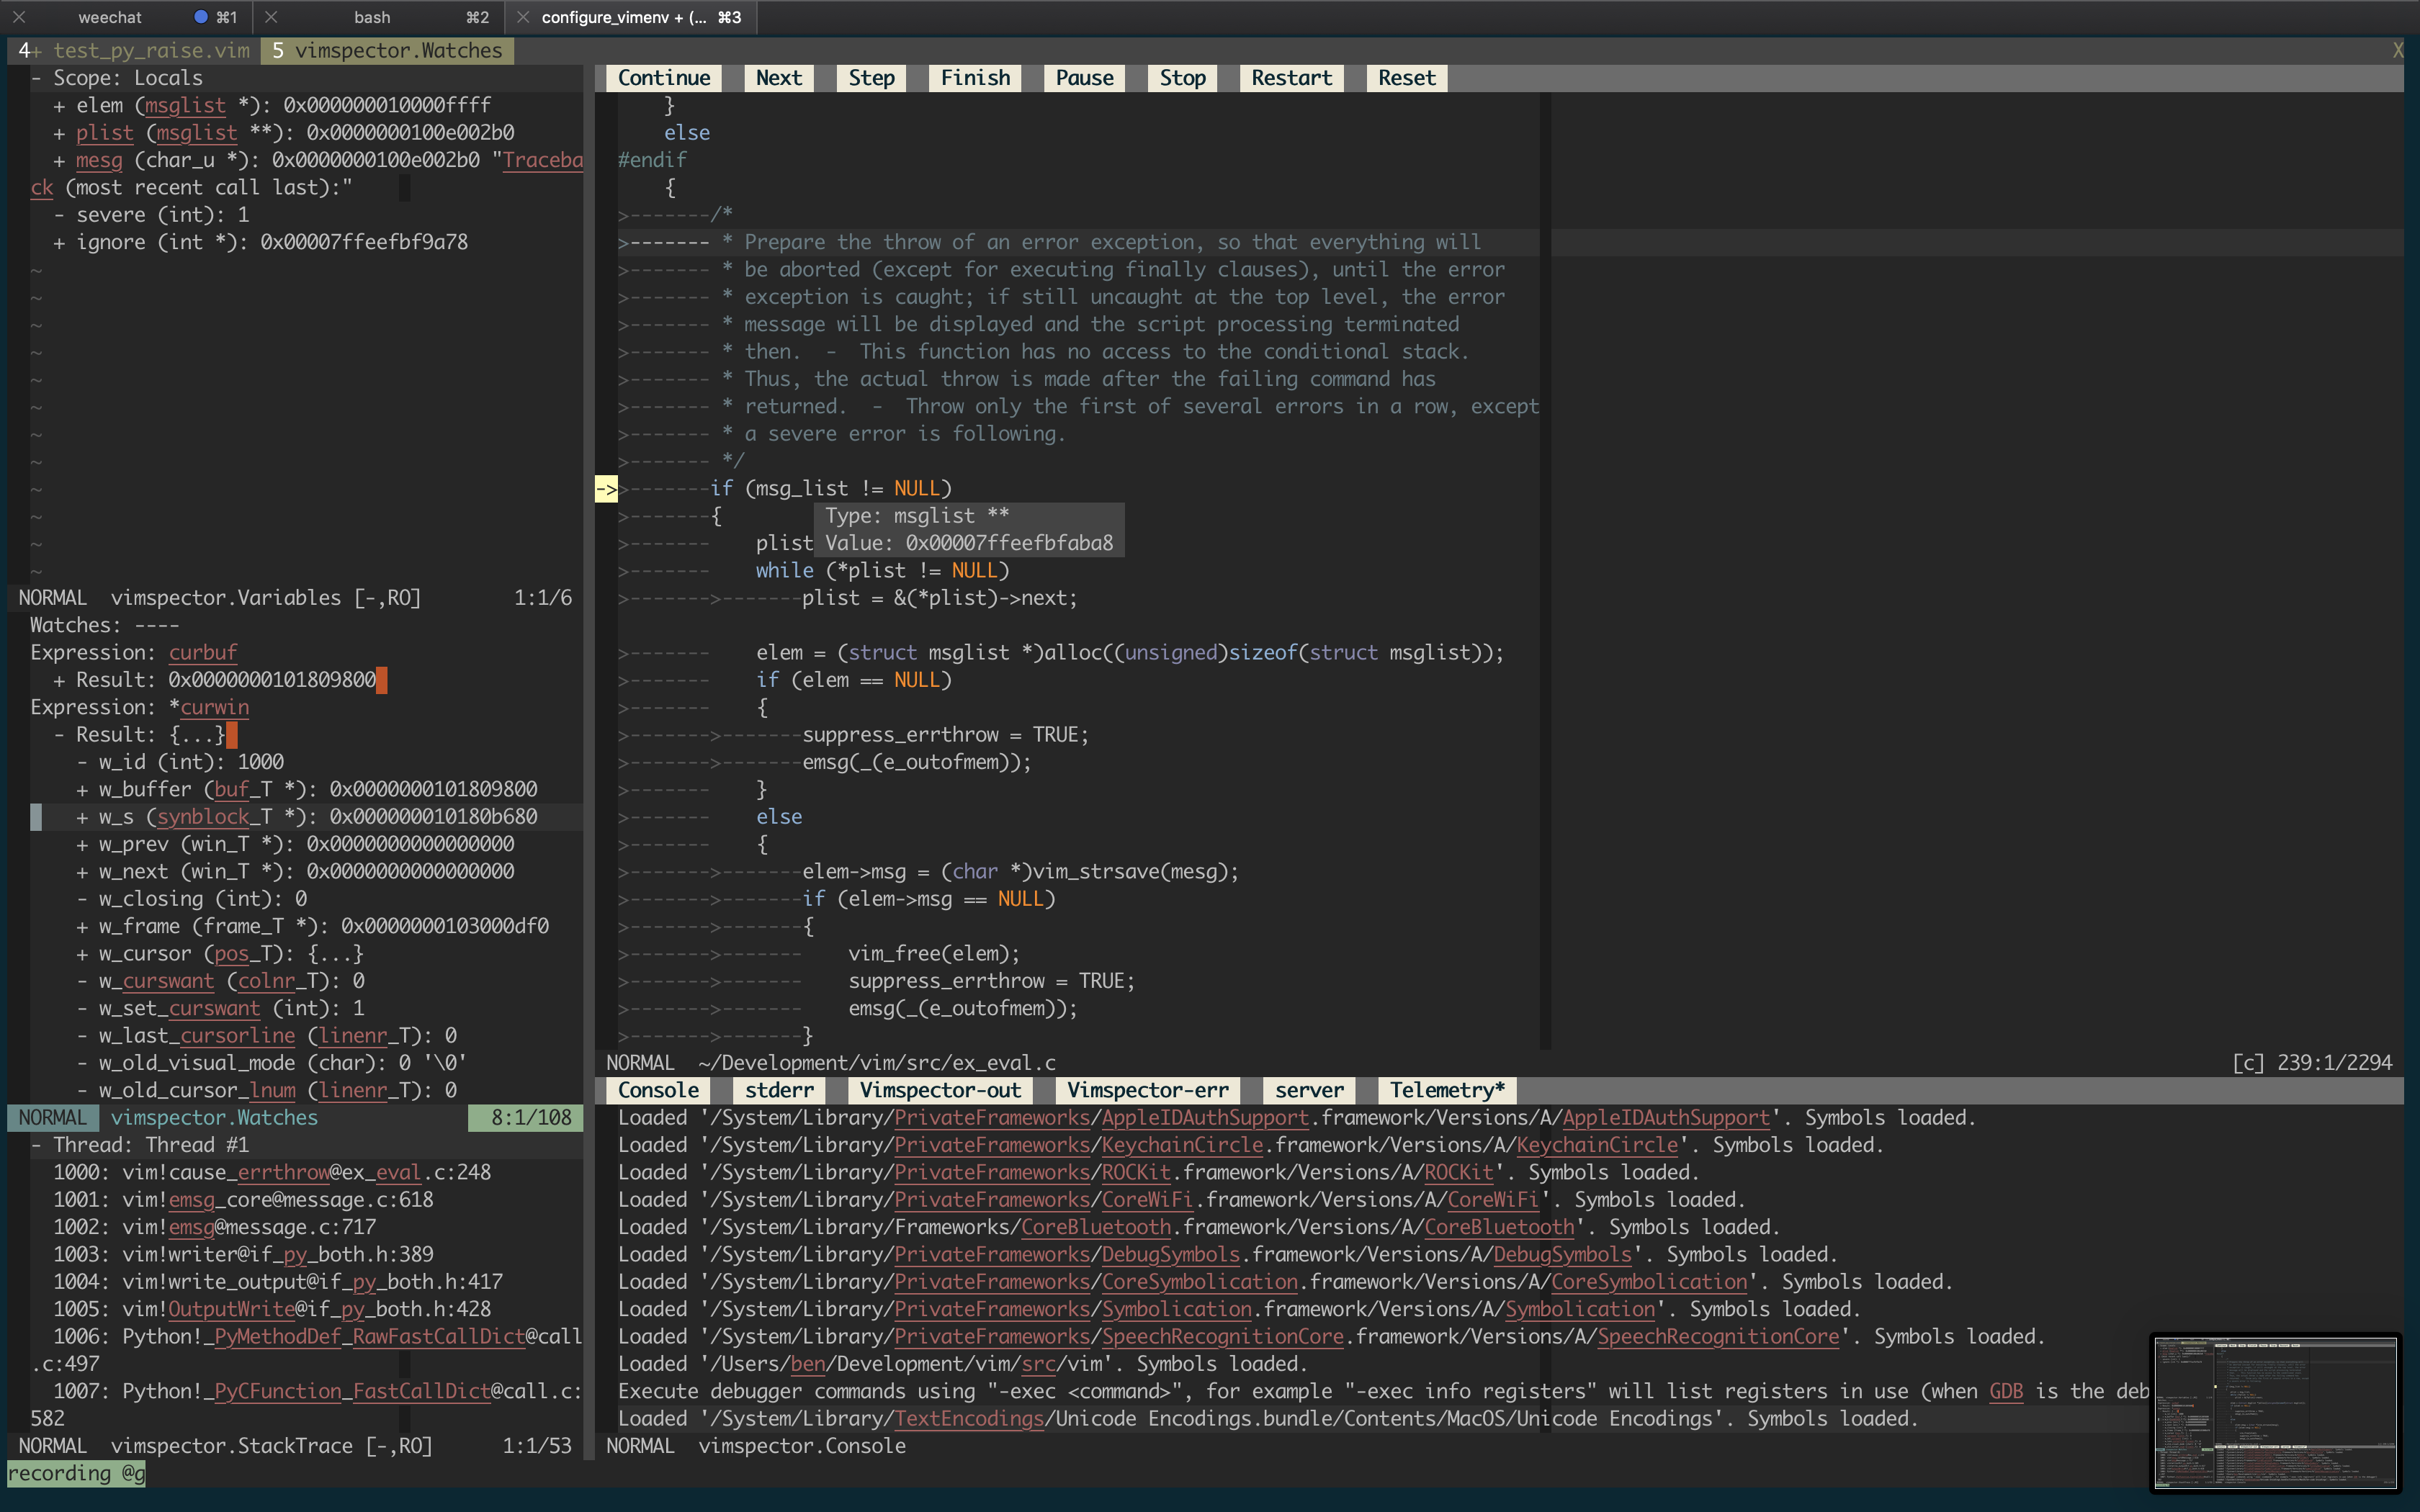
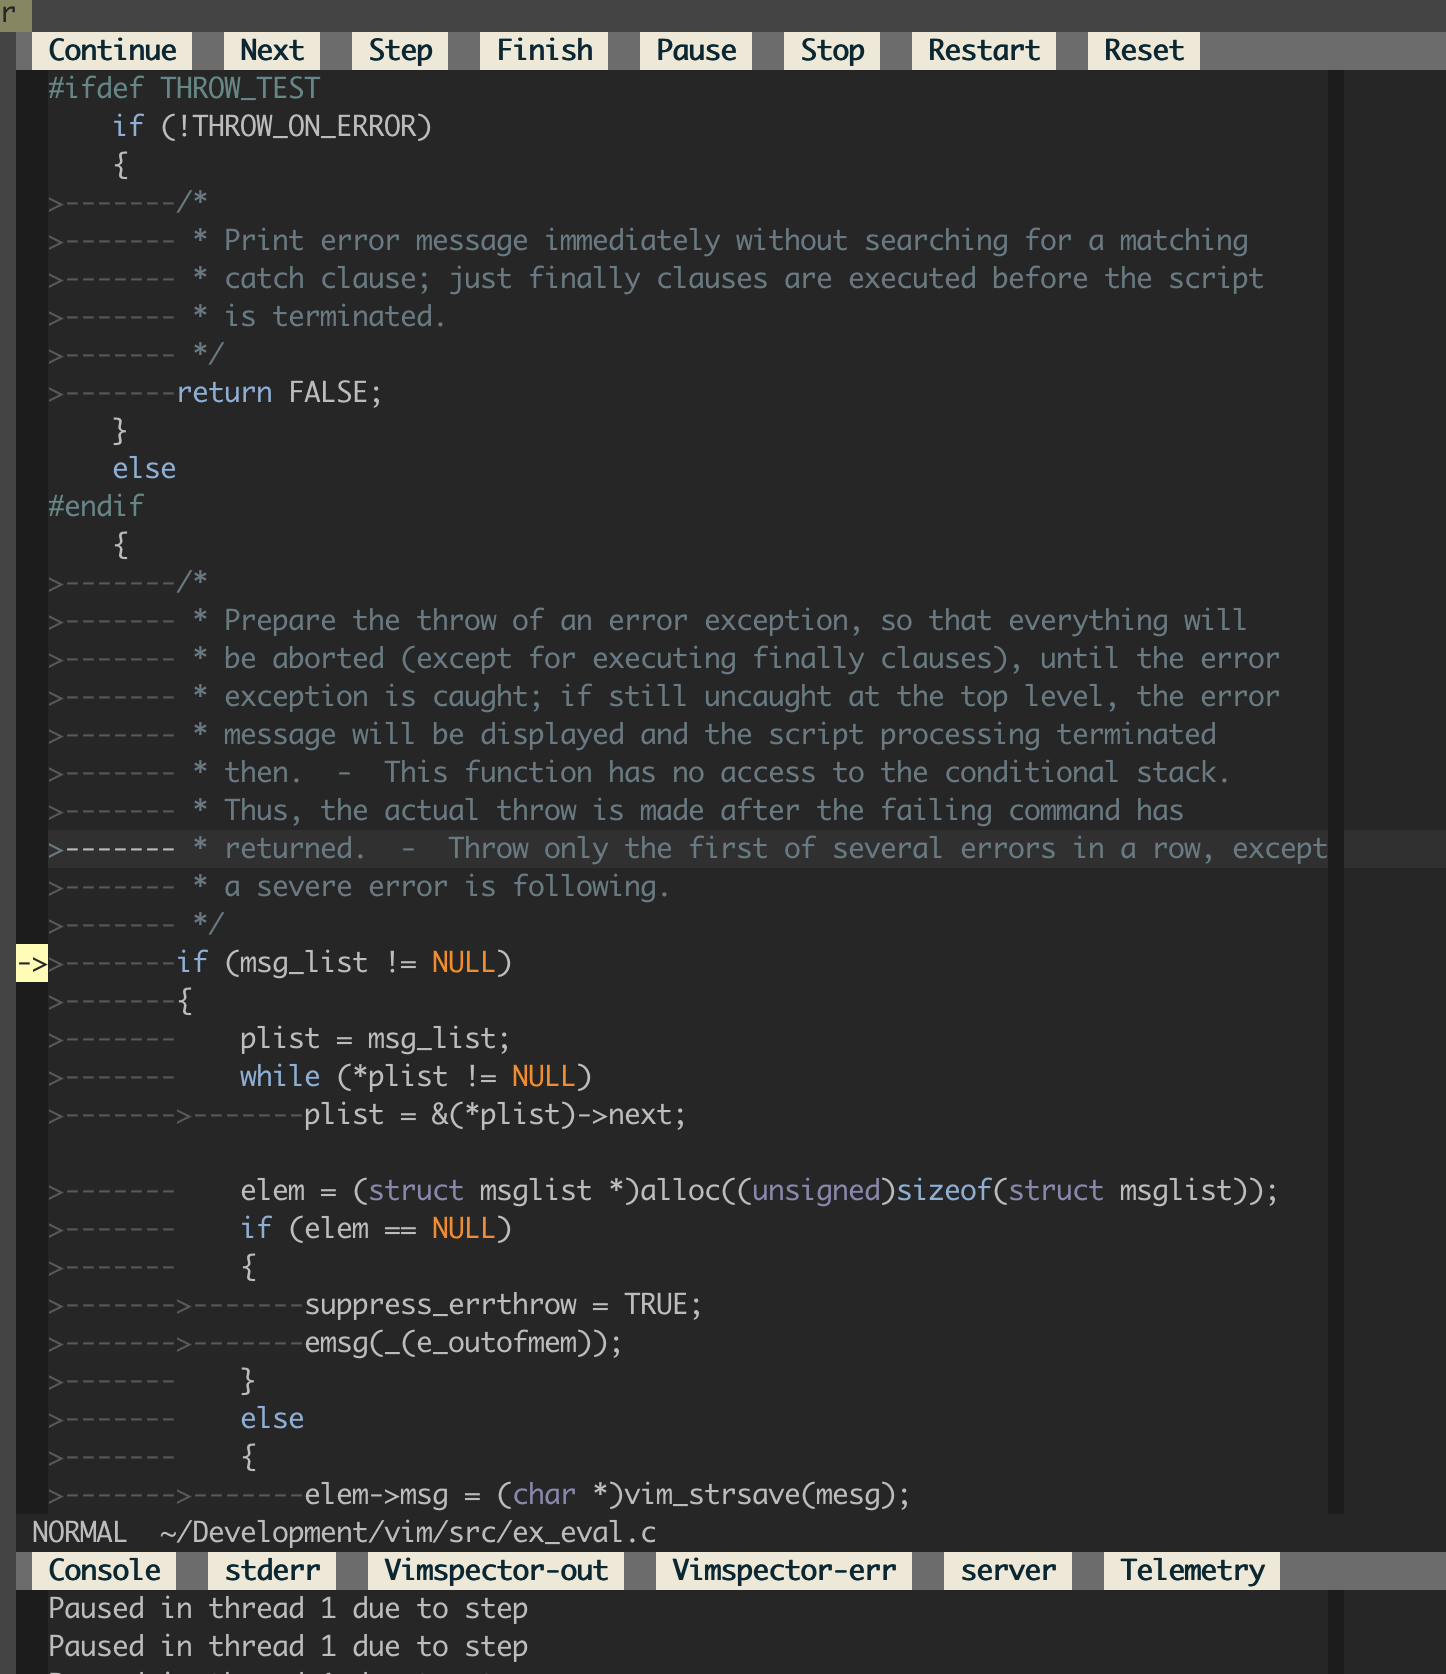
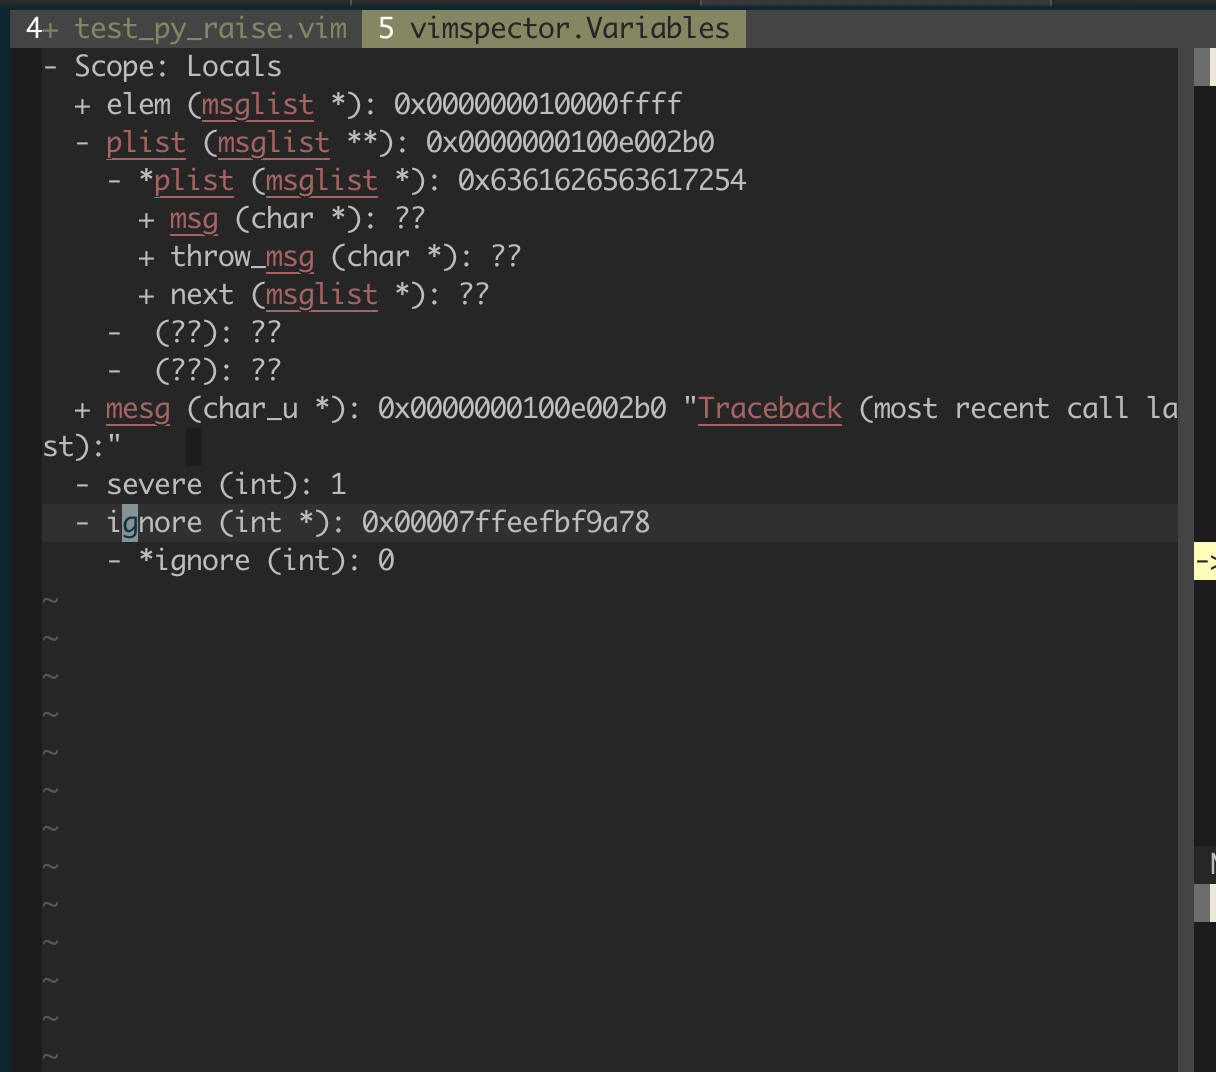
But for now, here's a (rather old) screenshot of Vimspector debugging Vim:
And a couple of brief demos:


- flexible configuration syntax that can be checked in to source control
- breakpoints (function, line and exception breakpoints)
- conditional breakpoints (function, line)
- step in/out/over/up, stop, restart
- run to cursor
- go to line (reset program counter to line)
- launch and attach, including PID picker
- remote launch, remote attach
- locals and globals display
- watch expressions with autocompletion
- variable inspection tooltip on hover
- disassembly view and step-by-instruction
- set variable value in locals, watch and hover windows
- call stack display and navigation
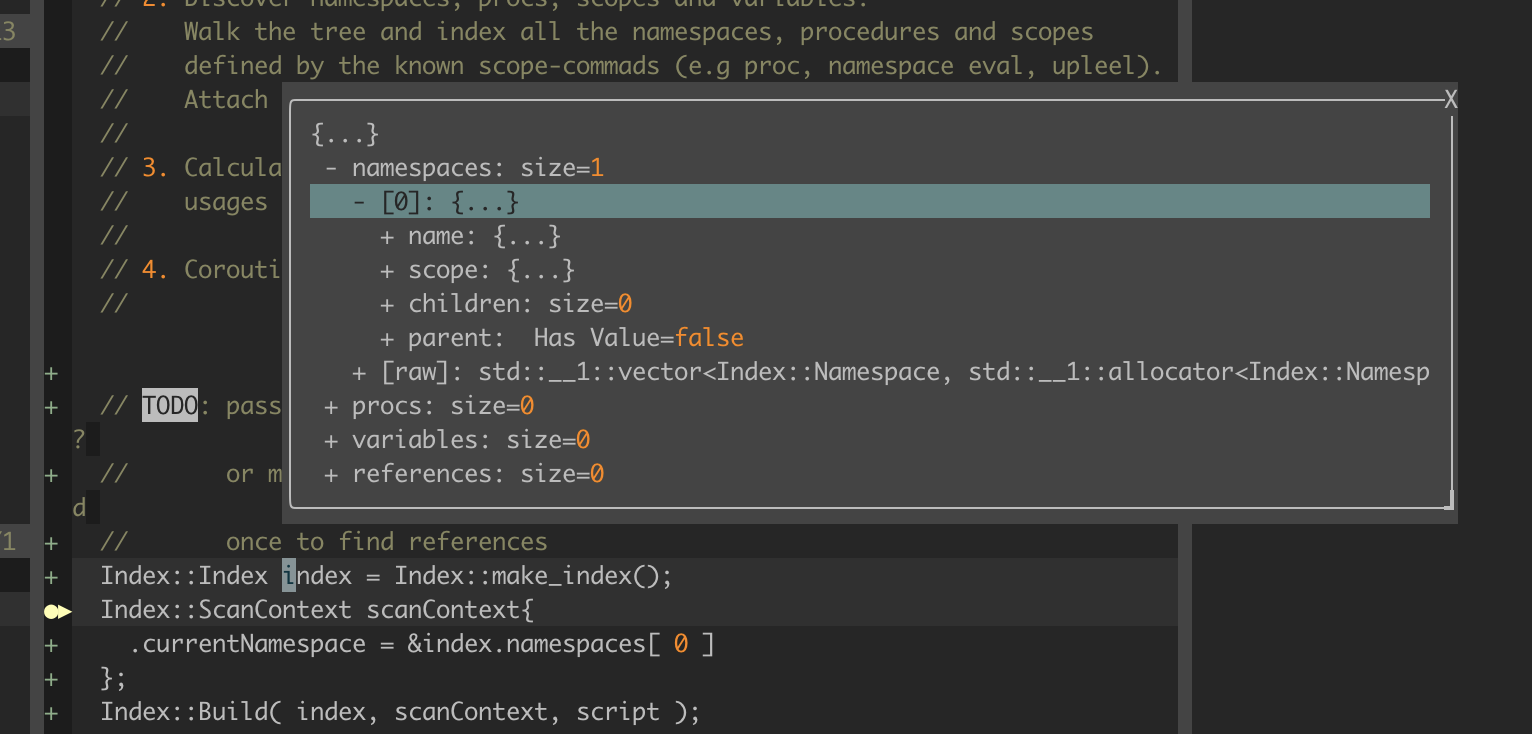
- hierarchical variable value display popup (see
<Plug>VimspectorBalloonEval) - interactive debug console with autocompletion
- launch debuggee within Vim's embedded terminal
- logging/stdout display
- simple stable API for custom tooling (e.g. integrate with language server)
- view hex dump of process memory
- multiple independent debugging sessions (debug different apps in tabs)
- multi-process (multi-session) debugging
The following table lists the languages that are "built-in" (along with their runtime dependencies). They are categorised by their level of support:
Tested: Fully supported, Vimspector regression tests cover themSupported: Fully supported, frequently used and manually testedExperimental: Working, but not frequently used and rarely testedLegacy: No longer supported, please migrate your configRetired: No longer included or supported.
| Language(s) | Status | Switch (for install_gadget.py) |
Adapter (for :VimspectorInstall) |
Dependencies |
|---|---|---|---|---|
| C, C++, Rust, Jai, etc. | Tested | --all or --enable-c (or cpp) |
vscode-cpptools | mono-core |
| C, C++, Rust, Jai, etc. | Tested | --enable-rust, --enable-c, etc. |
CodeLLDB | none |
| Python | Tested | --all or --enable-python |
debugpy | Python 3 |
| Go | Tested | --enable-go |
delve | Go 1.16+ |
| TCL | Supported | --all or --enable-tcl |
tclpro | TCL 8.5 |
| Bourne Shell | Supported | --all or --enable-bash |
vscode-bash-debug | Bash v?? |
| Lua | Tested | --all or --enable-lua |
local-lua-debugger-vscode | Node >=12.13.0, Npm, Lua interpreter |
| Node.js | Supported | --force-enable-node |
vscode-js-debug | Node >= 18 |
| Node.js (legacy) | Supported | --force-enable-node_legacy |
vscode-node-debug2 | 6 < Node < 12, Npm |
| Javascript | Supported | --force-enable-chrome |
debugger-for-chrome | Chrome |
| Javascript | Supported | --force-enable-firefox |
vscode-firefox-debug | Firefox |
| Java | Supported | --force-enable-java |
vscode-java-debug | Compatible LSP plugin (see later) |
| PHP | Experimental | --force-enable-php |
vscode-php-debug | Node, PHP, XDEBUG |
| C# (dotnet core) | Tested | --force-enable-csharp |
netcoredbg | DotNet core |
| F#, VB, etc. | Supported | --force-enable-[fsharp,vbnet] |
netcoredbg | DotNet core |
| Go (legacy) | Legacy | --enable-go |
vscode-go | Node, Go, Delve |
| Python 2 | Legacy | --force-enable-python2 |
debugpy-python2 | Python 2.7 |
Vimspector should work for any debug adapter that works in Visual Studio Code.
To use Vimspector with a language that's not "built-in", see this wiki page.
There are 3 installation methods:
- Using a release tarball and Vim packages
- Using a repo clone and Vim packages
- Using a plugin manager
Release tarballs come with debug adapters for the default languages pre-packaged. To use a release tarball:
-
Untar the release tarball for your OS into
$HOME/.vim/pack:$ mkdir -p $HOME/.vim/pack $ curl -L <url> | tar -C $HOME/.vim/pack zxvf -
-
Add
packadd! vimspectorto your.vimrc -
(optionally) Enable the default set of mappings:
let g:vimspector_enable_mappings = 'HUMAN'
-
Configure your project's debug profiles (create
.vimspector.json, or setg:vimspector_configurations) - see the reference guide
- Check the dependencies
- Install the plugin as a Vim package. See
:help packages. - Add
packadd! vimspectorto your.vimrc - Install some 'gadgets' (debug adapters) - see here for installation commands and select gadgets to install
- Configure your project's debug profiles (create
.vimspector.json, or setg:vimspector_configurations) - see the reference guide
-
See the plugin manager's docs and install the plugin
For Vundle, use:Plugin 'puremourning/vimspector'
-
Install some 'gadgets' (debug adapters) - see here for installation commands and select gadgets to install
-
Configure your project's debug profiles (create
.vimspector.json, or setg:vimspector_configurations) - see the reference guide
The following sections expand on the above brief overview.
Vimspector requires:
- One of:
- Vim 8.2.4797 or later "huge" build compiled with Python 3.10 or later
- Neovim 0.8 with Python 3.10 or later
- One of the following operating systems:
- Linux
- macOS Mojave or later
- Windows (experimental)
Which Linux versions? I only test on Ubuntu 20.04 and later and RHEL 7.
neovim doesn't implement mouse hover balloons. Instead there is the
<Plug>VimspectorBalloonEval mapping. There is no default mapping for this, so
I recommend something like this to get variable display in a popup:
" mnemonic 'di' = 'debug inspect' (pick your own, if you prefer!)

" for normal mode - the word under the cursor
nmap <Leader>di <Plug>VimspectorBalloonEval
" for visual mode, the visually selected text
xmap <Leader>di <Plug>VimspectorBalloonEvalThe following features are not implemented for Windows:
- Tailing the vimspector log in the Output Window.
If you just want to try out vimspector without changing your vim config, there
are example projects for a number of languages in support/test, including:
- Python (
support/test/python/simple_python) - Go (
support/test/go/hello_worldandsupport/test/go/name-starts-with-vowel) - Nodejs (
support/test/node/simple) - Chrome/Firefox (
support/test/web/) - etc.
To test one of these out, cd to the directory and run:
vim -Nu /path/to/vimspector/tests/vimrc --cmd "let g:vimspector_enable_mappings='HUMAN'"
Then press <F5>.
There's also a C++ project in tests/testdata/cpp/simple/ with a Makefile
which can be used to check everything is working. This is used by the regression
tests in CI so should always work, and is a good way to check if the problem is
your configuration rather than a bug.
If you're not using a release tarball, you'll need to clone this repo to the appropriate place.
- Clone the plugin
There are many Vim plugin managers, and I'm not going to state a particular preference, so if you choose to use one, follow the plugin manager's documentation. For example, for Vundle, use:
Plugin 'puremourning/vimspector'If you don't use a plugin manager already, install vimspector as a Vim package by cloning this repository into your package path, like this:
$ git clone https://github.com/puremourning/vimspector ~/.vim/pack/vimspector/opt/vimspector
- Configure vimspector in your
.vimrc, for example to enable the standard mappings:
let g:vimspector_enable_mappings = 'HUMAN'- Load vimspector at runtime. This can also be added to your
.vimrcafter configuring vimspector:
packadd! vimspector
See support/doc/example_vimrc.vim for a minimal example.
Vimspector is a generic client for Debug Adapters. Debug Adapters (referred to as 'gadgets' or 'adapters') are what actually do the work of talking to the real debuggers.
In order for Vimspector to be useful, you need to have some adapters installed.
There are a few ways to do this:
- If you downloaded a tarball, gadgets for main supported languages are already installed for you.
- Using
:VimspectorInstall <adapter> <args...>(use TABwildmenuto see the options, also accepts anyinstall_gadget.pyoption) - Using
python3 install_gadget.py <args>(use--helpto see all options) - Attempting to launch a debug configuration; if the configured adapter can't be found, vimspector will suggest installing one.
- Using
:VimspectorUpdateto install the latest supported versions of the gadgets.
Here's a demo of doing some installs and an upgrade:

Both install_gadget.py and :VimspectorInstall do the same set of things,
though the default behaviours are slightly different. For supported languages,
they will:
- Download the relevant debug adapter at a version that's been tested from the internet, either as a 'vsix' (Visusal Studio plugin), or clone from GitHub. If you're in a corporate environment and this is a problem, you may need to install the gadgets manually.
- Perform any necessary post-installation actions, such as:
- Building any binary components
- Ensuring scripts are executable, because the VSIX packages are usually broken in this regard.
- Set up the
gadgetDirsymlinks for the platform.
For example, to install the tested debug adapter for a language, run:
| To install | Script | Command |
|---|---|---|
<adapter> |
:VimspectorInstall <adapter> |
|
<adapter1>, <adapter2>, ... |
:VimspectorInstall <adapter1> <adapter2> ... |
|
<language> |
./install_gadget.py --enable-<language> ... |
:VimspectorInstall --enable-<language> ... |
| Supported adapters | ./install_gadget.py --all |
:VimspectorInstall --all |
| Supported adapters, but not TCL | ./install_gadget.py --all --disable-tcl |
:VimspectorInstall --all --disable-tcl |
| Supported and experimental adapters | ./install_gadget.py --all --force-all |
:VimspectorInstall --all |
| Adapter for specific debug config | Suggested by Vimspector when starting debugging |
:VimspectorInstall runs install_gadget.py in the background with some of
the options defaulted.
:VimspectorUpdate runs install_gadget.py to re-install (i.e. update) any
gadgets already installed in your .gadgets.json.
The output is minimal, to see the full output add --verbose to the command, as
in :VimspectorInstall --verbose ... or :VimspectorUpdate --verbose ....
If the installation is successful, the output window is closed (and the output
lost forever). Use a ! to keep it open (e.g. :VimspectorInstall! --verbose --all or :VimspectorUpdate! (etc.).
If you know in advance which gadgets you want to install, for example so that
you can reproduce your config from source control, you can set
g:vimspector_install_gadgets to a list of gadgets. This will be used when:
- Running
:VimspectorInstallwith no arguments, or - Running
:VimspectorUpdate
For example:
let g:vimspector_install_gadgets = [ 'debugpy', 'vscode-cpptools', 'CodeLLDB' ]By default install_gadget.py will overwrite your .gadgets.json with the set
of adapters just installed, whereas :VimspectorInstall will update it,
overwriting only newly changed or installed adapters.
If you want to just add a new adapter using the script without destroying the
existing ones, add --update-gadget-config, as in:
$ ./install_gadget.py --enable-tcl
$ ./install_gadget.py --enable-rust --update-gadget-config
$ ./install_gadget.py --enable-java --update-gadget-config
If you want to maintain configurations outside of the vimspector repository
(this can be useful if you have custom gadgets or global configurations),
you can tell the installer to use a different basedir, then set
g:vimspector_base_dir to point to that directory, for example:
$ ./install_gadget.py --basedir $HOME/.vim/vimspector-config --all --force-allThen add this to your .vimrc:
let g:vimspector_base_dir=expand( '$HOME/.vim/vimspector-config' )When using :VimspectorInstall, the g:vimspector_base_dir setting is
respected unless --basedir is manually added (not recommended).
See --help for more info on the various options.
If the language you want to debug is not in the supported list above, you can probably still make it work, but it's more effort.
You essentially need to get a working installation of the debug adapter, find
out how to start it, and configure that in an adapters entry in either your
.vimspector.json or in .gadgets.json or in g:vimspector_adapters.
The simplest way in practice is to install or start Visual Studio Code and use
its extension manager to install the relevant extension. You can then configure
the adapter manually in the adapters section of your .vimspector.json or in
a gadgets.json or in g:vimspector_adapters.
PRs are always welcome to add supported languages (which roughly translates to
updating python/vimspector/gadgets.py and testing it).
Vimspector uses the following directory by default to look for a file named
.gadgets.json: </path/to/vimspector>/gadgets/<os>.
This path is exposed as the vimspector variable ${gadgetDir}. This is useful
for configuring gadget command lines.
Where os is one of:
macoslinuxwindows(though note: Windows is not supported)
The format is the same as .vimspector.json, but only the adapters key is
used:
Example:
{
  "adapters": {
    "lldb-vscode": {
      "variables": {
        "LLVM": {
          "shell": "brew --prefix llvm"
        }
      },
      "attach": {
        "pidProperty": "pid",
        "pidSelect": "ask"
      },
      "command": [
        "${LLVM}/bin/lldb-vscode"
      ],
      "env": {
        "LLDB_LAUNCH_FLAG_LAUNCH_IN_TTY": "YES"
      },
      "name": "lldb"
    },
    "vscode-cpptools": {
      "attach": {
        "pidProperty": "processId",
        "pidSelect": "ask"
      },
      "command": [
        "${gadgetDir}/vscode-cpptools/debugAdapters/bin/OpenDebugAD7"
      ],
      "name": "cppdbg"
    }
  }
}
The gadget file is automatically written by install_gadget.py (or
:VimspectorInstall).
Vimspector will also load any files matching:
</path/to/vimspector>/gadgets/<os>/.gadgets.d/*.json. These have the same
format as .gadgets.json but are not overwritten when running
install_gadget.py.
After updating the Vimspector code (either via git pull or whatever package
manager), run :VimspectorUpdate to update any already-installed gadgets.
The motivation is that debugging in Vim is a pretty horrible experience, particularly if you use multiple languages. With pyclewn no more and the built-in termdebug plugin limited to gdb, I wanted to explore options.
While Language Server Protocol is well known, the Debug Adapter Protocol is less well known, but achieves a similar goal: language agnostic API abstracting debuggers from clients.
The aim of this project is to provide a simple but effective debugging experience in Vim for multiple languages, by leveraging the debug adapters that are being built for Visual Studio Code.
The ability to do remote debugging is a must. This is key to my workflow, so baking it in to the debugging experience is a top bill goal for the project. So vimspector has first-class support for executing programs remotely and attaching to them. This support is unique to vimspector and on top of (complementary to) any such support in actual debug adapters.
Vimspector is a vim UI on top of the Debug Adapter Protocol. It's intended to be high level and convenient for day-to-day debugging tasks.
Vimspector is not:
- a debugger! It's just the UI and some glue.
- fast. It's abstractions all the way down. If you want a fast, native debugger, there are other options.
- comprehensive. It's limited by DAP, and limited by my time. I implement the features I think most users will need, not every feature possible.
- for everyone. Vimspector intentionally provides a "one size fits all" UI and aproach. This means that it can only provide essential/basic debugging features for a given language. This makes it convenient for everyday usage, but not ideal for power users or those with very precise or specific requirements. See motivation for more info.
Vimspector is a work in progress, and any feedback/contributions are more than welcome.
The backlog can be viewed on Trello.
The plugin is currently experimental. That means that any part of it can (and probably will) change, including things like:
- breaking changes to the configuration
- keys, layout, functionality of the UI
However, I commit to only doing this in the most extreme cases and to announce such changes on Gitter well in advance. There's nothing more annoying than stuff just breaking on you. I get that.
A message from the author about the motivation for this plugin:
Many development environments have a built-in debugger. I spend an inordinate amount of my time in Vim. I do all my development in Vim and I have even customised my workflows for building code, running tests etc.
For many years I have observed myself, friends and colleagues have been writing
printf,puts,I truly believe that interactive, graphical debugging environments are the best way to understand and reason about both unfamiliar and familiar code, and that the lack of ready, simple access to a debugger is a huge hidden productivity hole for many.
Don't get me wrong, I know there are literally millions of developers out there that are more than competent at developing without a graphical debugger, but I maintain that if they had the ability to just press a key and jump into the debugger, it would be faster and more enjoyable that just cerebral code comprehension.
I created Vimspector because I find changing tools frustrating.
gdbfor c++,pdbfor python, etc. Each has its own syntax. Each its own lexicon. Each its own foibles.I designed the configuration system in such a way that the configuration can be committed to source control so that it just works for any of your colleagues, friends, collaborators or complete strangers.
I made remote debugging a first-class feature because that's a primary use case for me in my job.
With Vimspector I can just hit
<F5>in all of the languages I develop in and debug locally or remotely using the exact same workflow, mappings and UI. I have integrated this with my Vim in such a way that I can hit a button and run the test under the cursor in Vimspector. This kind of integration has massively improved my workflow and productivity. It's even made the process of learning a new codebase... fun.- Ben Jackson, Creator.
Copyright © 2018 Ben Jackson
If you like Vimspector so much that you're wiling to part with your hard-earned cash, please consider donating to one of the following charities, which are meaningful to the author of Vimspector (in order of preference):
- Hector's Greyhound Rescue
- Cancer Research UK
- ICCF Holland
- Any charity of your choosing.
By default, vimspector does not change any of your mappings. Mappings are very
personal and so you should work out what you like and use vim's powerful mapping
features to set your own mappings. To that end, Vimspector defines the following
<Plug> mappings:
| Mapping | Function | API |
|---|---|---|
<Plug>VimspectorContinue |
When debugging, continue. Otherwise start debugging. | vimspector#Continue() |
<Plug>VimspectorStop |
Stop debugging. | vimspector#Stop() |
<Plug>VimpectorRestart |
Restart debugging with the same configuration. | vimspector#Restart() |
<Plug>VimspectorPause |
Pause debuggee. | vimspector#Pause() |
<Plug>VimspectorBreakpoints |
Show/hide the breakpoints window | vimspector#ListBreakpoints() |
<Plug>VimspectorToggleBreakpoint |
Toggle line breakpoint on the current line. | vimspector#ToggleBreakpoint() |
<Plug>VimspectorToggleConditionalBreakpoint |
Toggle conditional line breakpoint or logpoint on the current line. | vimspector#ToggleBreakpoint( { trigger expr, hit count expr } ) |
<Plug>VimspectorAddFunctionBreakpoint |
Add a function breakpoint for the expression under cursor | vimspector#AddFunctionBreakpoint( '<cexpr>' ) |
<Plug>VimspectorGoToCurrentLine |
Reset the current program counter to the current line | vimspector#GoToCurrentLine() |
<Plug>VimspectorRunToCursor |
Run to Cursor | vimspector#RunToCursor() |
<Plug>VimspectorStepOver |
Step Over | vimspector#StepOver() |
<Plug>VimspectorStepInto |
Step Into | vimspector#StepInto() |
<Plug>VimspectorStepOut |
Step out of current function scope | vimspector#StepOut() |
<Plug>VimspectorDisassemble |
Show disassembly. Enable instruction stepping | vimspector#ShowDisassembly() |
<Plug>VimspectorUpFrame |
Move up a frame in the current call stack | vimspector#UpFrame() |
<Plug>VimspectorDownFrame |
Move down a frame in the current call stack | vimspector#DownFrame() |
<Plug>VimspectorJumpToNextBreakpoint |
Move Cursor to the next breakpoint in current file | vimspector#JumpToNextBreakpoint() |
<Plug>VimspectorJumpToPreviousBreakpoint |
Move Cursor to the previous breakpoint in current file | vimspector#JumpToPreviousBreakpoint() |
<Plug>VimspectorJumpToProgramCounter |
Move Cursor to the program counter in the current frame | vimspector#JumpToProgramCounter() |
<Plug>VimspectorBalloonEval |
Evaluate expression under cursor (or visual) in popup | internal |
These map roughly 1-1 with the API functions below.
For example, if you want <F5> to start/continue debugging, add this to some
appropriate place, such as your vimrc (hint: run :e $MYVIMRC).
nmap <F5> <Plug>VimspectorContinueIn addition, many users probably want to only enable certain Vimspector mappings while debugging is active. This is also possible, though it requires writing some vimscipt.
That said, many people are familiar with particular debuggers, so the following
mappings can be enabled by setting g:vimspector_enable_mappings to the
specified value.
To use Visual Studio-like mappings, add the following to your vimrc before
loading vimspector:
let g:vimspector_enable_mappings = 'VISUAL_STUDIO'| Key | Mapping | Function |
|---|---|---|
F5 |
<Plug>VimspectorContinue |
When debugging, continue. Otherwise start debugging. |
Shift F5 |
<Plug>VimspectorStop |
Stop debugging. |
Ctrl Shift F5 |
<Plug>VimspectorRestart |
Restart debugging with the same configuration. |
F6 |
<Plug>VimspectorPause |
Pause debuggee. |
F8 |
<Plug>VimspectorJumpToNextBreakpoint |
Jump to next breakpoint in the current file. |
Shift F8 |
<Plug>VimspectorJumpToPreviousBreakpoint |
Jump to previous breakpoint in the current file. |
F9 |
<Plug>VimspectorToggleBreakpoint |
Toggle line breakpoint on the current line. |
Shift F9 |
<Plug>VimspectorAddFunctionBreakpoint |
Add a function breakpoint for the expression under cursor |
F10 |
<Plug>VimspectorStepOver |
Step Over |
Ctrl F10 |
<Plug>VimspectorRunToCursor |
Run to cursor* |
F11 |
<Plug>VimspectorStepInto |
Step Into |
Shift F11 |
<Plug>VimspectorStepOut |
Step out of current function scope |
Alt 8 |
<Plug>VimspectorDisassemble |
Show disassembly |
NOTE: Some mappings, such as ctrl and F-keys may not work depending on your
terminal, keyboard, windowing system and all sorts of other things.
See :help modifyOtherKeys and other sources. If you are unable to make this
work, just use the "human mode" mappings.
If, like me, you only have 2 hands and 10 fingers, you probably don't like
Ctrl-Shift-F keys. Also, if you're running in a terminal, there's a real
possibility of terminfo being wrong for shifted-F-keys, particularly if your
TERM is screen-256color. If these issues (number of hands, TERM variables)
are unfixable, try the following mappings, by adding the following before
loading vimspector:
let g:vimspector_enable_mappings = 'HUMAN'| Key | Mapping | Function |
|---|---|---|
F5 |
<Plug>VimspectorContinue |
When debugging, continue. Otherwise start debugging. |
F3 |
<Plug>VimspectorStop |
Stop debugging. |
F4 |
<Plug>VimspectorRestart |
Restart debugging with the same configuration. |
F6 |
<Plug>VimspectorPause |
Pause debuggee. |
F9 |
<Plug>VimspectorToggleBreakpoint |
Toggle line breakpoint on the current line. |
<leader>F9 |
<Plug>VimspectorToggleConditionalBreakpoint |
Toggle conditional line breakpoint or logpoint on the current line. |
F8 |
<Plug>VimspectorAddFunctionBreakpoint |
Add a function breakpoint for the expression under cursor |
<leader>F8 |
<Plug>VimspectorRunToCursor |
Run to Cursor |
F10 |
<Plug>VimspectorStepOver |
Step Over |
F11 |
<Plug>VimspectorStepInto |
Step Into |
F12 |
<Plug>VimspectorStepOut |
Step out of current function scope |
In addition, I recommend adding a mapping to <Plug>VimspectorBalloonEval, in
normal and visual modes, for example:
" mnemonic 'di' = 'debug inspect' (pick your own, if you prefer!)

" for normal mode - the word under the cursor
nmap <Leader>di <Plug>VimspectorBalloonEval
" for visual mode, the visually selected text
xmap <Leader>di <Plug>VimspectorBalloonEval
You may also wish to add mappings for navigating up/down the stack, toggling the breakpoints window, and showing disassembly, for example:
nmap <LocalLeader><F11> <Plug>VimspectorUpFrame
nmap <LocalLeader><F12> <Plug>VimspectorDownFrame
nmap <LocalLeader>B     <Plug>VimspectorBreakpoints
nmap <LocalLeader>D <Plug>VimspectorDisassembleThis section defines detailed usage instructions, organised by feature. For most users, the mappings section contains the most common commands and default usage. This section can be used as a reference to create your own mappings or custom behaviours.
All the below instructions assume a single debugging session. For deatils on how to debug multiple independent apps at the same time, see [multiple debugging sessions][#multiple-debugging-sessions].
- Create
.vimspector.json. See below. :call vimspector#Launch()and select a configuration.
Launching a new session makes it the active [debugging session][#multiple-debugging-sessions].
If the debug adapter configuration uses pidProperty, and you make an attach
request, then you will be asked to enter a PID (process ID) to attach to.
To make this easier, Vimspector supplies a little utility for listing PIDs. It's
like a very very simple clone of ps but works on all the supported platforms.
See its README for instructions on
setting it up.
In short:
- If you used a tarball installation, you don't need to do anything.
- Otherwise, run
go buildin thesupport/vimspector_process_listdirectory
If Vimspector is able to find this app, it will try to list all processes owned by the current user by default.
Alternatively (preferably), you can use a special form of variable expansion
called ${PickProcess(\"binaryName\")}. The version of this call will list all
processes for the current user that match this binary name.
For example:
"Attach": {
  "adapter": "CodeLLDB",
  "configuration": {
    "request": "attach",
    "program": "${workspaceRoot}/Jails",
    "pid": "${PickProcess(\"jails\")}"
  }
}
This will list each matching processes, its parent process, start time and working directory. It's looks something like this:
PID   PPID           CWD                                           START
52218 52217 (Python) /Users/ben/.vim/bundle/lsp-examples/jai/Jails 2023-05-22 16:02:24
Enter Process ID:
You then enter the PID and hit <CR>.
You can even replace the process picker with your own function. If you define
some function and set g:vimspector_custom_process_picker_func to the name of
that function. It will be passed any arguments passed to the PickProcess
expansion function. It will also be used whenever a pidProperty is specified,
so it must also handle no arguments (use ... as the formal arguments
for the function, see :help ...).
For example, to use fzf along with the supplied vimspector_process_list:
function! CustomPickProcess( ... ) abort
  let ps = $HOME .. '/.vim/bundle/vimspector/support/vimspector_process_list/vimspector_process_list'
  " a:0 is number of args
  " a:1 is the optional binary name
  if a:0 > 0
    let ps .= ' ^' . a:1 . '$'
  endif

  let line_selected = fzf#run( {
      \ 'source': ps,
      \ 'options': '--header-lines=1  '
      \          . '--prompt="Select Process: " '
      \ ,
      \
      \ } )[ 0 ]
  if empty( line_selected)
    return 0
  endif
  let pid = split( line_selected )[ 0 ]
  return str2nr( pid )
endfunction


let g:vimspector_custom_process_picker_func = 'CustomPickProcess'
Or to use fzf with the output of ps:
function! CustomPickProcess( ... ) abort
  let ps = 'ps aux'

  let line_selected = fzf#run( {
      \ 'source': ps,
      \ 'options': '--header-lines=1  '
      \          . '--prompt="Select Process: " '
      \ ,
      \
      \ } )[ 0 ]
  if empty( line_selected)
    return 0
  endif
  let pid = split( line_selected )[ 0 ]
  return str2nr( pid )
endfunction


let g:vimspector_custom_process_picker_func = 'CustomPickProcess'To launch a specific debug configuration, or specify replacement variables for the launch, you can use:
:call vimspector#LaunchWithSettings( dict )
The argument is a dict with the following keys:
configuration: (optional) Name of the debug configuration to launch<anything else>: (optional) Name of a variable to set
This allows for some integration and automation. For example, if you have a
configuration named Run Test that contains a replacement
variable named ${Test} you could write a mapping which
ultimately executes:
vimspector#LaunchWithSettings( #{ configuration: 'Run Test'
                                \ Test: 'Name of the test' } )
This would start the Run Test configuration with ${Test} set to 'Name of the test' and Vimspector would not prompt the user to enter or confirm these
things.
See our YouCompleteMe integration guide for another example where it can be used to specify the port to connect the java debugger
To launch with an ad-hoc config you can use:
call vimspector#LaunchWithConfigurations( dict )
The argument is a dict which is the configurations section of a .vimspector
file. Pass one configuration in and that will be selected as the one to run.
For example:
   let pid = <some_expression>
   call vimspector#LaunchWithConfigurations({
               \  "attach": {
               \    "adapter": "netcoredbg",
               \    "configuration": {
               \      "request": "attach",
               \      "processId": pid
               \    }
               \  }
               \})
This would launch the debugger and attach to the specified process without the need
to have a local .vimspector file on disk.
The ${workspaceRoot} variable will point to the parent folder of the file that is
currently open in vim.
Vimspector uses the following logic to choose a configuration to launch:
- If a configuration was specified in the launch options (as above), use that.
- Otherwise if there's only one configuration and it doesn't have
autoselectset tofalse, use that. - Otherwise if there's exactly one configuration with
defaultset totrueand withoutautoselectset tofalse, use that. - Otherwise, prompt the user to select a configuration.
See the reference guide for details.
- Use
vimspector#GetConfigurations()to get a list of configurations for the filetype of the current buffer
For example, to get an array of configurations and fuzzy matching on the result
:call matchfuzzy(vimspector#GetConfigurations(), "test::case_1")See the mappings section for the default mappings for working with breakpoints. This section describes the full API in vimscript functions.
Breakpoints are associated with the current [debugging session][#multiple-debugging-sessions]. When switching between sessions, the breakpont signs for the previous session are removed and the breakpoints for the newly activated session are displayed. While it might be useful to see breakpoints for all sessions, this can be very confusing.
Use :VimspectorBreakpoints or map something to <Plug>VimspectorBreakpoints
to open the breakpoints view. From here you can list, jump to delete, add and
toggle breakpoints.
I recommend a mapping like this to toggle the breakpoints window:
nmap <Leader>db <Plug>VimspectorBreakpointsThe following mappings apply by default in the breakpoints window:
t,<F9>- toggle, i.e. enable/disable breakpointT- toggle, i.e. enable/disable ALL breakpointsdd,<Del>- delete the current breakpointcc,C- edit the current breakpoint optionsi,a,o- add a new line breakpointI,A,O- add a new function breakpoint<Enter>or double-click - jump to the line breakpoint
A WinBar is provided (where supported) too. This adds functions like saving/restoring sessions, clearing all breakpoints, and resetting the exception breakpoints options.
The simplest and most common form of breakpoint is a line breakpoint. Execution is paused when the specified line is executed.
For most debugging scenarios, users will just hit <F9> to create a line
breakpoint on the current line and <F5> to launch the application.
Some debug adapters support conditional breakpoints. Note that vimspector does not tell you if the debugger doesn't support conditional breakpoints (yet). A conditional breakpoint is a breakpoint which only triggers if some expression evaluates to true, or has some other constraints met.
Some of these functions above take a single optional argument which is a dictionary of options. The dictionary can have the following keys:
condition: An optional expression evaluated to determine if the breakpoint should fire. Not supported by all debug adapters. For example, to break whenabcis10, enter something likeabc == 10, depending on the language.hitCondition: An optional expression evaluated to determine a number of times the breakpoint should be ignored. Should (probably?) not be used in combination withcondition. Not supported by all debug adapters. For example, to break on the 3rd time hitting this line, enter3.logMessage: An optional string to make this breakpoint a "logpoint" instead. When triggered, this message is printed to the console rather than interrupting execution. You can embed expressions in braces{like this}, for example#{ logMessage: "Iteration {i} or {num_entries / 2}" }
In each case expressions are evaluated by the debugger, so should be in whatever dialect the debugger understands when evaluating expressions.
When using the <leader><F9> mapping, the user is prompted to enter these
expressions in a command line (with history).
Exception breakpoints typically fire when an exception is throw or other error condition occurs. Depending on the debugger, when starting debugging, you may be asked a few questions about how to handle exceptions. These are "exception breakpoints" and vimspector remembers your choices while Vim is still running.
Typically you can accept the defaults (just keep pressing <CR>!) as most debug
adapter defaults are sane, but if you want to break on, say uncaught exception
then answer Y to that (for example).
You can configure your choices in the .vimspector.json. See
the configuration guide for details on that.
NOTE: Previously, ToggleBreakpoint would cycle between 3 states:
enabled, disabled, deleted. Many users found the 'disabled' state was rarely
useful, so the behaviour has been changed. ToggleBreakpoint always creates or
deletes a breakpoint. If you wish to 'disable' breakpoints, use the
breakpoints window and 'toggle' (t) from there.
- Use
vimspector#ToggleBreakpoint( { options dict } )to set/delete a line breakpoint. The argument is optional (see below). - Use
vimspector#AddFunctionBreakpoint( '<name>', { options dict} )to add a function breakpoint. The second argument is optional (see below). - Use
vimspector#SetLineBreakpoint( file_name, line_num, { options dict } )to set a breakpoint at a specific file/line. The last argument is optional (see below) - Use
vimspector#ClearLineBreakpoint( file_name, line_num )to remove a breakpoint at a specific file/line - Use
vimspector#ClearBreakpoints()to clear all breakpoints - Use
vimspector#ResetExceptionBreakpoints()to clear the exception breakpoints configuration and re-anser the various questions like "Break on C++ Throw" - Use
:VimspectorMkSessionand:VimspectorLoadSessionto save and restore breakpoints call vimspector#ListBreakpoints()- toggle breakpoints windowcall vimspector#BreakpointsAsQuickFix()- return the current set of breakpoints in vim quickfix format
Examples:
call vimspector#ToggleBreakpoint()- toggle breakpoint on current linecall vimspector#SetLineBreakpoint( 'some_file.py', 10 )- set a breakpoint onsome_filepy:10call vimspector#AddFunctionBreakpoint( 'main' )- add a function breakpoint on themainfunctioncall vimspector#ToggleBreakpoint( { 'condition': 'i > 5' } )- add a breakpoint on the current line that triggers only wheni > 5istruecall vimspector#SetLineBreakpoint( 'some_file.py', 10, { 'condition': 'i > 5' } )- add a breakpoint atsome_file.py:10that triggers only wheni > 5istruecall vimspector#ClearLineBreakpoint( 'some_file.py', 10 )- delete the breakpoint atsome_file.py:10call vimspector#ClearBreakpoints()- clear all breakpointsVimspectorMkSession- create.vimspector.sessionVimspectorLoadSession- read.vimspector.sessionVimspectorMkSession my_session_file- createmy_session_fileVimspectorLoadSession my_session_file- readmy_session_file
NOTE: Experimental feature, which may change significantly in future based on user feedback.
Instruction breakpoints can be added from the disassembly window in the same way that you add line breakpoints in the code window. The same mappings and functions work for adding and toggling them. Where supported by the debug adapter, you can even create logpoints and conditional breakpoints this way.
Currently, instruction breakpoints are internally modelled as line breakpoints against the buffer containing the disassembly, but that may change in future, so please don't rely on this.
Instruction breakpoints are also visible from and can be deleted/disabled from the breakpoints window.
Currently, instruction breakpoints are automatically cleared when the debug session ends. The reason for this is that the addresses can't be guaranteed to be valid for any other debug session. However, this may also change in future.
Use vimspector#ClearBreakpoints()
to clear all breakpoints including the memory of exception breakpoint choices.
Use vimspector#RunToCursor or <leader><F8>: this creates a temporary
breakpoint on the current line, then continues execution, clearing the
breakpoint when it is hit.
Use vimspector#GoToCurrentLine() or some mapping to
<Plug>VimspectorGoToCurrentLine to jump the current execution to the line your
cursor is currently on.
Where supported this can be useful to re-run sections of code or skip over them entirely.
If there are multiple possible "targets" on the current line, you're prompted to pick one.
Vimspector can save and restore breakpoints (and some other stuff) to a session file. The following commands exist for that:
VimspectorMkSession [file/dir name]- save the current set of line breakpoints, logpoints, conditional breakpoints, function breakpoints and exception breakpoint filters to the supplied session file or the default file in the supplied directory.VimspectorLoadSession [file/dir name]- read breakpoints from the session file supplied or the default file in the supplied directory and replace any currently set breakpoints. Prior to loading, all current breakpoints are cleared (as ifvimspector#ClearLineBreakpoints()was called).
In both cases, the file/dir name argument is optional. By default, the file is
named .vimspector.session, but this can be changed globally by setting
g:vimspector_session_file_name to something else, or by manually specifying a
path when calling the command. If you supply a directory, the default or
configured session file name is read fron or written to that directory.
Othewise, the file is read based on the currently open buffer or written to the
current working directory.
Advanced users may wish to automate the process of loading and saving, for
example by adding VimEnter and VimLeave autocommands. It's recommended in
that case to use silent! to avoid annoying errors if the file can't be read or
written.
The simplest form of automation is to load the vimspector session whenever you start vim with a session file. This is as simple as doing this:
$ echo silent VimspectorLoadSession > Sessionx.vim
See :help mksession for details of the *x.vim file. You can also do
something like this using SessionLoadPost:
autocmd SessionLoadPost * silent! VimspectorLoadSession- Step in/out, finish, continue, pause etc. using the WinBar, or mappings.
- Stepping is contextual. By default, stepping is statement granularity. But if your cursor is in the disassembly window, then stepping defaults to instruction granularity.
- If you really want to, the API is
vimspector#StepInto()etc.. There are alsovimspector#StepSOver()andvimspector#StepIOver()etc. variants for statement and instruction granularity respectively.
- Current scope shows values of locals.
- Use
<CR>, or double-click with left mouse to expand/collapse (+, -). - Set the value of the variable with
<C-CR>(control +<CR>) or<leader><CR>(ifmodifyOtherKeysdoesn't work for you) - View the type of the variable via mouse hover.
- When changing the stack frame the locals window updates.
- While paused, hover to see values.
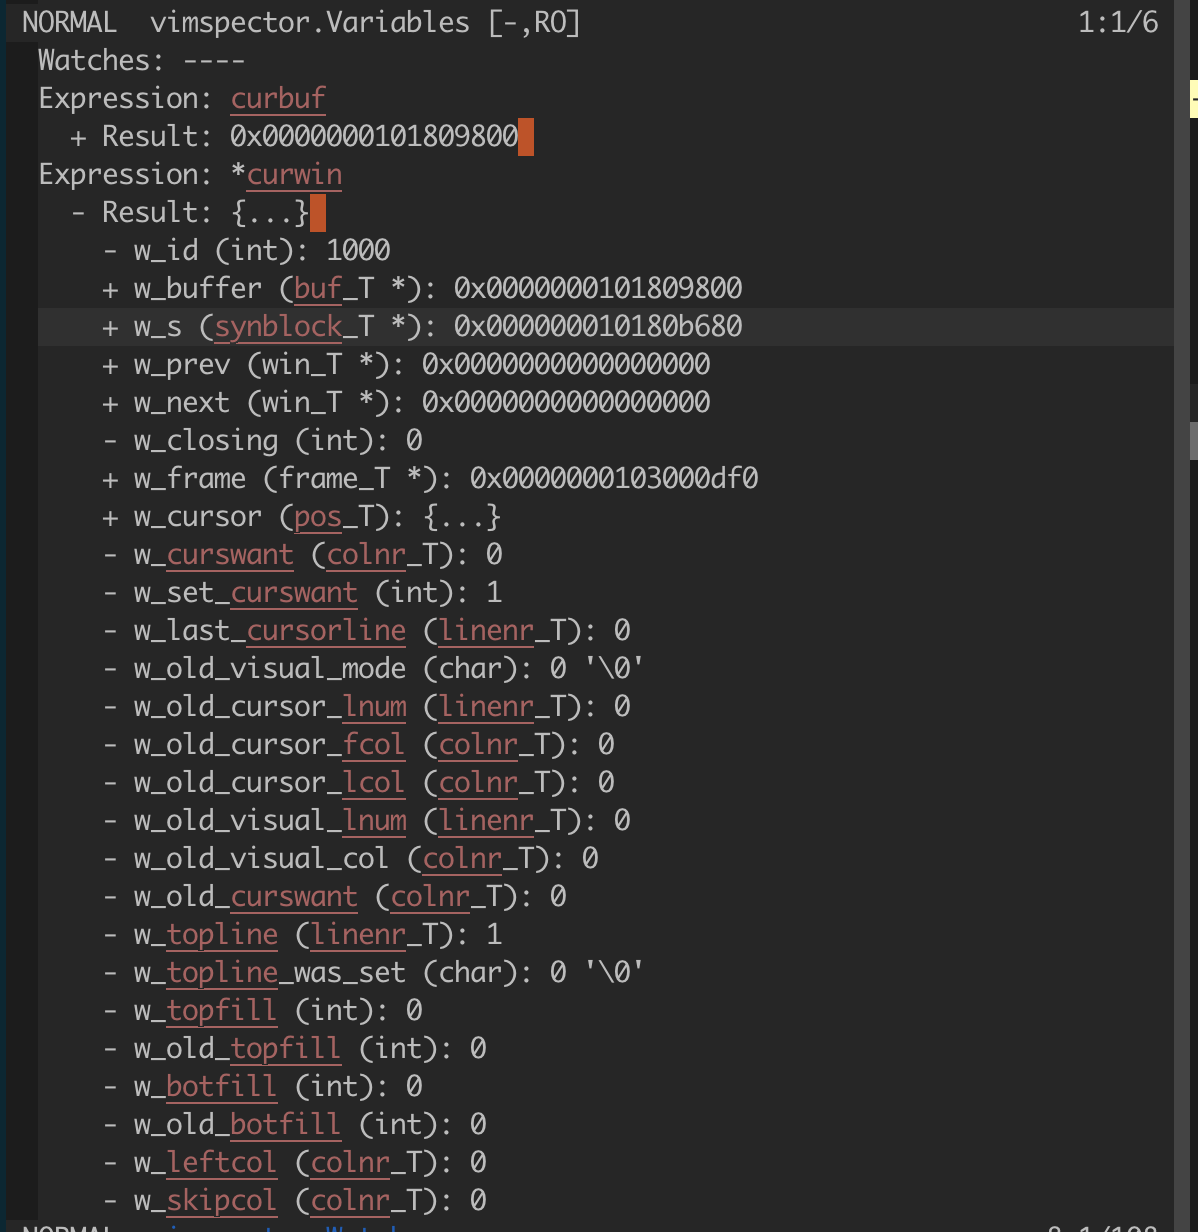
Scopes and variables are represented by the buffer vimspector.Variables.
If you prefer a more verbose display for variables and watches, then you can
let g:vimspector_variables_display_mode = 'full'. By default only the name and
value are displayed, with other data available from hovering the mouse or
triggering <Plug>VimspectorBalloonEval on the line containing the value in the
variables (or watches) window.
All rules for Variables and scopes apply plus the following:
- With mouse enabled, hover over a variable and get the value it evaluates to. This applies to the variables and watches windows too, and allows you to view the type of the value.
- Use your mouse to perform a visual selection of an expression (e.g.
a + b) and get its result. - Make a normal mode (
nmap) and visual mode (xmap) mapping to<Plug>VimspectorBalloonEvalto manually trigger the popup.- Set the value of the variable with
<C-CR>(control +<CR>) or<leader><CR>(ifmodifyOtherKeysdoesn't work for you) - Use regular navigation keys (
j,k) to choose the current selection;<Esc>(or leave the tooltip window) to close the tooltip.
- Set the value of the variable with
You can disable automatic hovering popup by settings
g:vimspector_enable_auto_hover=0 before starting the debug session. You can
then map something to <Plug>VimspectorBalloonEval and trigger it manually.
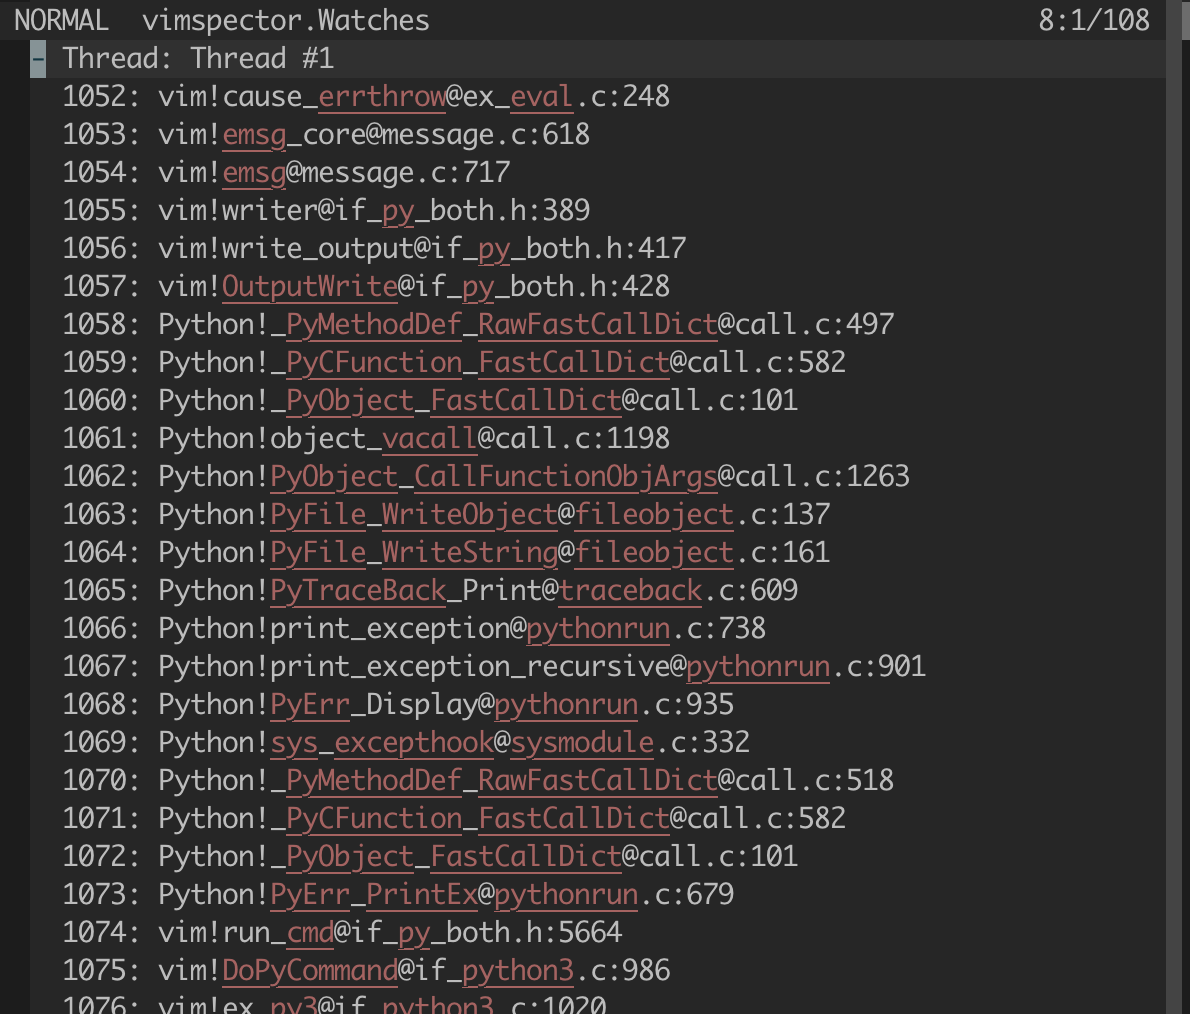
The watch window is used to inspect variables and expressions. Expressions are evaluated in the selected stack frame which is "focussed"
The watches window is a prompt buffer, where that's available. Enter insert mode to add a new watch expression.
- Add watches to the variables window by entering insert mode and
typing the expression. Commit with
<CR>. - Alternatively, use
:VimspectorWatch <expression>. Tab-completion for expression is available in some debug adapters. - View the type of the variable via mouse hover.
- Expand result with
<CR>, or double-click with left mouse. - Set the value of the variable with
<C-CR>(control +<CR>) or<leader><CR>(ifmodifyOtherKeysdoesn't work for you) - Delete with
<DEL>.
The watches are represented by the buffer vimspector.Watches.
If you prefer a more verbose display for variables and watches, then you can
let g:vimspector_variables_display_mode = 'full'. By default only the name and
value are displayed, with other data available from hovering the mouse or
triggering <Plug>VimspectorBalloonEval on the line containing the value in the
variables (or watches) window.
You can disable automatic hovering popup by settings
g:vimspector_enable_auto_hover=0 before starting the debug session. You can
then map something to <Plug>VimspectorBalloonEval and trigger it manually.
The watch prompt buffer has its omnifunc set to a function that will
calculate completion for the current expression. This is trivially used with
<Ctrl-x><Ctrl-o> (see :help ins-completion), or integrated with your
favourite completion system. The filetype in the buffer is set to
VimspectorPrompt.
For YouCompleteMe, the following config works well:
let g:ycm_semantic_triggers =  {
  \   'VimspectorPrompt': [ '.', '->', ':', '<' ]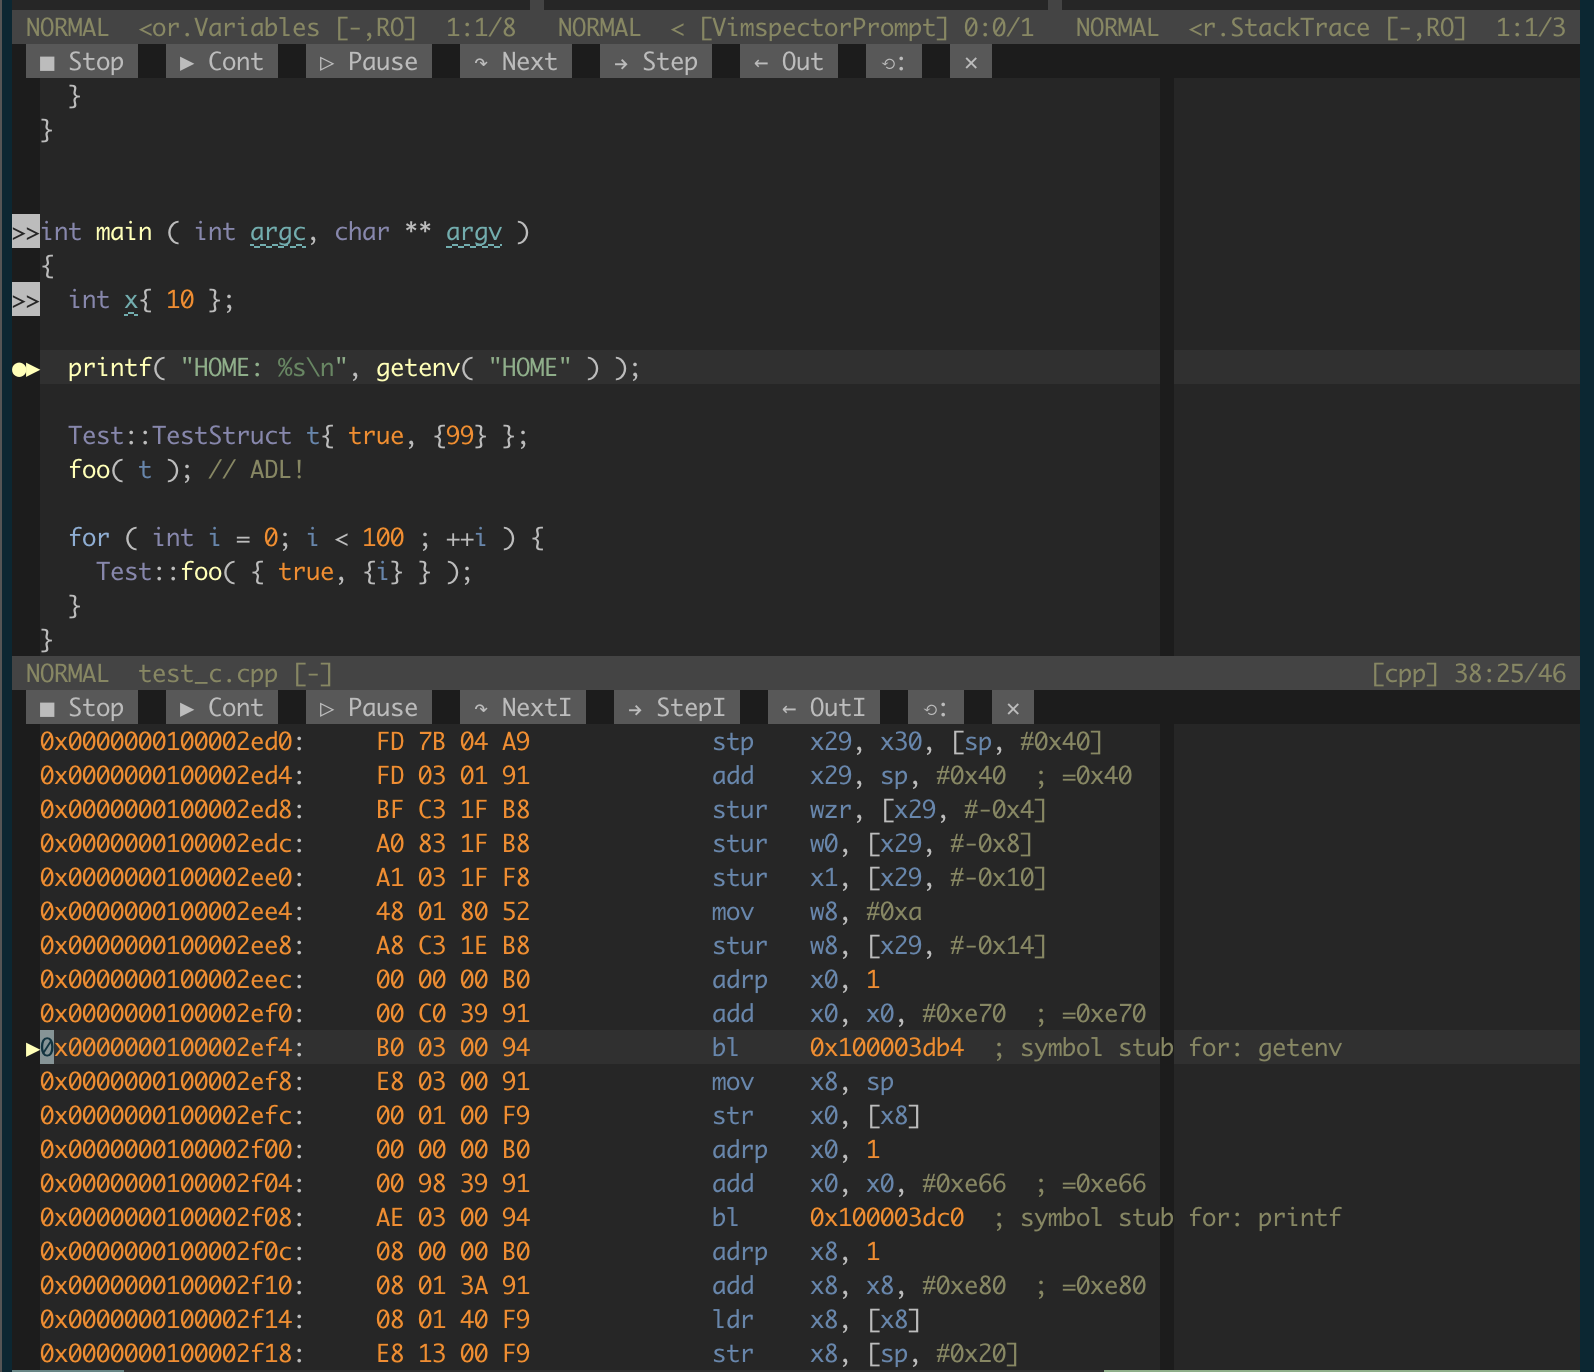
}- Dispplay disassembly around current PC
- Step over/into/out by instruction (contextually, or using the WinBar)
:VimspectorDisassemble,vimspector#ShowDisassembly()or<Plug>VimspectorDisassemble

Some debug adapters (few!) support disassembly. The way this works in DAP is a little wierd, but in practice vimspector will ask to disassemble a number of instructions around the current stack frame's PC. This is then shown in a window with a WinBar similar to the Code window, but with instruction stepping granularity. There's a sign for the current instruction and the syntax highighting defaults to "asm" which mostly works ok for x86 and ARM.
As mentioned above, when your current window is the disassembly windows and you
use the default "step" commands (e.g. <F10>), the stepping is automatically
chnged to per-instruction rather than per statement.
Each time the process stops, vimspector requests about 2 windows full of instructions around the current PC. To see more, you can scroll the window. Vimspector will page in an extra screenful of instructions when the window scrolls to the top or near the bottom. This isn't perfect. Sometimes you have to scroll a bit more to make it page in (e.g. ctrl-e ctrl-y at the top). This is not ideal, and may be improved in future.
You can control the intial height of the disassembly window with
let g:vimspector_disassembly_height = 10 (or whatver number of lines).
The filetype (and syntax) of the buffers in the disassembly window is
vimspector-disassembly. You can use FileType autocommands to customise
things like the syntax highlighting.
NOTE: This feature is experimental and may change in any way based on user feedback.
Some debug adapters provide a way to dump process memory associated with variables. This can be done from the Variables and Watches windows with:
- The WinBar option "Dump"
<leader>mmapping (by default, can be customised)vimspector#ReadMemory()function
On doing this, you're asked to enter a number of bytes to read (from the
location associated with the current cursor line) and an offset from that
location. A new buffer is displayed in the Code Window containing a memory dump
in hex and ascii, similar to the output of xxd.
NOTE: This feature is experimental and may change in any way based on user feedback.
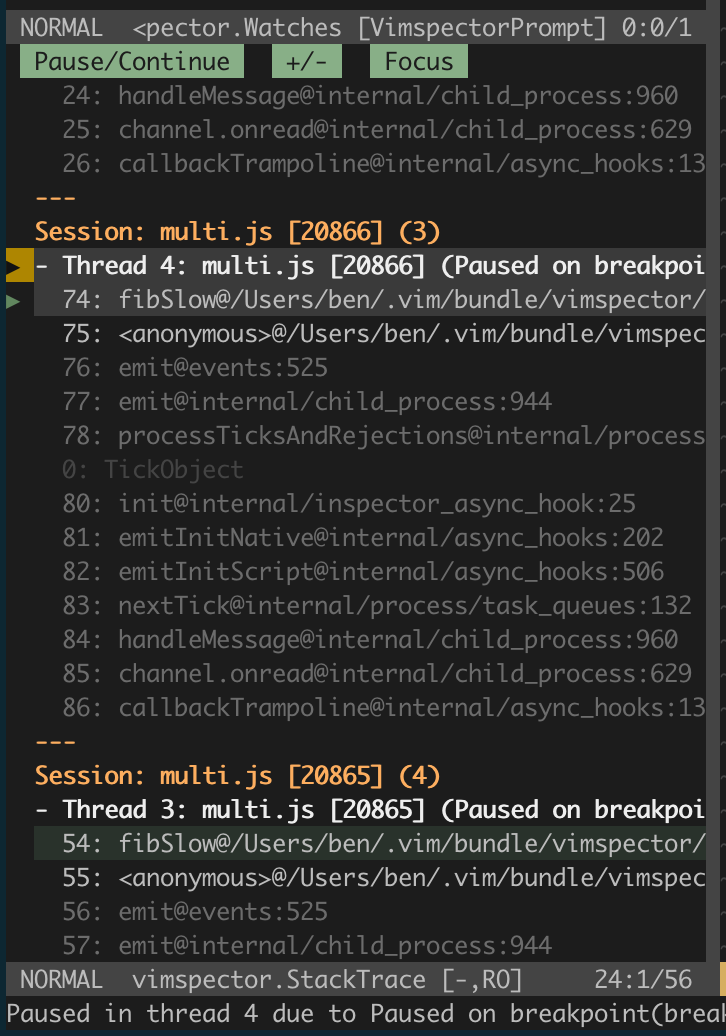
The stack trace window shows the state of each program thread. Threads which are stopped can be expanded to show the stack trace of that thread.
Often, but not always, all threads are stopped when a breakpoint is hit. The status of a thread is show in parentheses after the thread's name. Where supported by the underlying debugger, threads can be paused and continued individually from within the Stack Trace window.
A particular thread, highlighted with the CursorLine highlight group is the
"focussed" thread. This is the thread that receives commands like "Step In",
"Step Out", "Continue" and "Pause" in the code window. The focussed thread can
be changed manually to "switch to" that thread.
- Use
<CR>, or double-click with left mouse to expand/collapse a thread stack trace, or use the WinBar button. - Use
<CR>, or double-click with left mouse on a stack frame to jump to it. - Use the WinBar or
vimspector#PauseContinueThread()to individually pause or continue the selected thread. - Use the "Focus" WinBar button,
<leader><CR>orvimspector#SetCurrentThread()to set the "focussed" thread to the currently selected one. If the selected line is a stack frame, set the focussed thread to the thread of that frame and jump to that frame in the code window. - The current frame when a breakpoint is hit or if manual jumping is also highlighted.
The stack trace is represented by the buffer vimspector.StackTrace.
If there are child debug sessions, such as where the debugee launches child processes and the debug adapter supports multi-session debugging, then each session's threads are shown separately. The currently active session is the one that is highlighted as the currently active thread/stack frame. To switch control to a different session, focus a thread within that session.
Note: This refers to sessions created as children of an existing session, and is not to be confused with [multiple (parent) debugging sessions][#multiple-debugging-sessions].
- In the outputs window, use the WinBar to select the output channel.
- Alternatively, use
:VimspectorShowOutput <category>. Use command-line completion to see the categories. - The debuggee prints to the stdout channel.
- Other channels may be useful for debugging.
If the output window is closed, a new one can be opened with
:VimspectorShowOutput <category> (use tab-completion - wildmenu to see the
options).
The console window is a prompt buffer, where that's available, and can be used as an interactive CLI for the debug adapter. Support for this varies amongst adapters.
- Enter insert mode to enter a command to evaluate.
- Alternatively,
:VimspectorEval <expression>. Completion is available with some debug adapters. - Commit the request with
<CR> - The request and subsequent result are printed.
NOTE: See also Watches above.
If the output window is closed, a new one can be opened with
:VimspectorShowOutput Console.
The console prompt buffer has its omnifunc set to a function that will
calculate completion for the current command/expression. This is trivially used
with <Ctrl-x><Ctrl-o> (see :help ins-completion), or integrated with your
favourite completion system. The filetype in the buffer is set to
VimspectorPrompt.
For YouCompleteMe, the following config works well:
let g:ycm_semantic_triggers =  {
  \   'VimspectorPrompt': [ '.', '->', ':', '<' ]
}The Vimspector log file contains a full trace of the communication between Vimspector and the debug adapter. This is the primary source of diagnostic information when something goes wrong that's not a Vim traceback.
If you just want to see the Vimspector log file, use :VimspectorToggleLog,
which will tail it in a little window (doesn't work on Windows).
You can see some debugging info with :VimspectorDebugInfo
To close the debugger, use:
ResetWinBar button:VimspectorResetwhen the WinBar is not available.call vimspector#Reset()
If the debuggee is still running when stopping or resetting, then some debug adapters allow you to specify what should happen to it when finishing debugging. Typically, the default behaviour is sensible, and this is what happens most of the time. These are the defaults according to DAP:
- If the request was 'launch': terminate the debuggee
- If the request was 'attach': don't terminate the debuggee
Some debug adapters allow you to choose what to do when disconnecting. If you
wish to control this behaviour, use :VimspectorReset or call
vimspector#Reset( { 'interactive': v:true } ). If the debug adapter offers a
choice as to whether or not to terminate the debuggee, you will be prompted to
choose. The same applies for vimspector#Stop() which can take an argument:
vimspector#Stop( { 'interactive': v:true } ).
NOTE: This feature is experimental and any part of it may change in response to user feedback.
Vimspector supports starting an arbitrary number of debug sessions. Each session is associated with an individual UI tab. Typically, you only debug a single app and so don't need to think about this, but this advanced feature can be useful if you need to simultaneously debug multiple, independent applications, or multiple independent instances of your application.
At any time there is a single "active" root session. Breakpoints are associated with the current session, and all UI and API commands are applied to the currently active session.
When switching between root sessions, the breakpont signs for the previous session are removed and the breakpoints for the newly activated session are displayed. While it might be useful to see breakpoints for all sessions, this can be very confusing.
A typical workflow might be:
- Start debugging a server app (e.g.
:edit server.ccthen<F5>). This starts a debug session named after the configuration selected. You could rename it:VimspectorRenameSession server. - Open the client code in a new tab (e.g.
:tabedit client.cc) - Instantiate and make active a new debugging session and name it
client::VimspectorNewSession client(clientis now the active session). - Add a breakpoint in the
clientsession and start debugging with<F5>.
You now have 2 vimspector tabs. Intuitively, wwitching to a particular tab will
make its session active. You can also manually switch the active session with
:VimspectorSwitchToSession <name>.
So, in summary you have the following facilities:
VimspectorNewSession <name>This creates a new session and makes it active. Optional name is used in place of the generated one when starting a launch.- Switching to a specific debug tab makes that session active. This is intuitive and probably the most common way to work with this.
- Switching manually using
VimspectorSwitchToSession <tab complete>. - Name/Rename session with
VimspectorRenameSession <new name> - Root-level sessions are never 'destroyed' but you can manually destroy
them (if you're brave) using
VimspectorDestroySession <name>. You can't destroy a running/active session. vimspector#GetSessionName()useful for putting in a statusline. There's alsovimspector#GetSessionID()for techies.
Here's an example of how you can display the current session name in the
statusline (see :help statusline, or the documentation for your fancy status
line plugin).
function! StlVimspectorSession()
  " Only include in buffers containing actual files
  if !empty( &buftype )
    return ''
  endif

  " Abort if vimspector not loaded
  if !exists( '*vimspector#GetSessionName' ) ||
        \ !exists( '*vimspector#GetSessionID' )
    return ''
  endif

  return vimspector#GetSessionName()
        \ .. ' ('
        \ .. vimspector#GetSessionID()
        \ .. ')'
endfunction

" ... existing statusline stuff
" set statusline=...
" Show the vimspector active session name (max 20 chars) if there is onw.
set statusline+=%(\ %.20{StlVimspectorSession()}\ %)For an introduction to the configuration of .vimspector.json, take a look at
the Getting Started section of the Vimspector website.
For a full explanation, including how to use variables, substitutions and how to specify exception breakpoints, see the docs.
The JSON configuration file allows C-style comments:
// comment to end of line .../* inline comment ... */
Currently tested with the following debug adapters.
- vscode-cpptools
- On macOS, I strongly recommend using CodeLLDB instead for C and C++ projects. It's really excellent, has fewer dependencies and doesn't open console apps in another Terminal window.
Example .vimspector.json (works with both vscode-cpptools and lldb-vscode.
For lldb-vscode replace the name of the adapter with lldb-vscode:
- vscode-cpptools Linux/MacOS:
{
  "configurations": {
    "Launch": {
      "adapter": "vscode-cpptools",
      "filetypes": [ "cpp", "c", "objc", "rust" ], // optional
      "configuration": {
        "request": "launch",
        "program": "<path to binary>",
        "args": [ ... ],
        "cwd": "<working directory>",
        "environment": [ ... ],
        "externalConsole": true,
        "MIMode": "<lldb or gdb>"
      }
    },
    "Attach": {
      "adapter": "vscode-cpptools",
      "filetypes": [ "cpp", "c", "objc", "rust" ], // optional
      "configuration": {
        "request": "attach",
        "program": "<path to binary>",
        "MIMode": "<lldb or gdb>"
      }
    }
    // ...
  }
}- vscode-cpptools Windows
NOTE FOR WINDOWS USERS: You need to install gdb.exe. I recommend using
scoop install gdb. Vimspector cannot use the visual studio debugger due to
licensing.
{
  "configurations": {
    "Launch": {
      "adapter": "vscode-cpptools",
      "filetypes": [ "cpp", "c", "objc", "rust" ], // optional
      "configuration": {
        "request": "launch",
        "program": "<path to binary>",
        "stopAtEntry": true
      }
    }
  }
}Depending on the backend you need to enable pretty printing of complex types manually.
-
LLDB: Pretty printing is enabled by default
-
GDB: To enable gdb pretty printers, consider the snippet below. It is not enough to have
set print pretty onin your .gdbinit!
{
  "configurations": {
    "Launch": {
      "adapter": "vscode-cpptools",
      "filetypes": [ "cpp", "c", "objc", "rust" ], // optional
      "configuration": {
        "request": "launch",
        "program": "<path to binary>",
        // ...
        "MIMode": "gdb",
        "setupCommands": [
          {
            "description": "Enable pretty-printing for gdb",
            "text": "-enable-pretty-printing",
            "ignoreFailures": true
          }
        ]
      }
    }
  }
}The cpptools documentation describes how to attach cpptools to gdbserver using
miDebuggerAddress. Note that when doing this you should use the
"request": "attach".
If you're feeling fancy, check out the reference guide for an example of getting Vimspector to remotely launch and attach.
- CodeLLDB (MacOS)
CodeLLDB is superior to vscode-cpptools in a number of ways on macOS at least.
See Rust.
- lldb-vscode (MacOS)
An alternative is to to use lldb-vscode, which comes with llvm. Here's how:
- Install llvm (e.g. with HomeBrew:
brew install llvm) - Create a file named
/path/to/vimspector/gadgets/macos/.gadgets.d/lldb-vscode.json:
{
  "adapters": {
    "lldb-vscode": {
      "variables": {
        "LLVM": {
          "shell": "brew --prefix llvm"
        }
      },
      "attach": {
        "pidProperty": "pid",
        "pidSelect": "ask"
      },
      "command": [
        "${LLVM}/bin/lldb-vscode"
      ],
      "env": {
        "LLDB_LAUNCH_FLAG_LAUNCH_IN_TTY": "YES"
      },
      "name": "lldb"
    }
  }
}
Rust is supported with any gdb/lldb-based debugger. So it works fine with
vscode-cpptools and lldb-vscode above. However, support for rust is best in
CodeLLDB.
./install_gadget.py --enable-rustor:VimspectorInstall CodeLLDB- Example:
support/test/rust/vimspector_test
{
  "configurations": {
    "launch": {
      "adapter": "CodeLLDB",
      "filetypes": [ "rust" ],
      "configuration": {
        "request": "launch",
        "program": "${workspaceRoot}/target/debug/vimspector_test"
      }
    },
    "attach": {
      "adapter": "CodeLLDB",
      "filetypes": [ "rust", "c", "cpp", "jai" ],
      "configuration": {
        "request": "attach",
        "program": "${workspaceRoot}/${fileBasenameNoExtension}",
        "PID": "${PID}"
      }
    }
  }
}- Docs: https://github.com/vadimcn/vscode-lldb/blob/master/MANUAL.md
- NOTE: The CodeLLDB manual assumes you are using VSCode (sigh) and therefore says things which don't work in vimspector, as there is a whole load of javascript nonesense behind every VSCode plugin. I can't possibly document all the wierdnesses, but the following are known
- To use the "custom" launch, you can't use
"request": "custom"- this is invalid. Instead use"request": "launch", "custom": true. Because reasons - All the integration with
cargois done in the vscode javascript madness, so is not supported. - The stuff about remote agents uses
"request": custom; see the point about "custom" launch above - Source Mapping (i.e., enabling
step-intofor standard library functions) can be done by adding"sourceMap": { "from_path" : "to_path" }."from_path"can be found in disassembly window by going up in the stack trace;"to_path"is just your locally installed standard library path for current toolchain.
Jai debugging works fine with any of the other native debuggers. I recommend CodeLLDB, but cpptools also works.
Example:
{
  "$schema": "https://puremourning.github.io/vimspector/schema/vimspector.schema.json",
  "adapters": {
    "gdb-with-build": {
      "extends": "vscode-cpptools",
      "variables": {
        "buildme": {
          "shell": "jai ${workspaceRoot}/build.jai"
        }
      }
    },
    "codelldb-with-build": {
      "extends": "CodeLLDB",
      "variables": {
        "buildme": {
          "shell": "jai ${workspaceRoot}/build.jai"
        }
      }
    }
  },
  "configurations": {
    "Run - gdb": {
      "adapter": "gdb-with-build",
      "filetypes": [ "jai" ],
      "configuration": {
        "request": "launch",
        "program": "${workspaceRoot}/${binaryName}",
        "args": [ "*${args}" ],
        "stopAtEntry": true,
        "stopOnEntry": true
      }
    },
    "Run - lldb": {
      "extends": "Run - gdb",
      "filetypes": [ "jai" ],
      "adapter": "codelldb-with-build"
    },
    "Attach - gdb": {
      "adapter": "vscode-cpptools",
      "filetypes": [ "jai" ],
      "configuration": {
        "request": "attach",
        "program": "${workspaceRoot}/${binaryName}",
        "processId": "${PID}"
      }
    },
    "Attach - lldb": {
      "extends": "Attach - gdb",
      "filetypes": [ "jai" ],
      "adapter": "CodeLLDB",
      "configuration": {
        "pid": "${PID}"
      }
    }
  }
}
-
Python: debugpy
-
Install with
install_gadget.py --enable-pythonor:VimspectorInstall debugpy, ideally requires a working compiler and the python development headers/libs to build a C python extension for performance. -
NOTE: Debugpy no longer supports python 2. In order to continue to debug python 2 applications, use the
debugpy-python2adapter after installing thedebugpy-python2gadget. -
Full options: https://github.com/microsoft/debugpy/wiki/Debug-configuration-settings
{
  "configurations": {
    "<name>: Launch": {
      "adapter": "debugpy",
      "filetypes": [ "python" ],
      "configuration": {
        "name": "<name>: Launch",
        "type": "python",
        "request": "launch",
        "cwd": "<working directory>",
        "python": "/path/to/python/interpreter/to/use",
        "stopOnEntry": true,
        "console": "externalTerminal",
        "debugOptions": [],
        "program": "<path to main python file>"
      }
    }
    ...
  }
}In order to use remote debugging with debugpy, you have to connect Vimspector directly to the application that is being debugged. This is easy, but it's a little different from how we normally configure things. Specifically, you need to:
- Start your application with debugpy, specifying the
--listenargument. See the debugpy documentation for details. - Use the built-in "multi-session" adapter. This just asks for the host/port to connect to. For example:
{
  "configurations": {
    "Python Attach": {
      "adapter": "multi-session",
      "filetypes": [ "python" ], // optional
      "configuration": {
        "request": "attach",
        "pathMappings": [
          // mappings here (optional)
        ]
      }
    }
  }
}
See details of the launch
configuration
for explanation of things like pathMappings.
Additional documentation, including how to do this when the remote machine can only be contacted via SSH are provided by debugpy.
If you're feeling fancy, checkout the reference guide for an example of getting Vimspector to remotely launch and attach.
In order to continue to debug python 2 applications, ensure that you install the
debugpy-python2 gadget (e.g. --force-enable-python2 or
:VimspectorInstall debugpy-python2), and then change your configuration to
use:
{
  "configurations": {
    "Python Attach": {
      "adapter": "debugpy-python2",
      // ...
    }
  }
}
for examk
- TCL (TclProDebug)
See my fork of TclProDebug for instructions.
- C# - dotnet core
Install with install_gadget.py --force-enable-csharp or :VimspectorInstall netcoredbg
{
  "configurations": {
    "launch - netcoredbg": {
      "adapter": "netcoredbg",
      "filetypes": [ "cs", "fsharp", "vbnet" ], // optional
      "configuration": {
        "request": "launch",
        "program": "${workspaceRoot}/bin/Debug/netcoreapp2.2/csharp.dll",
        "args": [],
        "stopAtEntry": true,
        "cwd": "${workspaceRoot}",
        "env": {}
      }
    }
  }
}- Go (delve dap)
Requires:
install_gadget.py --enable-goor:VimspectorInstall delvego 1.16or later (YMMV on earlier versions)
This uses the DAP support built in to the delve debugger
{
  "configurations": {
    "run": {
      "adapter": "delve",
      "filetypes": [ "go" ], // optional
      "variables": {
        // example, to disable delve's go version check
        // "dlvFlags": "--check-go-version=false"
      },
      "configuration": {
        "request": "launch",
        "program": "${fileDirname}",
        "mode": "debug"
      }
    }
  }
}
Use Variables to configure the following:
dlvFlags: (string) additional command line arguments to pass to delve
The debugger (delve) is launched in a terminal window so that you can see its output and pass input to the debuggee.
See vscode-go docs for full launch options. Yes, it seems that's the only place they are documented (apparently, they are not documented by delve itself).
The vscode-go docs also have useful troubleshooting information
- Go (legacy vscode-go)
Requires:
install_gadget.py --enable-goor:VimspectorInstall vscode-go- Delve installed, e.g.
go get -u github.com/go-delve/delve/cmd/dlv - Delve to be in your PATH, or specify the
dlvToolPathlaunch option
NOTE: Vimspector uses the "legacy" vscode-go debug adapter rather than the "built-in" DAP support in Delve. You can track #186 for that.
{
  "configurations": {
    "run": {
      "adapter": "vscode-go",
      "filetypes": [ "go" ], // optional
      "configuration": {
        "request": "launch",
        "program": "${fileDirname}",
        "mode": "debug",
        "dlvToolPath": "$HOME/go/bin/dlv"
        // example, to disable delve's go version check
        // "dlvFlags": [ "--check-go-version=false" ]
      }
    }
  }
}
See the vscode-go docs for troubleshooting information
This uses the php-debug, see https://marketplace.visualstudio.com/items?itemName=felixfbecker.php-debug
Requires:
- (optional) Xdebug helper for chrome https://chrome.google.com/webstore/detail/xdebug-helper/eadndfjplgieldjbigjakmdgkmoaaaoc
install_gadget.py --force-enable-phpor:VimspectorInstall vscode-php-debug- configured php xdebug extension
- nodejs for vscode-php-debug
zend_extension=xdebug.so
xdebug.remote_enable=on
xdebug.remote_handler=dbgp
xdebug.remote_host=localhost
xdebug.remote_port=9000
replace localhost with the ip of your workstation.
lazy alternative
zend_extension=xdebug.so
xdebug.remote_enable=on
xdebug.remote_handler=dbgp
xdebug.remote_connect_back=true
xdebug.remote_port=9000- .vimspector.json
{
  "configurations": {
    "Listen for XDebug": {
      "adapter": "vscode-php-debug",
      "filetypes": [ "php" ], // optional
      "configuration": {
        "name": "Listen for XDebug",
        "type": "php",
        "request": "launch",
        "port": 9000,
        "stopOnEntry": false,
        "pathMappings": {
          "/var/www/html": "${workspaceRoot}"
        }
      }
    },
    "Launch currently open script": {
      "adapter": "vscode-php-debug",
      "filetypes": [ "php" ], // optional
      "configuration": {
        "name": "Launch currently open script",
        "type": "php",
        "request": "launch",
        "program": "${file}",
        "cwd": "${fileDirname}",
        "port": 9000
      }
    }
  }
}append XDEBUG_SESSION_START=xdebug to your query string
curl "http://localhost?XDEBUG_SESSION_START=xdebug"
or use the previously mentioned Xdebug Helper extension (which sets a XDEBUG_SESSION cookie)
export XDEBUG_CONFIG="idekey=xdebug"
php <path to script>- Node.js
Requires:
install_gadget.py --force-enable-node- Options described here: https://github.com/microsoft/vscode-js-debug/blob/main/OPTIONS.md
- Example:
support/test/node/simple,support/test/node/multiprocess
{
  "configurations": {
    "run": {
      "adapter": "js-debug",
      "filetypes": [ "javascript", "typescript" ], // optional
      "configuration": {
        "request": "launch",
        "stopOnEntry": true,
        "console": "integratedTerminal",
        "program": "${workspaceRoot}/simple.js",
        "cwd": "${workspaceRoot}",
        "type": "pwa-node" // this is the default, but see below
      }
    }
  }
}
vscode-js-debug supports a number of different "types" and can do some stuff
that may or may not work. The type field is sadly not documented, but the
valid values are defined here in the DebugType enum.
Vimspector has only been tested with pwa-node type.
Note also that for some reason this debug adapter always forces us to start multiple debug sessions. For a user, that shouldn't change anything (other than perhaps a slightly confusing stack trace). But it does make things more complicated and so there may be subtle bugs.
- Node.js (legacy)
NOTE: This configuration uses the deprecated legacy debug adapter and will
be removed in future. Please update your configurations to use the js-debug
adapter. You may be able to just change the adapter name.
Requires:
install_gadget.py --force-enable-node- For installation, a Node.js environment that is < node 12. I believe this is an
incompatibility with gulp. Advice, use nvm with
nvm install --lts 10; nvm use --lts 10; ./install_gadget.py --force-enable-node ... - Options described here: https://code.visualstudio.com/docs/nodejs/nodejs-debugging
- Example:
support/test/node/simple
{
  "configurations": {
    "run": {
      "adapter": "vscode-node",
      "filetypes": [ "javascript", "typescript" ], // optional
      "configuration": {
        "request": "launch",
        "protocol": "auto",
        "stopOnEntry": true,
        "console": "integratedTerminal",
        "program": "${workspaceRoot}/simple.js",
        "cwd": "${workspaceRoot}"
      }
    }
  }
}- Chrome/Firefox
This uses the chrome/firefox debugger (they are very similar), see https://marketplace.visualstudio.com/items?itemName=msjsdiag.debugger-for-chrome and https://marketplace.visualstudio.com/items?itemName=firefox-devtools.vscode-firefox-debug, respectively.
It allows you to debug scripts running inside chrome from within Vim.
./install_gadget.py --force-enable-chromeor:VimspectorInstall debugger-for-chrome./install_gadget.py --force-enable-firefoxor:VimspectorInstall debugger-for-firefox- Example:
support/test/web
{
  "configurations": {
    "chrome": {
      "adapter": "chrome",
      "configuration": {
        "request": "launch",
        "url": "http://localhost:1234/",
        "webRoot": "${workspaceRoot}/www"
      }
    },
    "firefox": {
      "adapter": "firefox",
      "configuration": {
        "request": "launch",
        "url": "http://localhost:1234/",
        "webRoot": "${workspaceRoot}/www",
        "reAttach": true
      }
    }
  }
}Vimspector works well with the java debug server, which runs as a jdt.ls (Java Language Server) plugin, rather than a standalone debug adapter.
Vimspector is not in the business of running language servers, only debug adapters, so this means that you need a compatible Language Server Protocol editor plugin to use Java. I recommend YouCompleteMe, which has full support for jdt.ls, and most importantly a trivial way to load the debug adapter and to use it with Vimspector.
When using the java debug server, Vimspector supports the hot code replace custom feature. By default, when the underlying class files change, vimspector asks the user if they wish to reload these classes at runtime.
This behaviour can be customised:
let g:vimspector_java_hotcodereplace_mode = 'ask'- the default, ask the user for each reload.let g:vimspector_java_hotcodereplace_mode = 'always'- don't ask, always reloadlet g:vimspector_java_hotcodereplace_mode = 'never'- don't ask, never reload
- Set up YCM for java.
- Get Vimspector to download the java debug plugin:
install_gadget.py --force-enable-java <other options...>or:VimspectorInstall java-debug-adapter - Configure Vimspector for your project using the
vscode-javaadapter, e.g.:
{
  "configurations": {
    "Java Attach": {
      "adapter": "vscode-java",
      "filetypes": [ "java" ],
      "configuration": {
        "request": "attach",
        "hostName": "${host}",
        "port": "${port}",
        "sourcePaths": [
          "${workspaceRoot}/src/main/java",
          "${workspaceRoot}/src/test/java"
        ]
      }
    }
  }
}- Tell YCM to load the debugger plugin. This should be the
gadgets/<os>directory, not any specific adapter. e.g. in.vimrc
" Tell YCM where to find the plugin. Add to any existing values.
let g:ycm_java_jdtls_extension_path = [
  \ '</path/to/Vimspector/gadgets/<os>'
\ ]- Create a mapping, such as
<leader><F5>to start the debug server and launch vimspector, e.g. in~/.vim/ftplugin/java.vim:
let s:jdt_ls_debugger_port = 0
function! s:StartDebugging()
  if s:jdt_ls_debugger_port <= 0
    " Get the DAP port
    let s:jdt_ls_debugger_port = youcompleteme#GetCommandResponse(
      \ 'ExecuteCommand',
      \ 'vscode.java.startDebugSession' )

    if s:jdt_ls_debugger_port == ''
       echom "Unable to get DAP port - is JDT.LS initialized?"
       let s:jdt_ls_debugger_port = 0
       return
     endif
  endif

  " Start debugging with the DAP port
  call vimspector#LaunchWithSettings( { 'DAPPort': s:jdt_ls_debugger_port } )
endfunction

nnoremap <silent> <buffer> <Leader><F5> :call <SID>StartDebugging()<CR>
You can then use <Leader><F5> to start debugging rather than just <F5>.
If you see "Unable to get DAP port - is JDT.LS initialized?", try running
:YcmCompleter ExecuteCommand vscode.java.startDebugSession and note the
output. If you see an error like ResponseFailedException: Request failed: -32601: No delegateCommandHandler for vscode.java.startDebugSession, make sure
that:
- Your YCM jdt.ls is actually working, see the YCM docs for troubleshooting
- The YCM jdt.ls has had time to initialize before you start the debugger
- That
g:ycm_java_jdtls_extension_pathis set in.vimrcor prior to YCM starting
For the launch arguments, see the vscode document.
See this issue for more background.
Lua is supported through
local-lua-debugger-vscode.
This debugger uses stdio to communicate with the running process, so calls to
io.read will cause problems.
./install_gadget.py --enable-luaor:VimspectorInstall local-lua-debugger-vscode- Examples:
support/test/lua/simpleandsupport/test/lua/love
{
  "$schema": "https://puremourning.github.io/vimspector/schema/vimspector.schema.json#",
  "configurations": {
    "lua": {
      "adapter": "lua-local",
      "filetypes": [ "lua" ],
      "configuration": {
        "request": "launch",
        "type": "lua-local",
        "cwd": "${workspaceFolder}",
        "program": {
          "lua": "lua",
          "file": "${file}"
        }
      }
    },
    "luajit": {
      "adapter": "lua-local",
      "filetypes": [ "lua" ],
      "configuration": {
        "request": "launch",
        "type": "lua-local",
        "cwd": "${workspaceFolder}",
        "program": {
          "lua": "luajit",
          "file": "${file}"
        }
      }
    },
    "love": {
      "adapter": "lua-local",
      "filetypes": [ "love" ],
      "configuration": {
        "request": "launch",
        "type": "lua-local",
        "cwd": "${workspaceFolder}",
        "program": {
          "command": "love"
        },
        "args": ["${workspaceFolder}"]
      }
    }
  }
}- Java - vscode-javac. This works, but is not as functional as Java Debug Server. Take a look at this comment for instructions.
- See also the wiki which has community-contributed plugin files for some languages.
There is very limited support for customisation of the UI.
Vimsector uses the following signs internally. If they are defined before
Vimsector uses them, they will not be replaced. So to customise the signs,
define them in your vimrc.
| Sign | Description | Priority |
|---|---|---|
vimspectorBP |
Line breakpoint | 9 |
vimspectorBPCond |
Conditional line breakpoint | 9 |
vimspectorBPLog |
Logpoint | 9 |
vimspectorBPDisabled |
Disabled breakpoint | 9 |
vimspectorPC |
Program counter (i.e. current line) | 200 |
vimspectorPCBP |
Program counter and breakpoint | 200 |
vimspectorNonActivePC |
Program counter for non-focused thread | 9 |
vimspectorCurrentThread |
Focussed thread in stack trace view | 200 |
vimspectorCurrentFrame |
Current stack frame in stack trace view | 200 |
The default symbols are the equivalent of something like the following:
sign define vimspectorBP            text=\ ● texthl=WarningMsg
sign define vimspectorBPCond        text=\ ◆ texthl=WarningMsg
sign define vimspectorBPLog         text=\ ◆ texthl=SpellRare
sign define vimspectorBPDisabled    text=\ ● texthl=LineNr
sign define vimspectorPC            text=\ ▶ texthl=MatchParen linehl=CursorLine
sign define vimspectorPCBP          text=●▶  texthl=MatchParen linehl=CursorLine
sign define vimspectorNonActivePC   linehl=DiffAdd
sign define vimspectorCurrentThread text=▶   texthl=MatchParen linehl=CursorLine
sign define vimspectorCurrentFrame  text=▶   texthl=Special    linehl=CursorLine
If the signs don't display properly, your font probably doesn't contain these
glyphs. You can easily change them by defining the sign in your vimrc. For
example, you could put this in your vimrc to use some simple ASCII symbols:
sign define vimspectorBP text=o             texthl=WarningMsg
sign define vimspectorBPCond text=o?        texthl=WarningMsg
sign define vimspectorBPLog text=!!         texthl=SpellRare
sign define vimspectorBPDisabled text=o!    texthl=LineNr
sign define vimspectorPC text=\ >           texthl=MatchParen
sign define vimspectorPCBP text=o>          texthl=MatchParen
sign define vimspectorCurrentThread text=>  texthl=MatchParen
sign define vimspectorCurrentFrame text=> texthl=SpecialMany different plugins provide signs for various purposes. Examples include diagnostic signs for code errors, etc. Vim provides only a single priority to determine which sign should be displayed when multiple signs are placed at a single line. If you are finding that other signs are interfering with vimspector's (or vice-versa), you can customise the priority used by vimspector by setting the following dictionary:
let g:vimspector_sign_priority = {
  \   '<sign-name>': <priority>,
  \ }
For example:
let g:vimspector_sign_priority = {
  \    'vimspectorBP':          3,
  \    'vimspectorBPCond':      3,
  \    'vimspectorBPLog':       3,
  \    'vimspectorBPDisabled':  3,
  \    'vimspectorNonActivePC': 3,
  \    'vimspectorPC':          999,
  \    'vimspectorPCBP':        999,
  \ }
All keys are optional. If a sign is not customised, the default priority it used (as shown above).
See :help sign-priority. The default priority is 10, larger numbers override
smaller ones.
NOTE: The default vimspectorNonActivePC sign does not add any text to
the sign column, it simply adds a line highlight so that you can see the lines
where other threads or processes are currently stopped. As a result this sign
normally should merge with any sign that adds a symbol (such as a breakpoint
sign). Vim will only merge the properties of signs with the same priority, so
if changing the default priorities, it's recommended that:
- All the breakpoint signs (
vimspectorBP,vimspectorBPCond, etc.) have the same priority. - You also set the
vimspectorNonActivePCsign that same priority - Active PC (
vimspectorPC,vimspectorPCBP, etc.) have a higher priority.
NOTE: This customisation point is currently unsable and may change at any time.
Sometimes the Debug Adapter provides hints as to how the UI should display certain things. This includes stack frames, variables etc.
Vimspector provides a simple way to customise how these are displayed, by
setting values in the dictionary g:vimsepctor_presentation_hint_hl.
The following keys are supported with the mentioned default highlight group.
| Group | Key | Usage | Default |
|---|---|---|---|
| all | normal |
anything not covered below | Normal |
| Stack trace | emphasize |
emphasize sources in stack trace | Title |
| Stack trace | deemphasize |
deemphasize sources in stack trace | Conceal |
| Stack trace | label |
stack frames which are "labels", not representing actual frames | NonText |
| Stack trace | subtle |
stack frames which are internal or not interesting | Conceal |
| Scopes | arguments |
Function arguments scope | Title |
| Scopes | locals |
Local variables scope | Title |
| Scopes | registers |
Registers scope | Title |
| Variables | property |
Function arguments scope | Identifier |
| Variables | method |
Local variables scope | Function |
| Variables | class |
Registers scope | Type |
| Variables | data |
Registers scope | String |
In addition, any value supplied in the DAP VariablePresentationHint can be set
which will be used if supplied by the debug adapter.
A silly example; the defaults should probably be OK for most colour scehemes:
let g:vimspector_presentation_hint_hl = {
  \    'normal': 'Identifier',
  \    'label':  'Title',
\ }Please Note: This customisation API is unstable, meaning that it may change at any time. I will endeavour to reduce the impact of this and announce changes in Gitter.
The following options control the default sizes of the UI windows (all of them are numbers)
g:vimspector_sidebar_width(default: 50 columns): The width in columns of the left utility windows (variables, watches, stack trace)g:vimspector_bottombar_height(default 10 lines): The height in rows of the output window below the code window.
Example:
let g:vimspector_sidebar_width = 75
let g:vimspector_bottombar_height = 15The terminal is typically created as a vertical split to the right of the code window, and that window is re-used for subsequent terminal buffers. The following control the sizing of the terminal window used for debuggee input/output when using Vim's built-in terminal.
g:vimspector_code_minwidth(default: 82 columns): Minimum number of columns to try and maintain for the code window when splitting to create the terminal window.g:vimspector_terminal_maxwidth(default: 80 columns): Maximum number of columns to use for the terminal.g:vimspector_terminal_minwidth(default: 10 columns): Minimum number of columns to use when it is not possible to fitg:vimspector_terminal_maxwidthcolumns for the terminal.
That's a lot of options, but essentially we try to make sure that there are at
least g:vimspector_code_minwidth columns for the main code window and that the
terminal is no wider than g:vimspector_terminal_maxwidth columns.
g:vimspector_terminal_minwidth is there to ensure that there's a reasonable
number of columns for the terminal even when there isn't enough horizontal space
to satisfy the other constraints.
Example:
let g:vimspector_code_minwidth = 90
let g:vimspector_terminal_maxwidth = 75
let g:vimspector_terminal_minwidth = 20It's useful to be able to define mappings only while debugging and remove those
mappings when debugging is complete. For this purpose, Vimspector provides 2
User autocommands:
VimspectorJumpedToFrame- triggered whenever a 'break' event happens, or when selecting a stack from to jump to. This can be used to create (for example) buffer-local mappings for any files opened in the code window.VimspectorDebugEnded- triggered when the debug session is terminated (actually when Vimspector is fully reset)
An example way to use this is included in support/custom_ui_vimrc. In there,
these autocommands are used to create buffer-local mappings for any files
visited while debugging and to clear them when completing debugging. This is
particularly useful for commands like <Plug>VimspectorBalloonEval which only
make sense while debugging (and only in the code window). Check the commented
section Custom mappings while debugging.
NOTE: This is a fairly advanced feature requiring some nontrivial vimscript. It's possible that this feature will be incorporated into Vimspector in future as it is a common requirement.
In many cases you will want to rebuild your project before starting a new debugging session. Vimspector is not a task manager and implementing this functionality is out of the scope of this project. However, there are some strategies described in the community wiki to achieve similar functionality.
You can tell vimspector not to draw the WinBar (the toolbars in the code, variables, output, etc. windows) by setting:
let g:vimspector_enable_winbar=0The WinBar is in any case not displayed if the mouse is not enabled.
Please Note: This customisation API is unstable, meaning that it may change at any time. I will endeavour to reduce the impact of this and announce changes in Gitter.
The above customisation of window sizes is limited intentionally to keep things
simple. Vimspector also provides a way for you to customise the UI without
restrictions, by running a User autocommand just after creating the UI or
opening the terminal. This requires you to write some vimscript, but allows you
to do things like:
- Hide a particular window or windows
- Move a particular window or windows
- Resize windows
- Have multiple windows for a particular buffer (say, you want 2 watch windows)
- etc.
You can essentially do anything you could do manually by writing a little vimscript code.
The User autocommand is raised with pattern set with the following values:
VimspectorUICreated: Just after setting up the UI for a debug sessionVimspectorTerminalOpened: Just after opening the terminal window for program input/output.
The following global variable is set up for you to get access to the UI
elements: g:vimspector_session_windows. This is a dict with the following
keys:
g:vimspector_session_windows.tabpage: The tab page for the sessiong:vimspector_session_windows.variables: Window ID of the variables window, containing thevimspector.Variablesbuffer.g:vimspector_session_windows.watches: Window ID of the watches window, containing thevimspector.Watchesbuffer.g:vimspector_session_windows.stack_trace: Window ID of the stack trade window containing thevimspector.StackTracebuffer.g:vimspector_session_windows.code: Window ID of the code window.g:vimspector_session_windows.output: Window ID of the output window.
In addition, the following key is added when triggering the
VimspectorTerminalOpened event:
g:vimspector_session_windows.terminal: Window ID of the terminal window
You can even customise the WinBar buttons by simply running the usual menu
(and unmenu) commands.
By default, Vimspector uses something a bit like this:
nnoremenu WinBar.■\ Stop :call vimspector#Stop( { 'interactive': v:false } )<CR>
nnoremenu WinBar.▶\ Cont :call vimspector#Continue()<CR>
nnoremenu WinBar.▷\ Pause :call vimspector#Pause()<CR>
nnoremenu WinBar.↷\ Next :call vimspector#StepOver()<CR>
nnoremenu WinBar.→\ Step :call vimspector#StepInto()<CR>
nnoremenu WinBar.←\ Out :call vimspector#StepOut()<CR>
nnoremenu WinBar.⟲: :call vimspector#Restart()<CR>
nnoremenu WinBar.✕ :call vimspector#Reset( { 'interactive': v:false } )<CR>
If you prefer a different layout or if the unicode symbols don't render
correctly in your font, you can customise this in the VimspectorUICreated
autocommand, for example:
func! CustomiseUI()
  call win_gotoid( g:vimspector_session_windows.code )
  " Clear the existing WinBar created by Vimspector
  nunmenu WinBar
  " Create our own WinBar
  nnoremenu WinBar.Kill :call vimspector#Stop( { 'interactive': v:true } )<CR>
  nnoremenu WinBar.Continue :call vimspector#Continue()<CR>
  nnoremenu WinBar.Pause :call vimspector#Pause()<CR>
  nnoremenu WinBar.Step\ Over  :call vimspector#StepOver()<CR>
  nnoremenu WinBar.Step\ In :call vimspector#StepInto()<CR>
  nnoremenu WinBar.Step\ Out :call vimspector#StepOut()<CR>
  nnoremenu WinBar.Restart :call vimspector#Restart()<CR>
  nnoremenu WinBar.Exit :call vimspector#Reset()<CR>
endfunction

augroup MyVimspectorUICustomistaion
  autocmd!
  autocmd User VimspectorUICreated call s:CustomiseUI()
augroup ENDThere is some example code in support/custom_ui_vimrc showing how you can use
the window IDs to modify various aspects of the UI using some basic vim
commands, primarily win_gotoid function and the wincmd ex command.
To try this out vim -Nu support/custom_ui_vimrc <some file>.
Here's a rather smaller example. A simple way to use this is to drop it into a
file named my_vimspector_ui.vim in ~/.vim/plugin (or paste into your
vimrc):
" Set the basic sizes
let g:vimspector_sidebar_width = 80
let g:vimspector_code_minwidth = 85
let g:vimspector_terminal_minwidth = 75

function! s:CustomiseUI()
  " Customise the basic UI...

  " Close the output window
  call win_gotoid( g:vimspector_session_windows.output )
  q
endfunction

function s:SetUpTerminal()
  " Customise the terminal window size/position
  " For some reasons terminal buffers in Neovim have line numbers
  call win_gotoid( g:vimspector_session_windows.terminal )
  set norelativenumber nonumber
endfunction

augroup MyVimspectorUICustomistaion
  autocmd!
  autocmd User VimspectorUICreated call s:CustomiseUI()
  autocmd User VimspectorTerminalOpened call s:SetUpTerminal()
augroup END- Q: Does it work with this language? A: Probably, but it won't
necessarily be easy to work out what to put in the
.vimspector.json. As you can see above, some of the servers aren't really editor agnostic, and require very-specific unique handling. See the wiki for details on additional language support - How do I stop it starting a new Terminal.app on macOS? See this comment
- Can I specify answers to the annoying questions about exception breakpoints
in my
.vimspector.json? Yes, see here. - Do I have to specify the file to execute in
.vimspector.json, or could it be the current vim file? You don't need to. You can specify $file for the current active file. See here for complete list of replacements in the configuration file. - You allow comments in
.vimspector.json, but Vim highlights these as errors, do you know how to make this not-an-error? Yes, put this in~/.vim/after/syntax/json.vim:
syn region jsonComment start="/\*" end="\*/"
hi link jsonCommentError Comment
hi link jsonComment Comment- What is the difference between a
gadgetand anadapter? A gadget is something you install with:VimspectorInstallorinstall_gadget.py, anadapteris something that Vimspector talks to (actually it's the Vimspector config describing that thing). These are usually one-to-one, but in theory a single gadget can supply multipleadapterconfigs. Typically this happens when agadgetsupplies differentadapterconfig for, say remote debugging, or debugging in a container, etc. - The signs and winbar display funny symbols. How do I fix them? See this and this
- What's this telemetry stuff all about? Are you sending my data to evil companies? Debug adapters (for some reason) send telemetry data to clients. Vimspector simply displays this information in the output window. It does not and will not ever collect, use, forward or otherwise share any data with any third parties.
- Do I have to put a
.vimspector.jsonin the root of every project? No, you can useg:vimspector_adaptersandg:vimspector_configurationsor put all of your adapter and debug configs in a single directory if you want to, but note the caveat that${workspaceRoot}won't be calculated correctly in that case. The vimsepctor author uses this a lot - I'm confused about remote debugging configuration, can you explain it? eh... kind of. Reference: https://puremourning.github.io/vimspector/configuration.html#remote-debugging-support. Some explanations here too: #478 (comment)
- I'm trying to debug a Django (django?) project and it's not working. Can you help? sure, check this link which has a working example. Or google it.
- Can vimspector build my code before debugging it? Can I deploy it to a remote host before debugging it? No, not really. Vimspector is just a debugger, not a task system or build automation system - there are other tools for that. There is however a hack you can use - you can use a 'shell' variable to execute a command and just discard the output. Other options are discussed in this issue
- It's annoying to manually type in the PID when attaching. Do you have a PID picker? There's no PID picker in vimspector at the moment, but you could write something and wrap
vimspector#LaunchWithSettings( { 'ThePID': the_pid_i_picked } ). Alternatively, you could use ashellvariable to guess the PID, like this (which runspgrep vim | sort | tail -1to get the 'highest' PID of the command to be debugged (NOTE: this is for debugging Vim. replace with something appropriate to your actual use case. If this doesn't make sense to you, you might be better off just typing in the PID).
    "Attach: max PID": {
      "adapter": "CodeLLDB",
      "variables": {
        "pid": {
          "shell": [
            "/bin/bash",
            "-c",
            "pgrep vim | sort | tail -1"
          ]
        }
      },
      "configuration": {
        "request": "attach",
        "program": "${workspaceRoot}/src/vim",
        "expressions": "native",
        "stopOnEntry#json": "${StopOnEntry:true}",
        "pid": "${pid}"
      }
    },
Example g:vimspector_adapters and g:vimspector_configurations:
let g:vimspector_adapters = #{
      \   test_debugpy: #{ extends: 'debugpy' }
      \ }

let g:vimspector_configurations = {
      \ "test_debugpy_config": {
      \   "adapter": "test_debugpy",
      \   "filetypes": [ "python" ],
      \   "configuration": {
      \     "request": "launch",
      \     "type": "python",
      \     "cwd": "${fileDirname}",
      \     "args": [],
      \     "program": "${file}",
      \     "stopOnEntry": v:false,
      \     "console": "integratedTerminal",
      \     "integer": 123,
      \   },
      \   "breakpoints": {
      \     "exception": {
      \       "raised": "N",
      \       "uncaught": "",
      \       "userUnhandled": ""
      \     }
      \   }
      \ } }


![dependabot[bot] avatar](https://avatars.githubusercontent.com/in/29110?v=4 "dependabot[bot]")


![mergify[bot] avatar](https://avatars.githubusercontent.com/in/10562?v=4 "mergify[bot]")