

Here I will consider the rubric points individually and describe how I addressed each point in my implementation.
1. Provide a Writeup / README that includes all the rubric points and how you addressed each one. You can submit your writeup as markdown or pdf. You can use this template as a guide for writing the report. The submission includes the project code.
You're reading it! and here is a link to my project code
1. Provide a basic summary of the data set. In the code, the analysis should be done using python, numpy and/or pandas methods rather than hardcoding results manually.
The Dataset used is German Traffic Signs Dataset which contains images of the shape (32x32x3) i.e. RGB images. I used the Numpy library to calculate summary statistics of the traffic signs data set:
- The size of training set is 34799
- The size of the validation set is 4410
- The size of test set is 12630
- The shape of a traffic sign image is (32, 32, 3)
- The number of unique classes/labels in the data set is 43
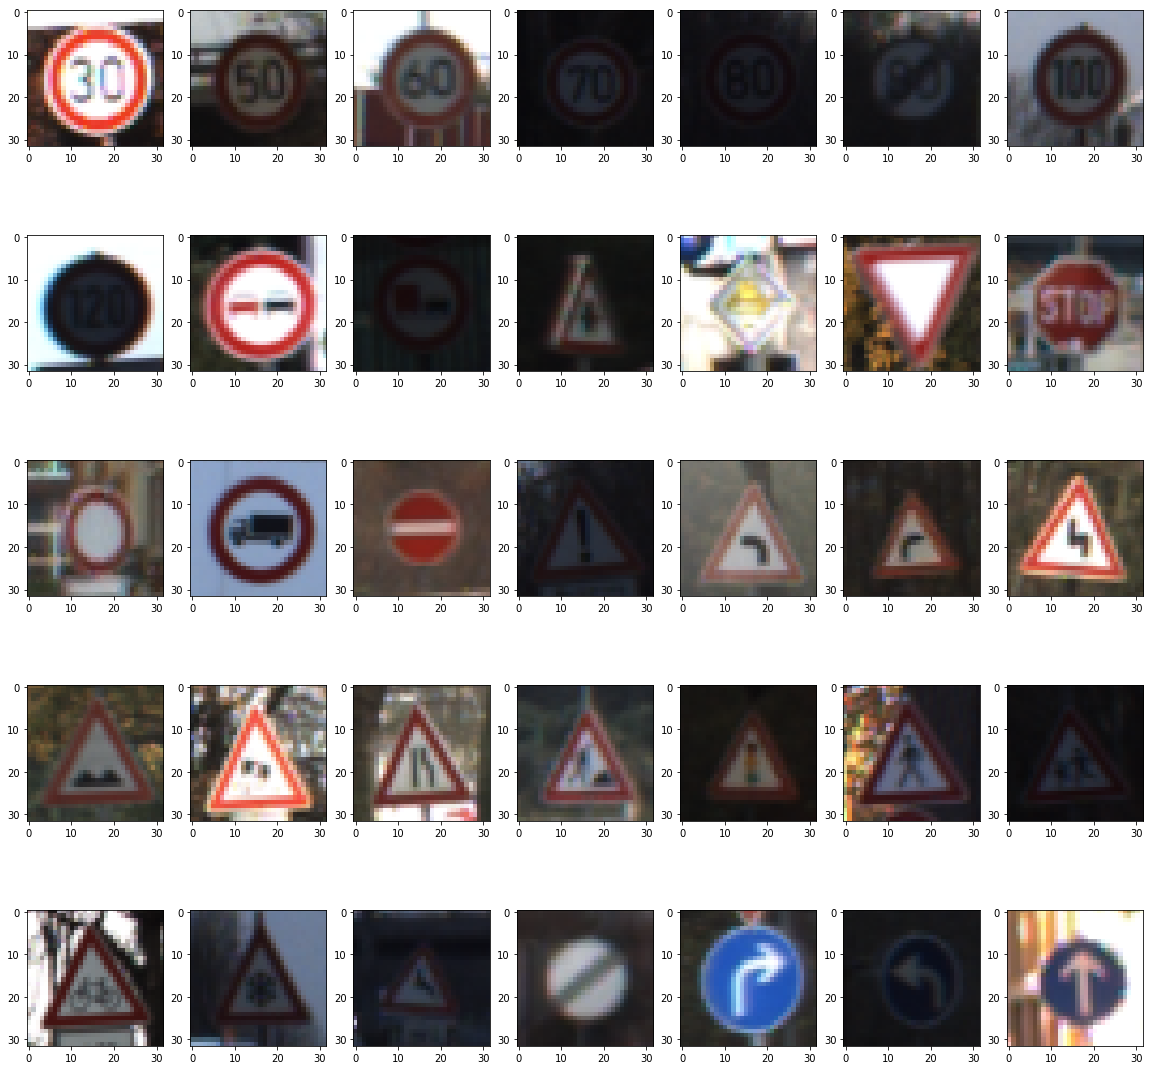
Visualization of the dataset is done in two parts. In the first part, a very simple basic approach is taken to display a single image from the dataset. After that, there is an exploratory visualization of the data set, by drawing the first image of 35 classes, 43 classes in total.
1. Describe how you preprocessed the image data. What techniques were chosen and why did you choose these techniques? Consider including images showing the output of each preprocessing technique. Pre-processing refers to techniques such as converting to grayscale, normalization, etc. (OPTIONAL: As described in the "Stand Out Suggestions" part of the rubric, if you generated additional data for training, describe why you decided to generate additional data, how you generated the data, and provide example images of the additional data. Then describe the characteristics of the augmented training set like number of images in the set, number of images for each class, etc.)
As a first step, I decided to shuffle my X_train, y_train. Then, I used Normalization as one of the preprocessing technique. In which, the dataset (X_train, X_test, X_valid) is fed into the normalization(x_label) function which converts all the data and returns the normalized one.
2. Describe what your final model architecture looks like including model type, layers, layer sizes, connectivity, etc.) Consider including a diagram and/or table describing the final model.
My final model consisted of the following layers:
| Layer | Description |
|---|---|
| Input | 32x32x3 RGB image |
| Convolution Layer 1 | Outputs 28x28x6 |
| RELU | Activation applied to output of layer 1 |
| Pooling | Input = 28x28x6, Output = 14x14x6 |
| Convolution Layer 2 | Outputs 10x10x16 |
| RELU | Activation applied to output of layer 2 |
| Pooling | Input = 10x10x16, Output = 5x5x16 |
| Flatten | Input = 5x5x16, Output =400 |
| Fully Connected Layer 1 | Input = 400, Output = 120 |
| RELU | Activation applied to output of Fully Connected layer 1 |
| Fully Connected Layer 2 | Input = 120, Output = 84 |
| RELU | Activation applied to output of Fully Connected layer 2 |
| Fully Connected Layer 3 | Input = 84, Output = 43 |
3. Describe how you trained your model. The discussion can include the type of optimizer, the batch size, number of epochs and any hyperparameters such as learning rate.
To train the model, I used: EPOCHS = 20, BATCH_SIZE = 128, rate = 0.001, mu = 0, sigma = 0.1. I used the same LeNet model architecture which consists of two convolutional layers and three fully connected layers. The input is an image of size (32x32x3) and output is 43 i.e. the total number of distinct classes. In the middle, I used RELU activation function after each convolutional layer as well as the first two fully connected layers. Flatten is used to convert the output of 2nd convolutional layer after pooling i.e. 5x5x16 into 400. Pooling is also done in between after the 1st and the 2nd convolutional layer. The training of the model is calculated in cell 13 and the model architecture is defined in cell 9.
4. Describe the approach taken for finding a solution and getting the validation set accuracy to be at least 0.93. Include in the discussion the results on the training, validation and test sets and where in the code these were calculated. Your approach may have been an iterative process, in which case, outline the steps you took to get to the final solution and why you chose those steps. Perhaps your solution involved an already well known implementation or architecture. In this case, discuss why you think the architecture is suitable for the current problem.
My final model results were:
- validation set accuracy of 0.975
I used normalized images to train the model and the number of EPOCHS=20 and the BATCH_SIZE=128. With the use of the defined hyperparameters, the validation set accuracy is 0.975 which is more than the 0.93 benchmark. EPOCHS and BATCH_SIZE are defined in cell 7 and the normalization of the dataset is done in cell 8. Moreover, the shuffling of the dataset is done in cell 6. Further, the model has an accuracy of 0.625 on the eight downloaded images of german traffic signs from the web.
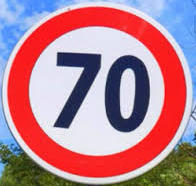
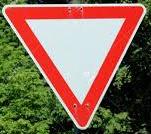
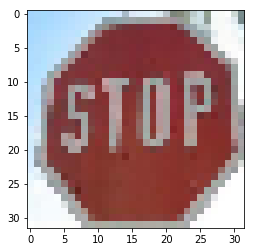
1. Choose five German traffic signs found on the web and provide them in the report. For each image, discuss what quality or qualities might be difficult to classify.


2. Discuss the model's predictions on these new traffic signs and compare the results to predicting on the test set. At a minimum, discuss what the predictions were, the accuracy on these new predictions, and compare the accuracy to the accuracy on the test set (OPTIONAL: Discuss the results in more detail as described in the "Stand Out Suggestions" part of the rubric).
Here are the results of the prediction on the eight german traffic signs:
| Image | Prediction |
|---|---|
| Yield | Yield |
| Stop | Stop |
| Stop | Stop |
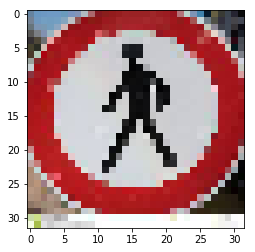
| Pedestrians | Speed limit (50km/h) |
| Road Work | Road Work |
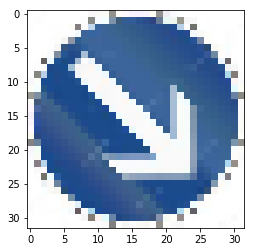
| Keep right | Yield |
| Speed limit (70km/h) | Bicycles crossing |
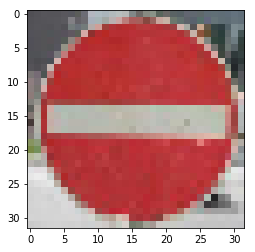
| No entry | No entry |
The model was able to correctly guess 5 of the 8 traffic signs. Test Accuracy on new loaded images = 0.625.
3. Describe how certain the model is when predicting on each of the five new images by looking at the softmax probabilities for each prediction. Provide the top 5 softmax probabilities for each image along with the sign type of each probability. (OPTIONAL: as described in the "Stand Out Suggestions" part of the rubric, visualizations can also be provided such as bar charts)
The code for making predictions on my final model is located in the 15th cell of the Ipython notebook and the code for evaluating the accuracy on these new downloaded images is displayed in cell number 16.
For the first image, the model is sure that this is a yield sign (probability of 1), and the image do contain a stop sign. Hence, predicted correctly. The top five soft max probabilities were:
| Probability | Prediction |
|---|---|
| 1 | yield sign |
| 0 | for any other sign |
For the second and the third image, the model is sure that this is a stop sign (probability of 1), and the image do contain a stop sign. Hence, predicted correctly. The top five soft max probabilities were:
| Probability | Prediction |
|---|---|
| 1 | stop sign |
| 0 | for any other sign |
For the fourth image, the model is sure that this is a Speed limit (50km/h) sign (probability of 1), and the image does not contain a Speed limit (50km/h) sign. Hence, not predicted correctly. The top five soft max probabilities were:
| Probability | Prediction |
|---|---|
| 1 | Speed limit (50km/h) |
| 0 | for any other sign |
For the fifth image, the model is sure that this is a Road Work sign (probability of 1), and the image do contain a Road Work sign. Hence, predicted correctly. The top five soft max probabilities were:
| Probability | Prediction |
|---|---|
| 1 | Road Work |
| 0 | for any other sign |
For the sixth image, the model is sure that this is a yield sign (probability of 1), and the image do not contain a yield sign. Hence, not predicted correctly. The top five soft max probabilities were:
| Probability | Prediction |
|---|---|
| 1 | yield |
| 0 | for any other sign |
For the seventh image, the model is sure that this is a Bicycles crossing sign (probability of 1), and the image do not contain a Bicycles crossing sign. Hence, not predicted correctly. The top five soft max probabilities were:
| Probability | Prediction |
|---|---|
| 1 | Bicycles crossing |
| 0 | for any other sign |
For the eight image, the model is sure that this is a No entry sign (probability of 1), and the image do contain a No entry sign. Hence, predicted correctly. The top five soft max probabilities were:
| Probability | Prediction |
|---|---|
| 1 | No entry |
| 0 | for any other sign |


