Giter Club home page Giter Club logo

django-chartjs's Introduction

Django Chartjs

Django Chartjs lets you manage charts in your Django application.

https://travis-ci.org/peopledoc/django-chartjs.svg?branch=master https://coveralls.io/repos/peopledoc/django-chartjs/badge.png?branch=master&style=flat

This is compatible with Chart.js and Highcharts JS libraries.

Using a set of predefined Class Based Views you are able to get started after writing just your SQL query.

Getting Started

Install django-chartjs:

pip install django-chartjs

Add it to your INSTALLED_APPS settings:

INSTALLED_APPS = (
    '...',
    'chartjs',
)

Using it

A simple Line Chart example.

1. Create the HTML file

{% load static %}
<html>
    <head>
        <title>django-chartjs line chart demo</title>
        <!--[if lte IE 8]>
            <script src="{% static 'js/excanvas.js' %}"></script>
        <![endif]-->
    </head>
    <body>
        <h1>Some Line Charts loaded in Ajax!</h1>

        <canvas id="myChart" width="500" height="400"></canvas>

        <script type="text/javascript" src="http://code.jquery.com/jquery-1.10.0.min.js"></script>
        <script type="text/javascript" src="{% static 'js/Chart.min.js' %}"></script>
        <script type="text/javascript">
            $.get('{% url "line_chart_json" %}', function(data) {
                var ctx = $("#myChart").get(0).getContext("2d");
                new Chart(ctx, {
                    type: 'line', data: data
                });
            });
        </script>
    </body>
</html>

2. Create the view with labels and data definition

from django.views.generic import TemplateView
from chartjs.views.lines import BaseLineChartView


class LineChartJSONView(BaseLineChartView):
    def get_labels(self):
        """Return 7 labels for the x-axis."""
        return ["January", "February", "March", "April", "May", "June", "July"]

    def get_providers(self):
        """Return names of datasets."""
        return ["Central", "Eastside", "Westside"]

    def get_data(self):
        """Return 3 datasets to plot."""

        return [[75, 44, 92, 11, 44, 95, 35],
                [41, 92, 18, 3, 73, 87, 92],
                [87, 21, 94, 3, 90, 13, 65]]


line_chart = TemplateView.as_view(template_name='line_chart.html')
line_chart_json = LineChartJSONView.as_view()

3. Update urls.py with the new urls for TemplateView and AJAX call 'line_chart_json' as in chart.html

from .views import line_chart, line_chart_json

urlpatterns = [
  '...',
  path('chart', line_chart, name='line_chart'),
  path('chartJSON', line_chart_json, name='line_chart_json'),
]

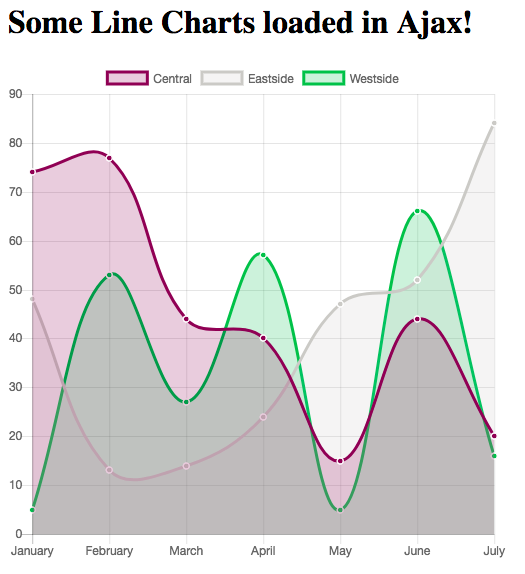
4. Get a Chart.js Line Chart

https://raw.github.com/peopledoc/django-chartjs/master/docs/_static/django-chartjs.png

It is that simple!

For other examples including a HighCharts line chart, don't hesitate to look at the demo project.

Also, feel free to contribute your demo!

django-chartjs's People

Contributors

benoitbryon avatar blackstar257 avatar brunobord avatar choller avatar cjohnson318 avatar danielvdp avatar dev-mehta avatar edras avatar eqqe avatar jibaku avatar johnfraney avatar mgu avatar mike-perdide avatar natim avatar penguin359 avatar robincherbonnier avatar

Stargazers

 avatar  avatar  avatar  avatar  avatar  avatar  avatar  avatar  avatar  avatar  avatar  avatar  avatar  avatar  avatar  avatar  avatar  avatar  avatar  avatar  avatar  avatar  avatar  avatar  avatar  avatar  avatar  avatar  avatar  avatar  avatar  avatar  avatar  avatar  avatar  avatar  avatar  avatar  avatar  avatar  avatar  avatar  avatar  avatar  avatar  avatar  avatar  avatar  avatar  avatar  avatar  avatar  avatar  avatar  avatar  avatar  avatar  avatar  avatar  avatar  avatar  avatar  avatar  avatar  avatar  avatar  avatar  avatar  avatar  avatar  avatar  avatar  avatar  avatar  avatar  avatar  avatar  avatar  avatar  avatar  avatar  avatar  avatar  avatar  avatar  avatar  avatar  avatar  avatar  avatar  avatar  avatar  avatar  avatar  avatar  avatar  avatar  avatar  avatar  avatar

Watchers

 avatar  avatar  avatar  avatar  avatar  avatar  avatar  avatar  avatar  avatar  avatar  avatar  avatar  avatar  avatar  avatar  avatar  avatar  avatar  avatar  avatar  avatar  avatar  avatar  avatar  avatar  avatar  avatar  avatar  avatar  avatar  avatar  avatar  avatar

django-chartjs's Issues

Chart display permission

Hi,

In order to display or not to display the chart for the current user, I overwrite the get_data method of BaseLineChartView class such as :

def get_data(self):
"""If not authorized, do not display chart"""
if not self.request.user.is_superuser:
return False

And this works and chart is not displayed as intended. But is there any other better practice for permission management?

Thank You

Issue in demo project.

Its using old version of chart.js line function in line_chart.html

Should be updated to
<script type="text/javascript">
$.get('{% url 'line_chart_json' %}', function(data) {
var ctx = $("#myChart").get(0).getContext("2d");
new Chart(ctx, {
type: "line",
data: data,
});
});
</script>

ask about issue NoReverseMatch

Hi ,
I follow your tutorial but I had problem:
NoReverseMatch at ...
Reverse for 'line_chart_json' with arguments '()' and keyword arguments '{}' not found. 0 pattern(s) tried: []
I try to fix several times but it still does not work, could you help me , please? Thank in advance.

How to get data?

I have a JSON file returned by another function in my "views.py" file and I'm trying to pass this JSON data to ChartMixin class, but I can't find a good way to do this, Any idea?

def simple_upload(request):
        ......
        return render(request, 'core/my_web.html', {'result_json' : result_json})

And this is the ChartMixin class:


class ChartMixin(object):
     def get_labels(self):
        """Return 7 labels."""
        return ["January", "February", "March", "April", "May", "June", "July"]

    def get_data(self):
        """Return 3 random dataset to plot."""
        def data():
            """Return 7 randint between 0 and 100."""
            return [randint(0, 100) for x in range(7)]

Makefile lacks demo target

The Makefile lacks a demo target, yet demo/README includes these instructions:

git clone [email protected]:novagile/django-chartjs.git
cd django-chartjs/
make demo

It installs and runs the demo server on localhost, port 8000. So have a look
at http://localhost:8000/

For someone unfamiliar with Django, a working demo would be great.

setup fails when LC_ALL=C is set

I believe the issue here is that when LC_ALL=C is set the encoding is switched to encodings/ascii.py and we get an error which is UnicodeDecodeError: 'ascii' codec can't decode byte 0xc3 in position 880: ordinal not in range(128). Here is the error trace:

File "/var/www/venv/eis/build/django-chartjs/setup.py", line 19, in <module>
long_description=read_relative_file('README.rst'),
File "/var/www/venv/eis/build/django-chartjs/setup.py", line 11, in read_relative_file
return f.read()
File "/var/www/venv/eis/lib/python3.4/encodings/ascii.py", line 26, in decode
return codecs.ascii_decode(input, self.errors)[0]
UnicodeDecodeError: 'ascii' codec can't decode byte 0xc3 in position 880: ordinal not in range(128)

Because ascii does not support some symbols used in the html which is the part of this README.rst we get the error. This is not an issue in the most of cases but makes impossible to install the module via some provisioning systems like SaltStack.

Highcharts license?

What license applies to the bundled version of Highcharts? Highcharts has been non-free software for quite a while and requires a license for non-commercial use. Unfortunately, the link in the highcharts.js file (www.highcharts.com/license) is dead.

Doughnut chart is uniformly grey

Hi,

I'm implementing a doughnut chart, all labels and areas appears grey : the default colors does not applies to the chart.

How can I set colors to both labels and areas ?

Thanks !

Support for Anaconda Python 3.7

I would like to use django-chartjs with the current Anaconda release.
Cannot build the demo, would the framework as such work ?
Cheers, Maria

Highcharts implementation

Hi, I'm trying to show a Highcharts spline chart based on the demo code provided here but I'm getting this error: Uncaught TypeError: Cannot read property 'draw' of undefinedi.Type.extend.draw @ Chart.min.js:11l @ Chart.min.js:10

Could you guys upload a fully functional highcharts example?

Thanks!

Class naming inconsistent

For example, Highcharts versus Highchart versus HighCharts (the first is correct as per their website), and the use of the Base prefix. I would propose something like this:

  • HighChartsView -> HighchartsView
  • BaseColumnsHighChartsView -> HighchartsColumnView
  • HighchartPlotLineChartView -> HighchartsLineView
  • HighChartPieView -> HighchartsPieView
  • HighChartDonutView -> HighchartsDonutView

Additionally, BaseLineChartView isn't subclassed by anything - should it be (maybe HighchartPlotLineChartView)?

if a dictionary value is "lazy", its JSON representation is wrong

let's say we're using a HighChartsView, with a translatable title.

class GraphCategorie(HighchartPlotLineChartView):
    title = _('Hello world')

if "_" is lazy, here is its JSON dump on the client-size:

text: "<django.utils.functional.__proxy__ object at 0x307af10>"

Right, the textual representation of the function. because of:

https://github.com/novapost/django-chartjs/blob/7aeef6f3e86398b35d0090d994288cc00a152a79/chartjs/views/base.py#L15

the poor's man fix was to use the "unicode" function in the HighChartsView.get_context_data method, but python 3.3 doesn't like it much.

ModuleNotFoundError: No module named 'chatjs'

I've installed with this: pip3 install django-chartjs.

This is how I import on INSTALLED_APPS:

INSTALLED_APPS = [
    'chatjs',
    'rest.apps.RestConfig',
    'interface.apps.InterfaceConfig',
    'django.contrib.admin',
    'django.contrib.auth',
    'django.contrib.contenttypes',
    'django.contrib.sessions',
    'django.contrib.messages',
    'django.contrib.staticfiles',
]

This is the error obtained from django:

Unhandled exception in thread started by <function check_errors.<locals>.wrapper at 0x1038e46a8>
Traceback (most recent call last):
  File "/usr/local/lib/python3.6/site-packages/django/utils/autoreload.py", line 225, in wrapper
    fn(*args, **kwargs)
  File "/usr/local/lib/python3.6/site-packages/django/core/management/commands/runserver.py", line 112, in inner_run
    autoreload.raise_last_exception()
  File "/usr/local/lib/python3.6/site-packages/django/utils/autoreload.py", line 248, in raise_last_exception
    raise _exception[1]
  File "/usr/local/lib/python3.6/site-packages/django/core/management/__init__.py", line 327, in execute
    autoreload.check_errors(django.setup)()
  File "/usr/local/lib/python3.6/site-packages/django/utils/autoreload.py", line 225, in wrapper
    fn(*args, **kwargs)
  File "/usr/local/lib/python3.6/site-packages/django/__init__.py", line 24, in setup
    apps.populate(settings.INSTALLED_APPS)
  File "/usr/local/lib/python3.6/site-packages/django/apps/registry.py", line 89, in populate
    app_config = AppConfig.create(entry)
  File "/usr/local/lib/python3.6/site-packages/django/apps/config.py", line 90, in create
    module = import_module(entry)
  File "/usr/local/Cellar/python/3.6.5/Frameworks/Python.framework/Versions/3.6/lib/python3.6/importlib/__init__.py", line 126, in import_module
    return _bootstrap._gcd_import(name[level:], package, level)
  File "<frozen importlib._bootstrap>", line 994, in _gcd_import
  File "<frozen importlib._bootstrap>", line 971, in _find_and_load
  File "<frozen importlib._bootstrap>", line 953, in _find_and_load_unlocked
ModuleNotFoundError: No module named 'chatjs'
Unhandled exception in thread started by <function check_errors.<locals>.wrapper at 0x1118e66a8>
Traceback (most recent call last):
  File "/usr/local/lib/python3.6/site-packages/django/utils/autoreload.py", line 225, in wrapper
    fn(*args, **kwargs)
  File "/usr/local/lib/python3.6/site-packages/django/core/management/commands/runserver.py", line 112, in inner_run
    autoreload.raise_last_exception()
  File "/usr/local/lib/python3.6/site-packages/django/utils/autoreload.py", line 248, in raise_last_exception
    raise _exception[1]
  File "/usr/local/lib/python3.6/site-packages/django/core/management/__init__.py", line 327, in execute
    autoreload.check_errors(django.setup)()
  File "/usr/local/lib/python3.6/site-packages/django/utils/autoreload.py", line 225, in wrapper
    fn(*args, **kwargs)
  File "/usr/local/lib/python3.6/site-packages/django/__init__.py", line 24, in setup
    apps.populate(settings.INSTALLED_APPS)
  File "/usr/local/lib/python3.6/site-packages/django/apps/registry.py", line 89, in populate
    app_config = AppConfig.create(entry)
  File "/usr/local/lib/python3.6/site-packages/django/apps/config.py", line 90, in create
    module = import_module(entry)
  File "/usr/local/Cellar/python/3.6.5/Frameworks/Python.framework/Versions/3.6/lib/python3.6/importlib/__init__.py", line 126, in import_module
    return _bootstrap._gcd_import(name[level:], package, level)
  File "<frozen importlib._bootstrap>", line 994, in _gcd_import
  File "<frozen importlib._bootstrap>", line 971, in _find_and_load
  File "<frozen importlib._bootstrap>", line 953, in _find_and_load_unlocked
ModuleNotFoundError: No module named 'django-chartjs'
Unhandled exception in thread started by <function check_errors.<locals>.wrapper at 0x1041a86a8>
Traceback (most recent call last):
  File "/usr/local/lib/python3.6/site-packages/django/utils/autoreload.py", line 225, in wrapper
    fn(*args, **kwargs)
  File "/usr/local/lib/python3.6/site-packages/django/core/management/commands/runserver.py", line 112, in inner_run
    autoreload.raise_last_exception()
  File "/usr/local/lib/python3.6/site-packages/django/utils/autoreload.py", line 248, in raise_last_exception
    raise _exception[1]
  File "/usr/local/lib/python3.6/site-packages/django/core/management/__init__.py", line 327, in execute
    autoreload.check_errors(django.setup)()
  File "/usr/local/lib/python3.6/site-packages/django/utils/autoreload.py", line 225, in wrapper
    fn(*args, **kwargs)
  File "/usr/local/lib/python3.6/site-packages/django/__init__.py", line 24, in setup
    apps.populate(settings.INSTALLED_APPS)
  File "/usr/local/lib/python3.6/site-packages/django/apps/registry.py", line 89, in populate
    app_config = AppConfig.create(entry)
  File "/usr/local/lib/python3.6/site-packages/django/apps/config.py", line 90, in create
    module = import_module(entry)
  File "/usr/local/Cellar/python/3.6.5/Frameworks/Python.framework/Versions/3.6/lib/python3.6/importlib/__init__.py", line 126, in import_module
    return _bootstrap._gcd_import(name[level:], package, level)
  File "<frozen importlib._bootstrap>", line 994, in _gcd_import
  File "<frozen importlib._bootstrap>", line 971, in _find_and_load
  File "<frozen importlib._bootstrap>", line 953, in _find_and_load_unlocked
ModuleNotFoundError: No module named 'chatjs'

Bar chart is not working? What am I doing wrong?

My view:

class BarChartJSONView(BaseColumnsHighChartsView):
    def get_title(self):
        return "Testing bar charts"

    def get_labels(self):
        return ['Africa', 'America', 'Asia', 'Europe', 'Oceania']

    def get_yUnit(self):
        return "What is this?!"

    def get_providers(self):
        return ["Year 1800", "Year 1900", "Year 2000"]

    def get_data(self):
        return [[107, 31, 635, 203, 2], [133, 156, 947, 408, 6], [1052, 954, 4250, 740, 38]]

My url:

    path('chartJSON', views.BarChartJSONView.as_view(), name='bar_chart_json'),

Template:

    <script type="text/javascript">
        $.get('{% url "accounts:bar_chart_json" %}', function(data) {
            var ctx = $("#myChart").get(0).getContext("2d");
            new Chart(ctx, {
                type: 'bar', data: data
            });
        });
    </script>

Line chart works fine, but just a simple change to implement a bar chart just returns a grid with 1.0 max on Y axis.

Multiple get_data() Calls from API

I'd like to discuss a piece of code found in the current build:
/chartjs/views/lines.py

Synopsis: Two calls are being made to get_data(), slowing down my response time.
How do I know this is a problem? See bottom of page on how to reproduce this issue.

Use Case, or Why this is a problem:
My custom get_data() function depends heavily on aggregating a lot of data. In some cases, the aggregation could take a couple of seconds. If this function is called twice, that doubles the response time. Aggregation must be handled in the get_data() function to pass the info along to the chart.

Situation Summary:
The stub is in my chart mixin, the function called is get_data().

From lines.py

code

Is it possible to reduce this to one function call to save my database some stress?

Testing to find this issue (how to reproduce):
I did run-time testing using print commands in the custom get_data() function where the console reported twice for the same event on invoking the mix-in once by ajax. Confirmed single invocation in the debugger.
To track specifically where this was coming from, I inserted:
if name == 'main'
above the "def get_data()" in my mix-in. It was able to track down the caller, which came from /chartjs/views/lines.py where this module is located.

Suggestions? Anyone want to take a crack at it?

BaseLineOptionsChartView: Need an option `callback` for y-axes ticks to line chart

I am trying to configure line chart options, for formatting y-axes tick values.

class LineChartJSONView(BaseLineOptionsChartView):
    
    ...
    ## I have implemented `get_labels` & `get_data` functions
    ...

    def get_options(self):
        return {
            "responsive": True,
            "scales": {
                "xAxes": [{
                    "scaleLabel": {
                        "display": True,
                        "labelString": "Daily"
                    }
                }],
                "yAxes": [{
                    "scaleLabel": {
                        "display": True,
                        "labelString": 'Count'
                    },
                    "ticks": {
                        "beginAtZero": True,

                         ## Need to pass function from `dict`
                        "callback": function (value) { if (value % 1 === 0) { return value; } }
                    }
                }],
            },
        }

line_chart_json = LineChartJSONView.as_view()

I have called line_chart_json in template.

...
<html>
    <canvas id="myChart" width="500" height="400"></canvas>
    ...
<script type="text/javascript">
    $.get('{% url "line_chart_json" %}', function (response) {
        var ctx = $("#myChart").get(0).getContext("2d");
        new Chart(ctx, {
            type: 'line',
            data: response.data,
            options: response.options
        });
    });

</script>
</html>

Chart.min.js is too old

Chart.js 1.0.2 released 27 days ago. Please update your static. Chart.min.js bundled with package does not contain even an .addData (valuesArray, label).

chartjs-plugin-zoom not working

I'm trying to integrate chartjs-plugin-zoom plugin with my canvas in my django application .I'm getting dataset values from backend API .Canvas is rendered but pan and zoom is not working . There is no error on the console.

<script src="https://cdn.jsdelivr.net/npm/[email protected]"></script> <script src="https://cdn.jsdelivr.net/npm/[email protected]"></script> <script src="https://cdn.jsdelivr.net/npm/[email protected]"></script>

CPU/Mem

    <div class='col-' id="chart-container" class="myChartDiv">
        <canvas id="myChart" width="600" height="400"></canvas>
    </div>
</div>
</div>

<script> var ctx = document.getElementById('myChart') var myChart = new Chart(ctx, { type: 'line', data: { labels: labels, datasets: [{ label: 'CPU [avg:'+average(updatedCPU).toFixed(2)+'; min:'+Math.min.apply(null, updatedCPU)+'; max:'+Math.max.apply(null, updatedCPU)+'; {'+percentile+' percentile :'+quantile(updatedCPU, percentile/100).toFixed(2)+' }]', data: updated_cpu, backgroundColor: [ 'rgba(153, 102, 255, 0.2)' ], borderColor: [ 'rgba(153, 102, 255, 1)' ], borderWidth: 2, fill: false },{ label: 'CPS [avg:'+average(updatedCPS).toFixed(2)+'; min:'+Math.min.apply(null, updatedCPS)+'; max:'+Math.max.apply(null, updatedCPS)+'; {'+percentile+' percentile :'+quantile(updatedCPS, percentile/100)+' }]', data: updated_cps, yAxisID: 'A', backgroundColor: [ 'rgba(153, 1190, 255, 0.2)' ], borderColor: [ 'rgba(153, 1190, 255, 1)' ], borderWidth: 2 },{ label: 'Memory [avg:'+average(updatedMEM).toFixed(2)+'; min:'+Math.min.apply(null, updatedMEM)+'; max:'+Math.max.apply(null, updatedMEM)+'; {'+percentile+' percentile :'+quantile(updatedMEM, percentile/100).toFixed(2)+' }]', data: updated_mem, backgroundColor: [ 'rgba(255, 99, 132, 0.2)' ], borderColor: [ 'rgba(255, 99, 132, 1)' ], borderWidth: 2, fill: false }] }, options: { title: { display: true, text: 'PERFAnalyzer', fontColor: '#666' }, zoomEnabled: true, scales: { yAxes: [{ ticks: { beginAtZero: true }, scaleLabel: { display: true, labelString: 'CPU - Memory', fontSize: 12 } }, { id: 'A', type: 'linear', position: 'right', ticks: { min: 0 }, scaleLabel: { display: true, labelString: 'CPS', fontSize: 12 } } ], xAxes: [{ ticks: { beginAtZero: false, }, scaleLabel: { display: true, labelString: 'Date-Time', fontSize: 15 } }] }, plugins: { zoom: { pan: { enabled: true, mode: 'x' }, zoom: { enabled: true, //drag: true, mode: 'x', speed: 0.1, } } } } }) </script>

Recommend Projects

  • React photo React

    A declarative, efficient, and flexible JavaScript library for building user interfaces.

  • Vue.js photo Vue.js

    🖖 Vue.js is a progressive, incrementally-adoptable JavaScript framework for building UI on the web.

  • Typescript photo Typescript

    TypeScript is a superset of JavaScript that compiles to clean JavaScript output.

  • TensorFlow photo TensorFlow

    An Open Source Machine Learning Framework for Everyone

  • Django photo Django

    The Web framework for perfectionists with deadlines.

  • D3 photo D3

    Bring data to life with SVG, Canvas and HTML. 📊📈🎉

Recommend Topics

  • javascript

    JavaScript (JS) is a lightweight interpreted programming language with first-class functions.

  • web

    Some thing interesting about web. New door for the world.

  • server

    A server is a program made to process requests and deliver data to clients.

  • Machine learning

    Machine learning is a way of modeling and interpreting data that allows a piece of software to respond intelligently.

  • Game

    Some thing interesting about game, make everyone happy.

Recommend Org

  • Facebook photo Facebook

    We are working to build community through open source technology. NB: members must have two-factor auth.

  • Microsoft photo Microsoft

    Open source projects and samples from Microsoft.

  • Google photo Google

    Google ❤️ Open Source for everyone.

  • D3 photo D3

    Data-Driven Documents codes.