Comments (5)
 ozel
commented on May 24, 2024
ozel
commented on May 24, 2024
Hi!
The loading of .msgp files is at the moment implemented in a somewhat confusing way. You only need to do two things:
Set the full path name to variable file_name in line 88 and comment the line 117 such that it is disabled:
# df = pd.read_pickle(.... It is either a pickle file or a .mgsgp file that needs to be loaded, not both.
The if statement in line 90 should not be changed at all.
I am in the process of updating this script with a more simplified loading of data files/folders and other improvements that I will hopefully upload soon.
But in in principle, you will run into the same issue as @SteveF161 since you are using the electron-detector.
Please have a look at this reply together with my later replies here: #10 (comment)
I might add a set of different pulse processing parameters (THL, min_g, min_length, max_length) that allow to process electron-detector pulses if there is more interest. Maybe Steve already found good ones?
So far I have developed the analysis scripts only with the alpha-detector in mind which produces larger output pulses that the electron-detector.
In general, electrons from beta decays produce a continuous energy spectrum and the detector therefore cannot reveal characteristic energy lines. Unless you have a low-energy source of x-rays or mono-energetic electrons, recorded spectra will always look similar to this one from my Sensors paper, figure 7 b):
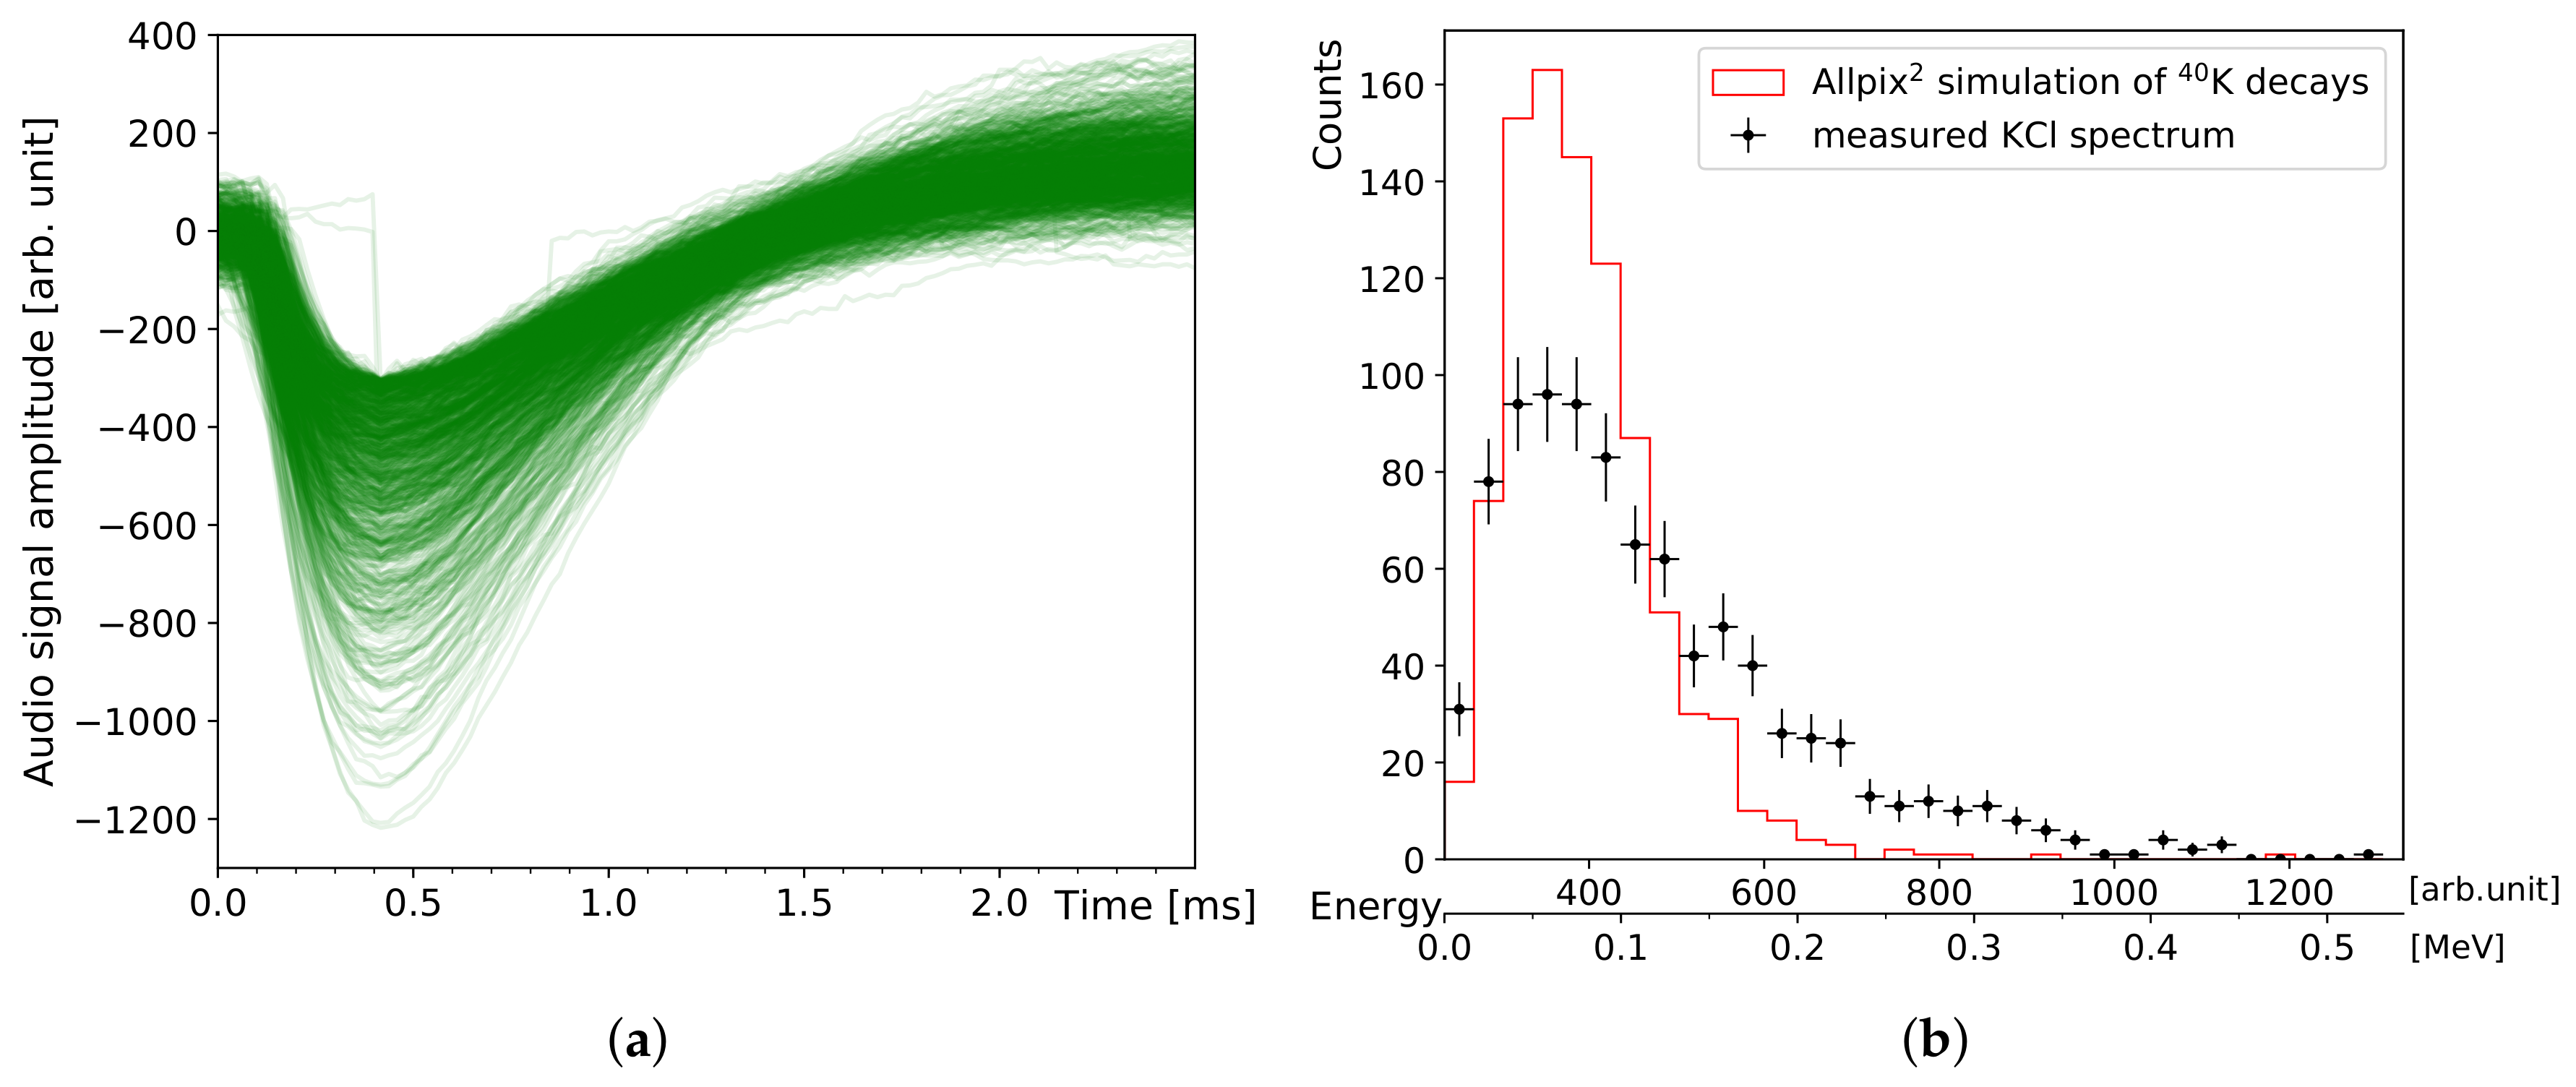
This is not a real characteristic peak as in an alpha energy spectrum. The left edge represents the lower minimum sensitivity threshold of the amplifier circuit and the right 'edge' is defined by the geometry/thickness of the sensor chip which limits the maximum recorded energy from electrons (or scattered gammas in few cases).
I did not know about the Thonny app. It seems like a great choice especially in an education context! Since it uses a modern python version, it should work well if all required modules are installed.
I will put it on my to-do list and try it out myself. Would be great if even the pulse_recorder.py script runs in it.
from diy_particle_detector.
 AlalaStorm
commented on May 24, 2024
AlalaStorm
commented on May 24, 2024
Hi Oliver!
Thanks a lot for your replay.
I did the changes and now i'm having the next error message:
[image: image.png]
I think now is not the same error as @SteveF161
<https://github.com/SteveF161> commented.
El lun., 5 oct. 2020 a las 15:39, Oliver Keller (<[email protected]>)
escribió:
… Hi!
The loading of .msgp files is at the moment implemented in a somewhat
confusing way. You only need to do two things:
Set the full path name to variable file_name in line 88 and *comment* the
line 117 such that it is disabled:
# df = pd.read_pickle(.... It is *either* a pickle file *or* a .mgsgp
file that needs to be loaded, not both.
The if statement in line 90 should not be changed at all.
I am in the process of updating this script with a more simplified loading
of data files/folders and other improvements that I will hopefully upload
soon.
But in in principle, you will run into the same issue as @SteveF161
<https://github.com/SteveF161> since you are using the electron-detector.
Please have a look at this reply together with my later replies here: #10
(comment)
<https://github.com/ozel/DIY_particle_detector/issues/10#issuecomment-691224857>
I might add a set of different pulse processing parameters (THL, min_g,
min_length, max_length) that allow to process electron-detector pulses if
there is more interest. Maybe Steve already found good ones?
So far I have developed the analysis scripts only with the alpha-detector
in mind which produces larger output pulses that the electron-detector.
In general, electrons from beta decays produce a continuous energy
spectrum and the detector therefore cannot reveal characteristic energy
lines. Unless you have a low-energy source of x-rays or mono-energetic
electrons, recorded spectra will always look similar to this one from my Sensors
paper, figure 7 b) <https://www.mdpi.com/1424-8220/19/19/4264/htm>:
<https://camo.githubusercontent.com/1ea9c3d44ad6dc743c42d238cb5b8f4bf1a875ad/68747470733a2f2f7777772e6d6470692e636f6d2f73656e736f72732f73656e736f72732d31392d30343236342f61727469636c655f6465706c6f792f68746d6c2f696d616765732f73656e736f72732d31392d30343236342d673030372e706e67>
This is not a real characteristic peak as in an alpha energy spectrum. The
left edge represents the lower minimum sensitivity threshold of the
amplifier circuit and the right 'edge' is defined by the geometry/thickness
of the sensor chip which limits the maximum recorded energy from electrons
(or scattered gammas in few cases).
I did not know about the Thonny app. It seems like a great choice
especially in an education context! Since it uses a modern python version,
it should work well if all required modules are installed.
I will put it on my to-do list and try it out myself. Would be great if
even the pulse_recorder.py script runs in it.
—
You are receiving this because you authored the thread.
Reply to this email directly, view it on GitHub
<#12 (comment)>,
or unsubscribe
<https://github.com/notifications/unsubscribe-auth/ARHH42YNEQAGGANFBUKUEX3SJHEADANCNFSM4SBPOBTA>
.
from diy_particle_detector.
ozel
commented on May 24, 2024
It looks like something went wrong in your post, there is no error message.
But again, Steve did not really run into an "error" in this case because the analyse_and_plot_pulses.py script is at the moment simply not intended to be used in combination with the electron-detector. The pulses of the two detector variants have different shapes and the script is looking specifically for the shape of alpha detector pulses (unless it is changed as explained above/in the other issue).
Let me know if there is still something unclear.
from diy_particle_detector.
AlalaStorm
commented on May 24, 2024
Dear Oliver,
first of all thanks a lot for your support on the previous questions.
The issue I had and the one I opened in github was because of the version
of one library installed, I changed it and I got the next message:
%Run analyse_and_plot_pulses.py
analyse_and_plot_pulses.py:92: DeprecationWarning: encoding is deprecated,
Use raw=False instead.
msgp = msgpack.unpackb(file.read(),encoding='utf-8')
ts
pulse
0 2020-10-24 19:00:37.161000+02:00 [-18792, -16099, -12613, -15855,
15239, -15793...
1 2020-10-24 19:00:37.182000+02:00 [25653, -15950, -4580, -15974, -7138,
-16140, ...
2 2020-10-24 19:00:37.199000+02:00 [-31817, 16761, -25386, 16791,
-23385, 16791, ...
3 2020-10-24 19:00:37.224000+02:00 [5186, -16432, -21696, -16444,
-12582, -16294,...
4 2020-10-24 19:00:37.237000+02:00 [-10458, -16237, -2460, -16156,
-32634, -16214...
.. ...
...
285 2020-10-24 19:00:42.061000+02:00 [-1514, -15879, 11145, -15872, 28761,
-15896, ...
286 2020-10-24 19:00:42.078000+02:00 [-18351, -16214, -5046, -16487,
-25970, 16467,...
287 2020-10-24 19:00:42.095000+02:00 [-8020, 15901, 16208, -16299, 8890,
-16158, -1...
288 2020-10-24 19:22:49.557000+02:00 [-252, 17355, 6999, 17318, 25788,
16478, -1913...
289 2020-10-24 19:22:49.574000+02:00 [3105, 17338, 17731, 17398, -4991,
17333, 628,...
[290 rows x 2 columns]
detected pulses: 0 in 22 minutes -> 0.0 CPM
perr area: [7.45484879e-05 5.97151812e+00] , perr peak: [2.78851752e-03
6.24391592e+00]
R squared curve_fit area is: 0.9977673032941207
chi sq.: 22.876522563443515 red. chi sq.: 7.6255075211478385
R squared curve_fit peak is: 0.9999277662509872
chi sq.: 2.970503152127459 red. chi sq.: 0.9901677173758197
Traceback (most recent call last):
File "C:\Users\Home\Desktop\DATA ANALISYS\analyse_and_plot_pulses.py",
line 392, in <module>
max_bin = max(peaks)
ValueError: max() arg is an empty sequence
I was kind of surprised for two reasons:
First, I was expecting some graphics instead of this. Is it correct that
type of result? Should I now process those values with some kind of data
editor to obtain a graph?
Second, as you can see in the message obtained (detected pulses: 0 in 22
minutes -> 0.0 CPM). I did the same experiment 4 times with different
exposition times. From some minutes to 3 hours, but I'm still getting 0
detected pulses. I'm wondering which could be the error I am making.
The setup I'm using is the one on the attached photos (1, 2 and 3). Then I
open the web browser application and it seems is getting something photo
4), I switch on the button to connect the battery and start with the
measurements (photo 5) but nothing more than a flat line is in the screen
(the number in sum and e- are moving high), if I turn off the battery
button I get one more time this noise (photo 6) with the numbers going up.
So I am sure, I'm doing something wrong but I have no Idea what...
Maybe the banana position? Some connection with the hardware?
Which is the timescale in which I should take measurements to get the
electron detection? Minutes, hours, ...?
So, one more time, lots of thanks for your support!
I was very excited to do this project but I'm facing trouble with every
step... soldering (I didn't know before), programming with python, ... So
for me is kind of motivating having your feedback.
[image: WhatsApp Image 2020-10-25 at 09.19.25 (1).jpeg]
[image: WhatsApp Image 2020-10-25 at 09.19.25.jpeg][image: WhatsApp Image
2020-10-25 at 09.40.04.jpeg]
[image: WhatsApp Image 2020-10-25 at 09.40.04 (1).jpeg]
[image: WhatsApp Image 2020-10-25 at 09.40.05.jpeg]
[image: WhatsApp Image 2020-10-25 at 09.40.05 (1).jpeg]
from diy_particle_detector.
ozel
commented on May 24, 2024
Hi, I am glad that you like the project so much.
There are multiple things here:
The script does not find pulses, thats why it stops with an error. But it reads the file that you have recorded correctly.
As I wrote above - and I would really encourage you to read my answers above carefully again - the electron-detector that you have built is not compatible with that python script. There are practical reasons: different pusles sizes of electron-detector and the alpha-spectrometer, this could be addressed but needs changes in the script - see my previous replys above.
But there is also an important "physics reason": it is not possible to record a meaningfull energy spectrum from just electrons from beta decays with the electron-detector that you have built.
If you want to record and plot alpha energy spectra like shown in my paper, you can change a few components which will turn the detetcor into an alpha-spectrometer: D1-4, R3, R4, R5, R8, C4, C6, C9 need to be changed.
More on both detector variants, including the different part lists: https://github.com/ozel/DIY_particle_detector/wiki/Assembly-Instructions#required-parts
Unfortunatelly, there are again no images visible in your post.
But you mention measuring a bananna. The radioactivity of one banana is extremly low because the amount of potassium-40 in it is very low, too. Most detectors cannot measure this low level, you would need an expensive gamma spectrometer that is well shielded with lead against background radiation. I know this sounds unexpected because so many talks about the radioactivity of a banana - it is over-hyped on youtube and actually hard to measure.
In a nutshell, you are not doing things wrong per se. You are just trying to measure something that cannot be measured with this detector.
I would propsose to find some reliable reference object like old uranium glass or uranium galzed ceramics from the flea markets or with some luck from the vintage glass cupboard of your parents/grandparents (check google and wikipedia for images of "uranium glass" and "uranium glaze"). From those objects, you could expect a few pulses per minute, like 3 to 10, maybe, depending on the object, of course.
From just the terrestrial and cosmic natural radiation - without any source on the detector- the count rate is very low because the diodes are rather small. It depends on your location, but it would typically be something like one pulse every 5 minutes.
Alternatively, you can try to find potassium salt in a supermarket or organics/diet food shop and measure that: KCl. That is basically 50 percent of potassium and much more of the radioactive and naturally occurring potassium-40. An English brand of KCl, aka "reduced sodium slat", is called "No Salt" (100 % KCl) and another one "Lo Salt" (66% KCl). Pharmacies and eBay sell KCl as well.
By the way, the script output tells me that your recording was 290 waveforms in 22 minutes. That is way too much just from natural background radiation if you had just a banana on the detetcor. But again, your pictures are missing. Maybe you were measuring something else than a banana. Maybe try posting your pictures from another browser?
I suspect that the threshold level is set too sensitive and your are recording too much noise instead of actual pulses from radioactivity. That means you have to move the threshold line further down, away from the signal noise.
Please have a close look at the troubleshooting page on the wiki: https://github.com/ozel/DIY_particle_detector/wiki/Troubleshooting
If your pulses do not look like those, you most probably measure just electronic noise.
from diy_particle_detector.
Related Issues (7)
Recommend Projects
-
 React
React
A declarative, efficient, and flexible JavaScript library for building user interfaces.
-
Vue.js
🖖 Vue.js is a progressive, incrementally-adoptable JavaScript framework for building UI on the web.
-
 Typescript
TypeScript is a superset of JavaScript that compiles to clean JavaScript output.
-
TensorFlow
An Open Source Machine Learning Framework for Everyone
-
Django
The Web framework for perfectionists with deadlines.
-
 Laravel
A PHP framework for web artisans
-
D3
Bring data to life with SVG, Canvas and HTML. 📊📈🎉
-
Recommend Topics
-
javascript
JavaScript (JS) is a lightweight interpreted programming language with first-class functions.
-
web
Some thing interesting about web. New door for the world.
-
server
A server is a program made to process requests and deliver data to clients.
-
Machine learning
Machine learning is a way of modeling and interpreting data that allows a piece of software to respond intelligently.
-
Visualization
Some thing interesting about visualization, use data art
-
Game
Some thing interesting about game, make everyone happy.
Recommend Org
-
Facebook
We are working to build community through open source technology. NB: members must have two-factor auth.
-
Microsoft
Open source projects and samples from Microsoft.
-
Google
Google ❤️ Open Source for everyone.
-
Alibaba
Alibaba Open Source for everyone
-
D3
Data-Driven Documents codes.
-
Tencent
China tencent open source team.
from diy_particle_detector.