
🍞📈 Spread your data on TOAST UI Chart. TOAST UI Chart is Beautiful Statistical Data Visualization library.


The functionality of TOAST UI Chart is available when using the Plain JavaScript, React, Vue Component.
- toast-ui.chart - Plain JavaScript component implemented by NHN Cloud.
- toast-ui.vue-chart - Vue wrapper component implemented by NHN Cloud.
- toast-ui.react-chart - React wrapper component implemented by NHN Cloud.
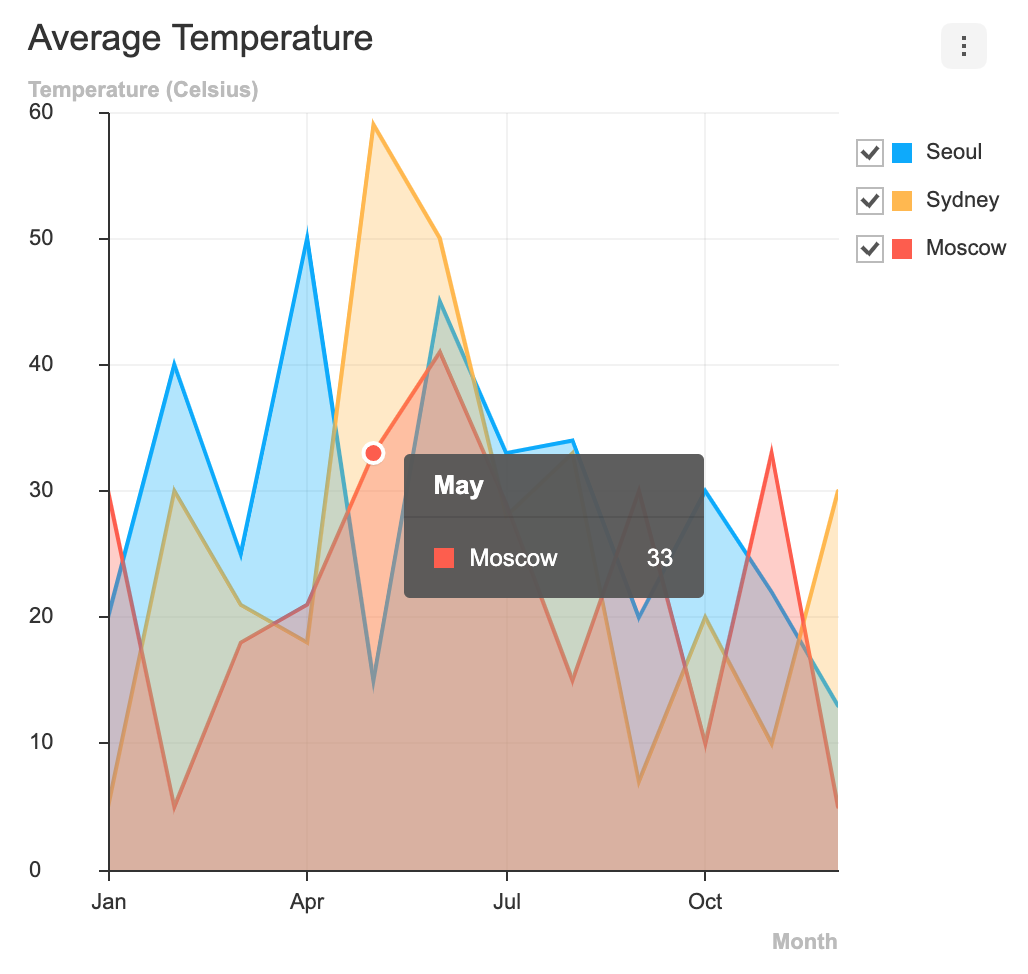
TOAST UI Chart makes your data pop and presents it in a manner that is easy to understand. Furthermore, it provides a wide range of theme options for customizing the charts to be suitable for all of your services. Chart components like the title, axes, legends, tooltips, plots, series, and more can be customized through the options.

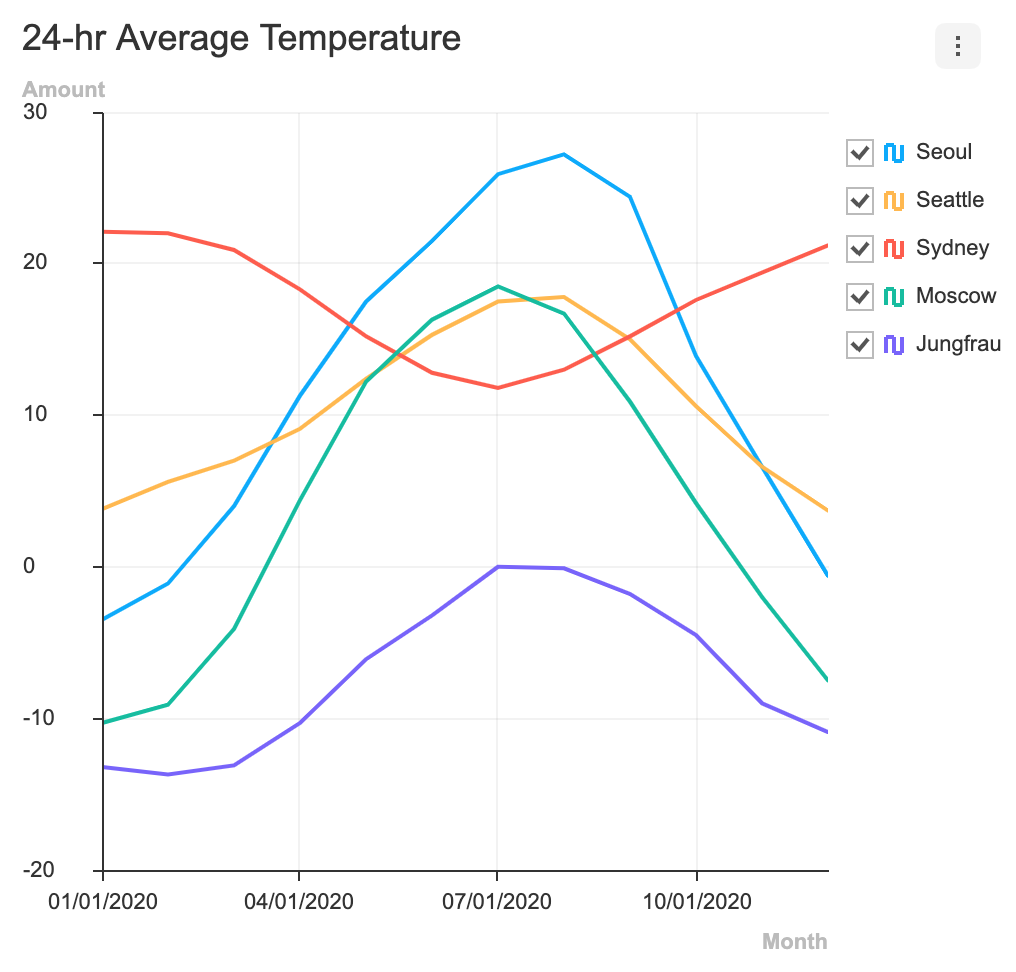
Add different options and animations according to the charts' sizes by using the responsive option.

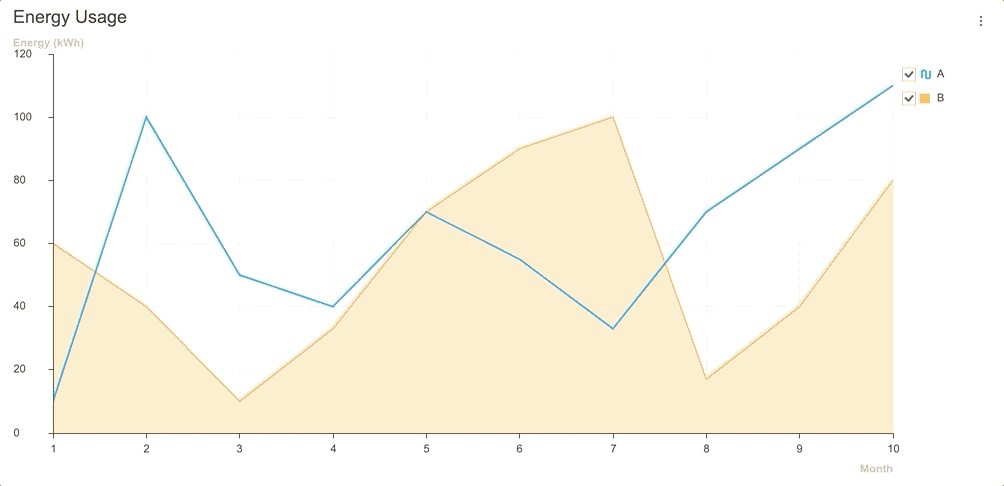
Make the data presented in the Line, Area, and Treemap Charts zoomable with the zoomable option.

View and manage new data as they are added realtime with the addData API and the options.series.shift option.
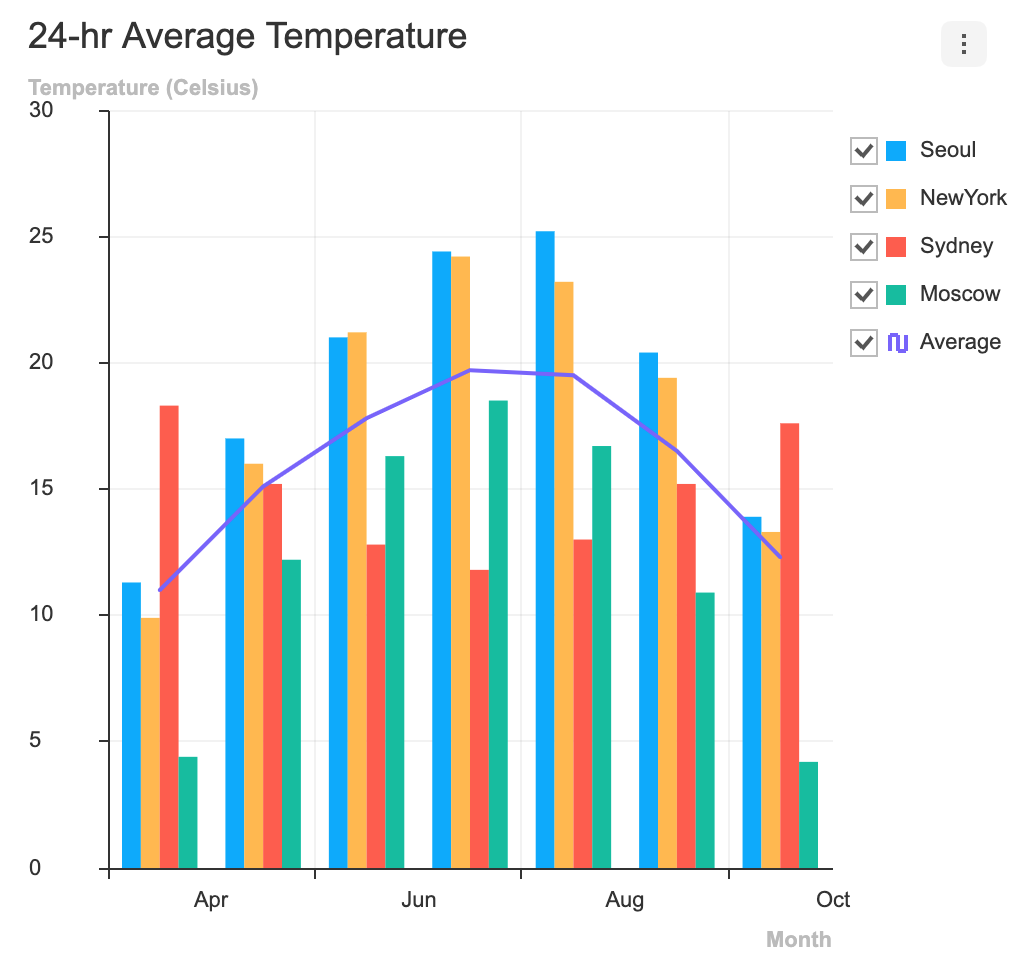
| Area | Line | Heatmap |
|---|---|---|
 |
 |
 |
| LineArea | Column | ColumnLine |
|---|---|---|
 |
 |
 |
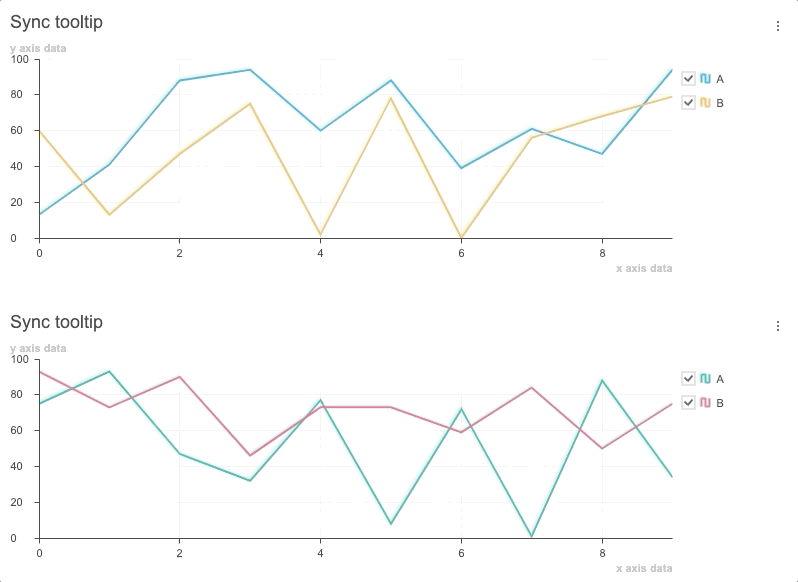
Use and synchronize the tooltip features at the moment the cursor hovers over the chart with the showTooltip API and the on custom event.
The TOAST UI Chart provides many types of charts to visualize the various forms of data.
| Area | Line | Bar | Column |
|---|---|---|---|
 |
 |
 |
 |
| Bullet | BoxPlot | Treemap | Heatmap |
|---|---|---|---|
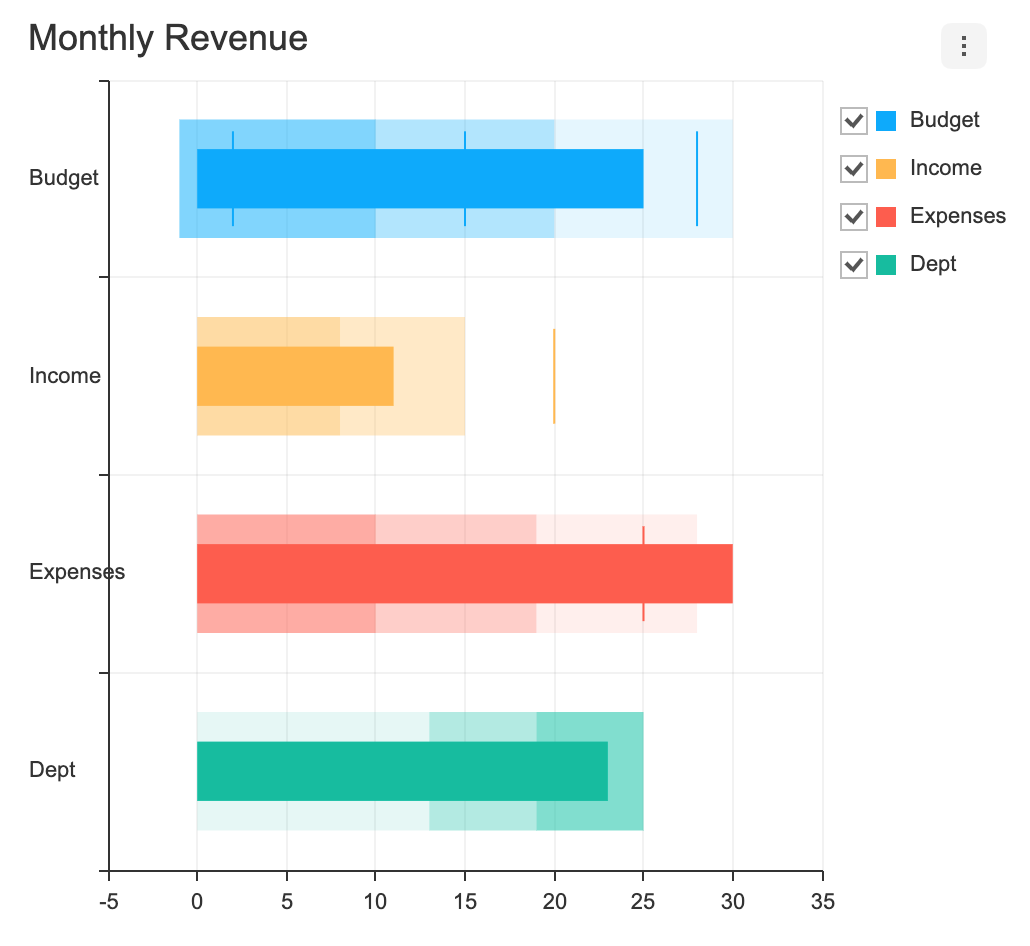 |
 |
 |
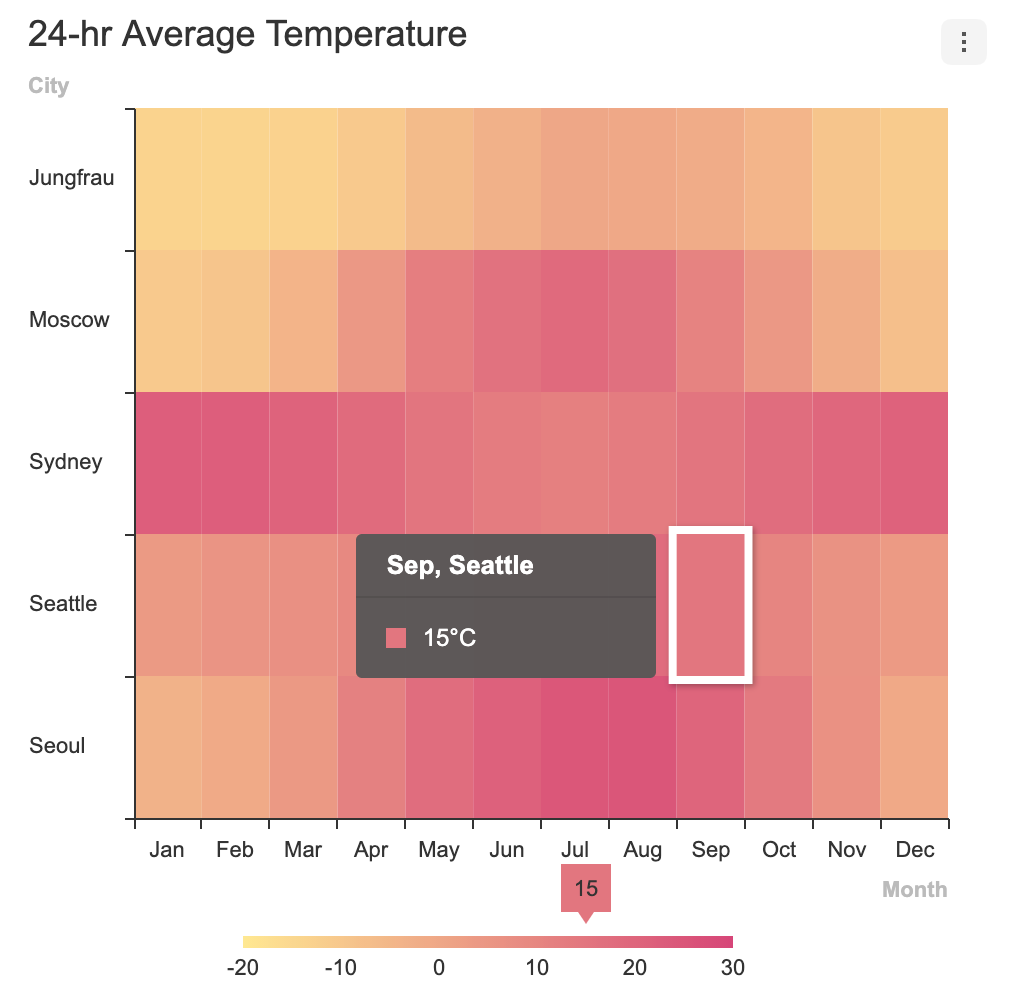 |
| Scatter | Bubble | Radar | Pie |
|---|---|---|---|
 |
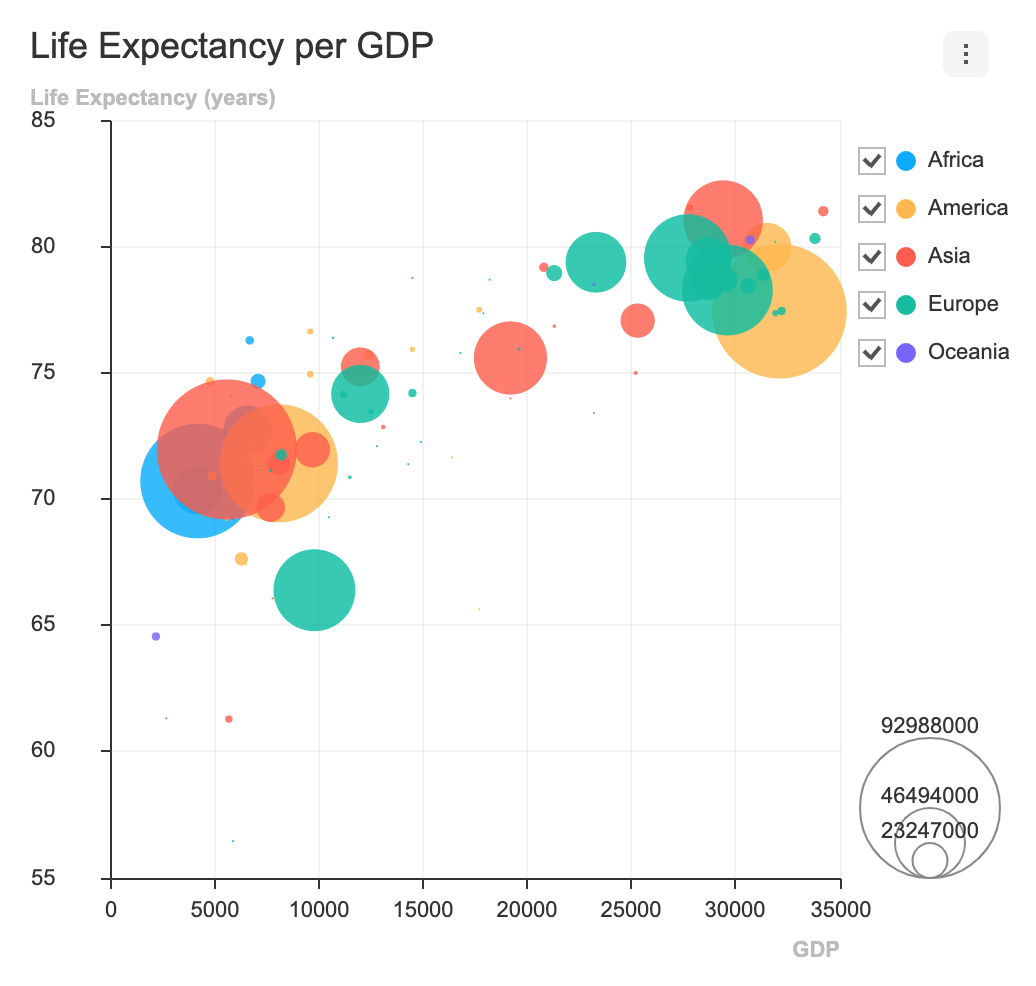 |
 |
 |
| LineArea | LineScatter | ColumnLine | NestedPie |
|---|---|---|---|
 |
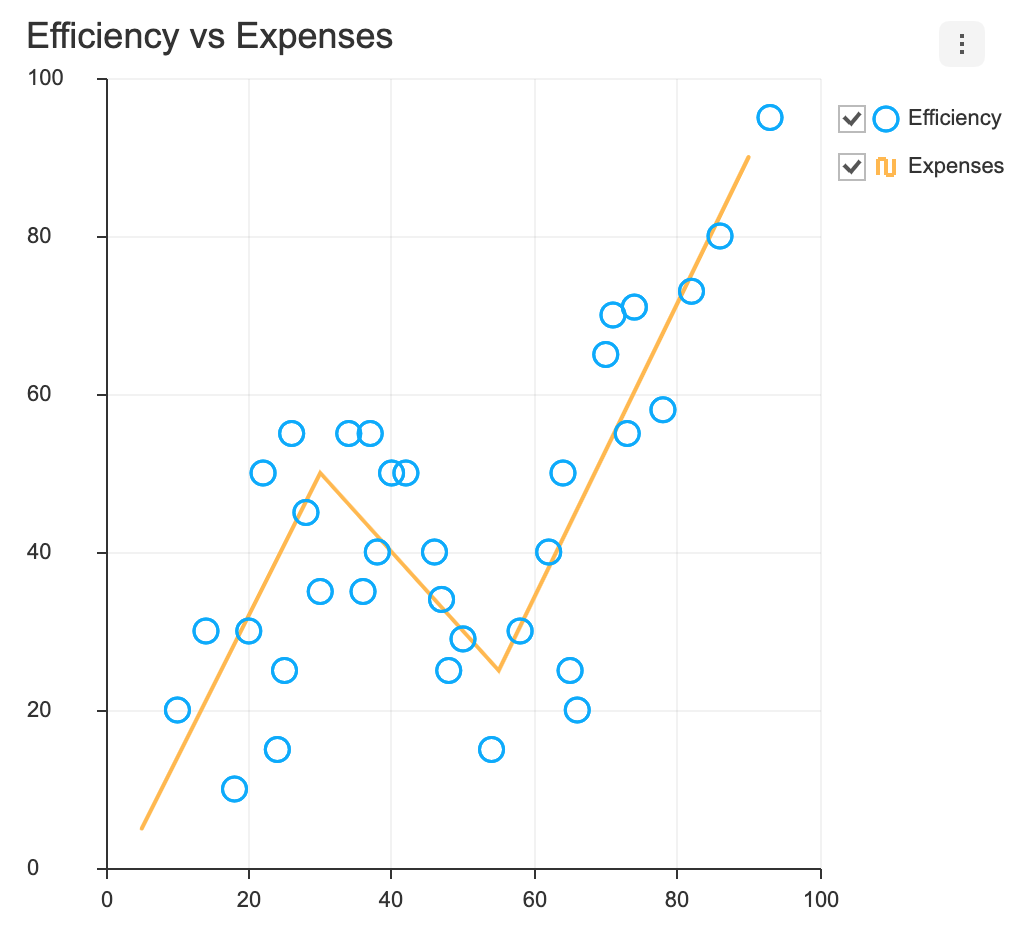 |
 |
 |
| RadialBar | Gauge | ||
|---|---|---|---|
 |
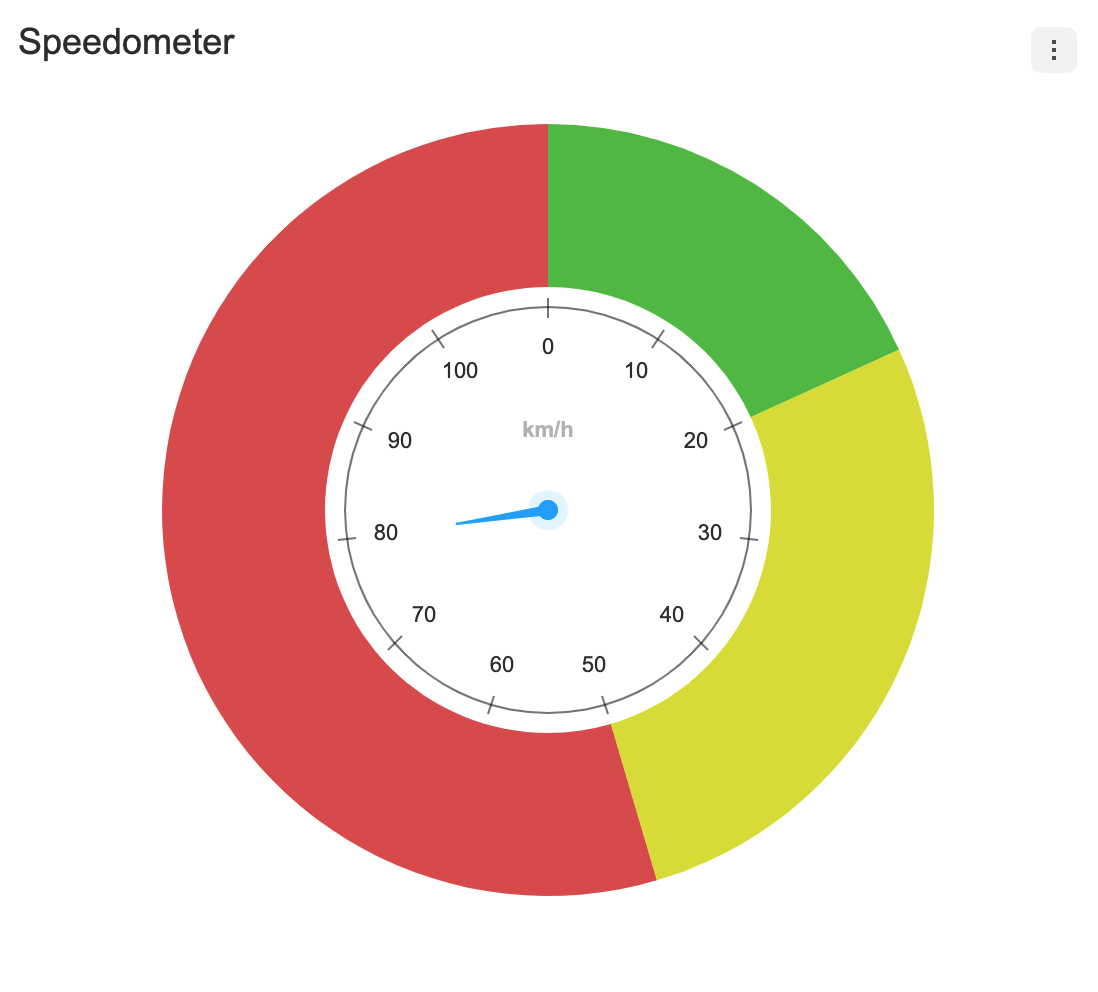 |
 |
|
- Stack Options(Explained in each chart guide)
- Diverging Options(Explained in each chart guide)
- Change Event Detect Type(Explained in each chart guide)
- Custom Theme
- Custom Tooltip
- Export
xls,csv,png,jpegfile - Live Update
- Responsive Layout
In addition, a variety of powerful features can be found on the demo page below. 👇👇👇
- Line Chart
- Area Chart
- LineArea Chart
- Bar Chart
- Column Chart
- ColumnLine Chart
- Bullet Chart
- BoxPlot Chart
- Treemap Chart
- Heatmap Chart
- Scatter Chart
- LineScatter Chart
- Bubble Chart
- Pie Chart
- NestedPie Chart
- Radar Chart
- RadialBar Chart
- Gauge Chart
Here are more examples and play with TOAST UI Chart!
TOAST UI products are open source, so you can create a pull request(PR) after you fix issues. Run npm scripts and develop yourself with the following process.
Fork main branch into your personal repository.
Clone it to local computer. Install node modules.
Before starting development, you should check to have any errors.
$ git clone https://github.com/{your-personal-repo}/tui.chart.git
$ npm install
$ cd apps/chart
$ npm install
$ npm run testLet's start development! You can develop UI through webpack-dev-server or storybook, and you can write tests through Jest. Don't miss adding test cases and then make green rights.
$ npm run serve$ npm run storybook$ npm run testBefore uploading your PR, run test one last time to check if there are any errors. If it has no errors, commit and then push it!
For more information on PR's steps, please see links in the Contributing section.
 Chrome Chrome |
 Internet Explorer Internet Explorer |
 Edge Edge |
 Safari Safari |
 Firefox Firefox |
|---|---|---|---|---|
| Yes | 10+ | Yes | Yes | Yes |

![dependabot[bot] avatar](https://avatars.githubusercontent.com/in/29110?v=4 "dependabot[bot]")


