Codes for performing numerical calculations to study the diamond nv-center quantum system
The NV-Center also known as nitrogen vacancy center is an impurity found in diamond wherein one of the carbon atoms is replaced by a nitrogen atom and the adjacent carbon atom is missing from the lattice creating a vacany. The nitrogen atom consists of a lone pair of electrons which interact with the electrons localized in the vacancy (coming from the adjacent carbon atoms) one at a time. The nv center is a spin 1 system.
The Hamiltonian of the center is affected by a variety of factors such as magnetic field, electric field, strain, temperature and pressure. This makes it an important system for nanoscale measurment of quantities. To perform these measurments one has to know how the external parameters that affect the system. Thus one has to study the hamiltoninan and its dynamics.
The spin hamiltonian of the center is given by:
Hs = D(Sz2 - 2/3) + γB.S + εzEz(Sz2 - 2/3) + εxy{Ex(SxSy + SySx) + Ey(Sx2 + Sy2)}
where:
- Si is the ith component of the Spin-1 operator
- D is the zero field splitting energy
- γ is the gyromagnetic ratio
- B, E are magnetic and electric fields respectively
If the carbon atom adjacent to the vacancy is the isotope 13C, the hamitonian is also influenced by the hyperfine interactions between the nv-center electrons and the 13C nucleus owing to its 1/2 spin. In this case the hamiltonian takes the form:
H = DSz2 + γeB.S + γnB.I + Hhf
Hhf = AzzSzIz + AxxSxIx + AyySyIy + Axz(SzIx + SxIz)
where:
- Ii is the ith component of the nuclear spin operator
- Aij is the ijth component of the Hyperfine tensor
- γn is the gyromagnetic ratio of the 13C nucleus
The above hamiltonians do not have the scaling factor of ℏ. Hence the obtained eigenvalues are transition frequencies.
The excited state Hamiltonian is given by:
H = DesSz2 + μBgesB.S + Ees(Sx2 - Sy2) - AesS.I
where:
- Des = 1.425±003 GHz is the excited state zero field splitting frequency
- Aes = 61±6 MHz is the hyperfine splitting constant
- ges = 2.01±0.01 is the g factor
- Ees = 70±30 MHz is the strain constant
The diagram below shows the standard frequency vs magnetic field graph for an isolated NV Center. Magnitude of the slope is 28.7GHz/T. At roughly 0.1T energy of the ms=-1 state falls below that of the ms=0 state and the graph takes an upward turn.

When hyperfine interaction with a neighbouring 13C nucleus or any other spin half system are considered each of the energy levels is split into 2 sublevels. A total of 8 transitions exist from the ms = 0 state. Shown below is the resonance plot for the detected frequencies. Each line is split into two hyperfine lines. The frequency vs magnetic field graph shows an anticrossing or an avoided crossing at about B = 0.00225T. Since the energy of the ms=0 level and its hyperfine levels are close to each other and much less than the other levels, they would not affect the transition frequency if considered as separate levels. So all the energies of the ms=0 have been averaged out and that average has been considered to obtain the F vs B graph. Otherwise there would be 8 lines and not 4 as in the graph.


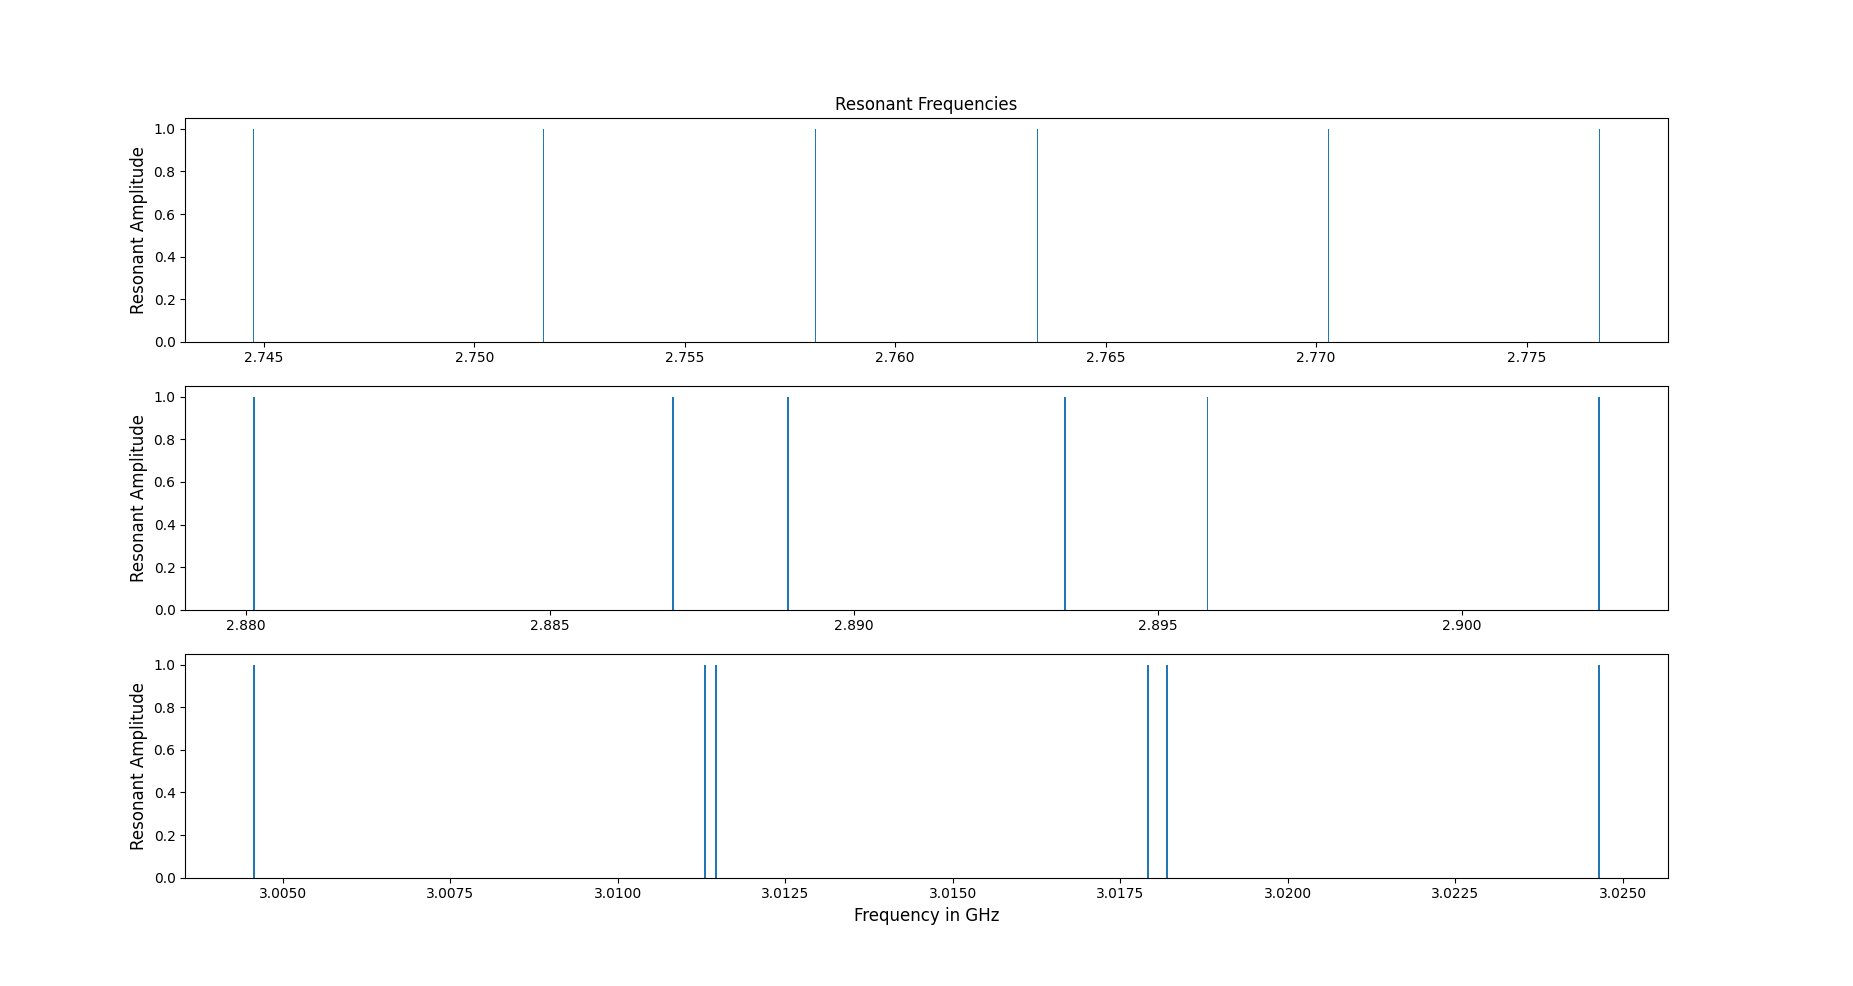
Following are the set of graphs for when the NV-Center is interacting with a spin 1 nucleus. The resonance graph has 18 theoretically predicted frequencies which are much separated compared to the spin half case. For the F vs B graph ms=0 level's energy has been averaged over its 3 hyperfine energies and the thus the graph shows 6 transition lines. There are 3 avoided crossings. At B=0, there exist 6 different transition frequencies (a bit anti-intuitive).

In the Excited State the value of the zero field splitting energy is lower and strain has a much pronounced effect compared to the ground state. Following are the graphs for the excited state NV-Center interacting with a spin half nucleus. Strain induces a characteristic curve at near zero fields and a much quicker avoided crossing. Zero field energy levels of ms=+1 and ms=-1 become distinct due to strain. The hyperfine lines in the F vs B graph are seen to broaden higher magnetic fields, as their slopes are not exactly equal.


Magnetic Field Orientation (Need to look into this, graphs are not final and explanation maybe wrong)
The graph below shows a comparison between the transition frequencies when the magnetic field is parallel and when its perpendicular to the NV axis. For the perpendicular case at low magnetic fields, a parabolic increase is observed. At high magnetic fields the effect of D is negligible and all the lines are expected to become degenerate in the limit that B tends to infinity or D tends to zero. But this is not obsereved for some reason.
 The graph below shows how the spins rotate when magnetic field in the perpendicular direction increases. Again something strange is observed. The graphs show that ms=0 level at B=0 tends to ms=-1 level as B tends to infinity. This means that the state which has 0 spin projection on the Z axis at B=0 has a spin projectino of -1 at B = infi.

- Romana Schirhagl, Kevin Chang, Michael Loretz, and Christian L. Degen Annual Review of Physical Chemistry Vol. 65:83-105
- K. Rama Koteswara Rao and Dieter Suter Phys. Rev. B 94, 060101(R)
- Gyromagnetic Ratios of different nuclei
- G. D. Fuchs, V. V. Dobrovitski, R. Hanson, A. Batra, C. D. Weis, T. Schenkel, and D. D. Awschalom Phys. Rev. Lett. 101, 117601 (2008)


