Giter Club home page Giter Club logo

mpl-interactions's Introduction

mpl_interactions

All Contributors

PyPI package Supported Python versions Documentation Status Binder Test pre-commit.ci status Code style: Prettier Code style: black Imports: isort

Welcome!

mpl_interactions' library provides helpful ways to interact with Matplotlib plots. Full narrative documentation and example can be found on Read the Docs.

Installation

pip install mpl_interactions["jupyter"] # will install necessary deps for using in jupyter

# for use only outside of jupyter:
pip install mpl_interactions

If you use JupyterLab, make sure you follow the full instructions in the ipympl readme in particular installing jupyterlab-manager.

Contributing / feature requests / roadmap

I use the GitHub issues to keep track of ideas I have, so looking through those should serve as a roadmap of sorts. For the most part I add to the library when I create a function that is useful for the science I am doing. If you create something that seems useful a PR would be most welcome so we can share it easily with more people. I'm also open to feature requests if you have an idea.

Documentation

The fuller narrative documentation can be found on ReadTheDocs. You may also find it helpful to check out the examples directory.

Contributors ✨

Thanks goes to these wonderful people (emoji key):


Ian Hunt-Isaak

💻

Sam

📖

Jenny Coulter

📓

Sabina Haque

📖 📓 💻

John Russell

💻 📓 📖

Max Shinn

💻 📓

Kevin Dalton

📓

Remco de Boer

💻 📓 📖

samwelborn

📓

Matthew Feickert

💻

This project follows the all-contributors specification. Contributions of any kind welcome!

mpl-interactions's People

Contributors

allcontributors[bot] avatar dependabot[bot] avatar hckr avatar ianhi avatar jameswrigley avatar jrussell25 avatar matthewfeickert avatar mwshinn avatar pre-commit-ci[bot] avatar redeboer avatar samanthahamilton avatar sjhaque14 avatar wgottwald avatar

Stargazers

 avatar  avatar  avatar  avatar  avatar  avatar  avatar  avatar  avatar  avatar  avatar  avatar  avatar  avatar  avatar  avatar  avatar  avatar  avatar  avatar  avatar  avatar  avatar  avatar  avatar  avatar  avatar  avatar  avatar  avatar  avatar  avatar  avatar  avatar  avatar  avatar  avatar  avatar  avatar  avatar  avatar  avatar  avatar  avatar  avatar  avatar  avatar  avatar  avatar  avatar  avatar  avatar  avatar  avatar  avatar  avatar  avatar  avatar  avatar  avatar  avatar  avatar  avatar  avatar  avatar  avatar  avatar  avatar  avatar  avatar  avatar  avatar  avatar  avatar  avatar  avatar  avatar  avatar  avatar  avatar  avatar  avatar  avatar  avatar  avatar  avatar  avatar  avatar  avatar  avatar  avatar  avatar  avatar  avatar  avatar  avatar  avatar  avatar  avatar  avatar

Watchers

 avatar  avatar

mpl-interactions's Issues

smart layout of sliders

if using many sliders it will just get really long. should probs do some nice chunking of them like boxes with no more than 3 sliders vertically and then rows of no more than three boxes. Like this but if it were drawn not poorly:
image

> It would be cool to have interactive_[imshow, pcolormesh, hist,...]. I think these all deserve separate functions as they have different signatures and are different in matplotlib.

It would be cool to have interactive_[imshow, pcolormesh, hist,...]. I think these all deserve separate functions as they have different signatures and are different in matplotlib.

First list:

  • [ x] hist

  • [ x] scatter

  • [ x] imshow

  • pcolormesh

  • errorbar

  • seaborn distplot

each should get their own interactive_[...]_factory and interactive_[...] function

Pretty much all of the functions in pyplot could be possibly be included, but the above are probably the most useful.

  • Hist
  • Scatter

Originally posted by @SeanAshley5 in #59 (comment)

capture errors in the update function and show them to user

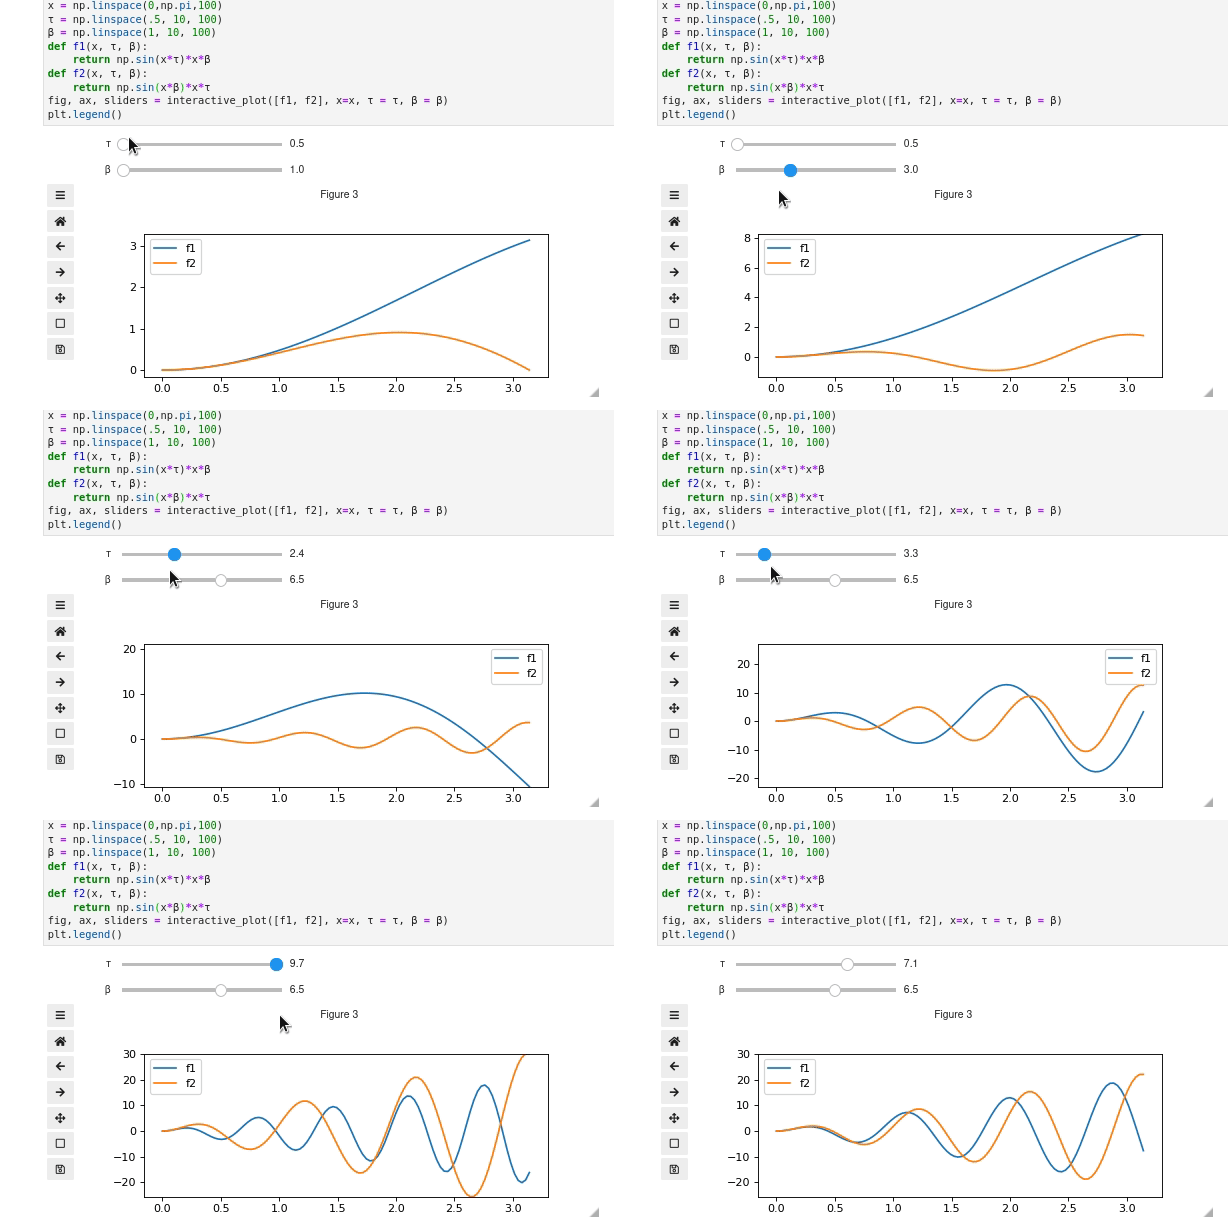
%matplotlib ipympl
import numpy as np
from mpl_interactions import interactive_plot
def f(x, τ, β, type_):
    if type_ == 'sin':
        return np.sin(x*τ)*x**β
    elif type_ =='cos':
        return np.cos(x*τ)*x**β
        
fig, ax, sliders = interactive_plot(f, x=x, τ = (1, 10, 100), β = (1, 10 ), type_ = {('sin', 'cos', 'beep','boop')})

will fail with an error in the log console but not in the notebook :(

just allow params as kwargs?

this would remove the need to wrap things in lists.

idk if its worth it though. I need to manufacture myself a user who is not me and figure out what they would like

imagining something like

λ = np.linspace(500, 600,100)
β = np.linspace(0,1,1000)
`interactive_plot(f, λ = λ, β=β

which then is also nice for adding labels to the sliders.

improve documentation

Having written the entire library I'm finding it difficult to figure out which parts need the most explanation. So the narrative documentation is a bit lacking although I think the examples are pretty good. Although even the examples do not cover every case.

don't force display

Should have the option to return the ui and contained widgets to embed however is desireable.

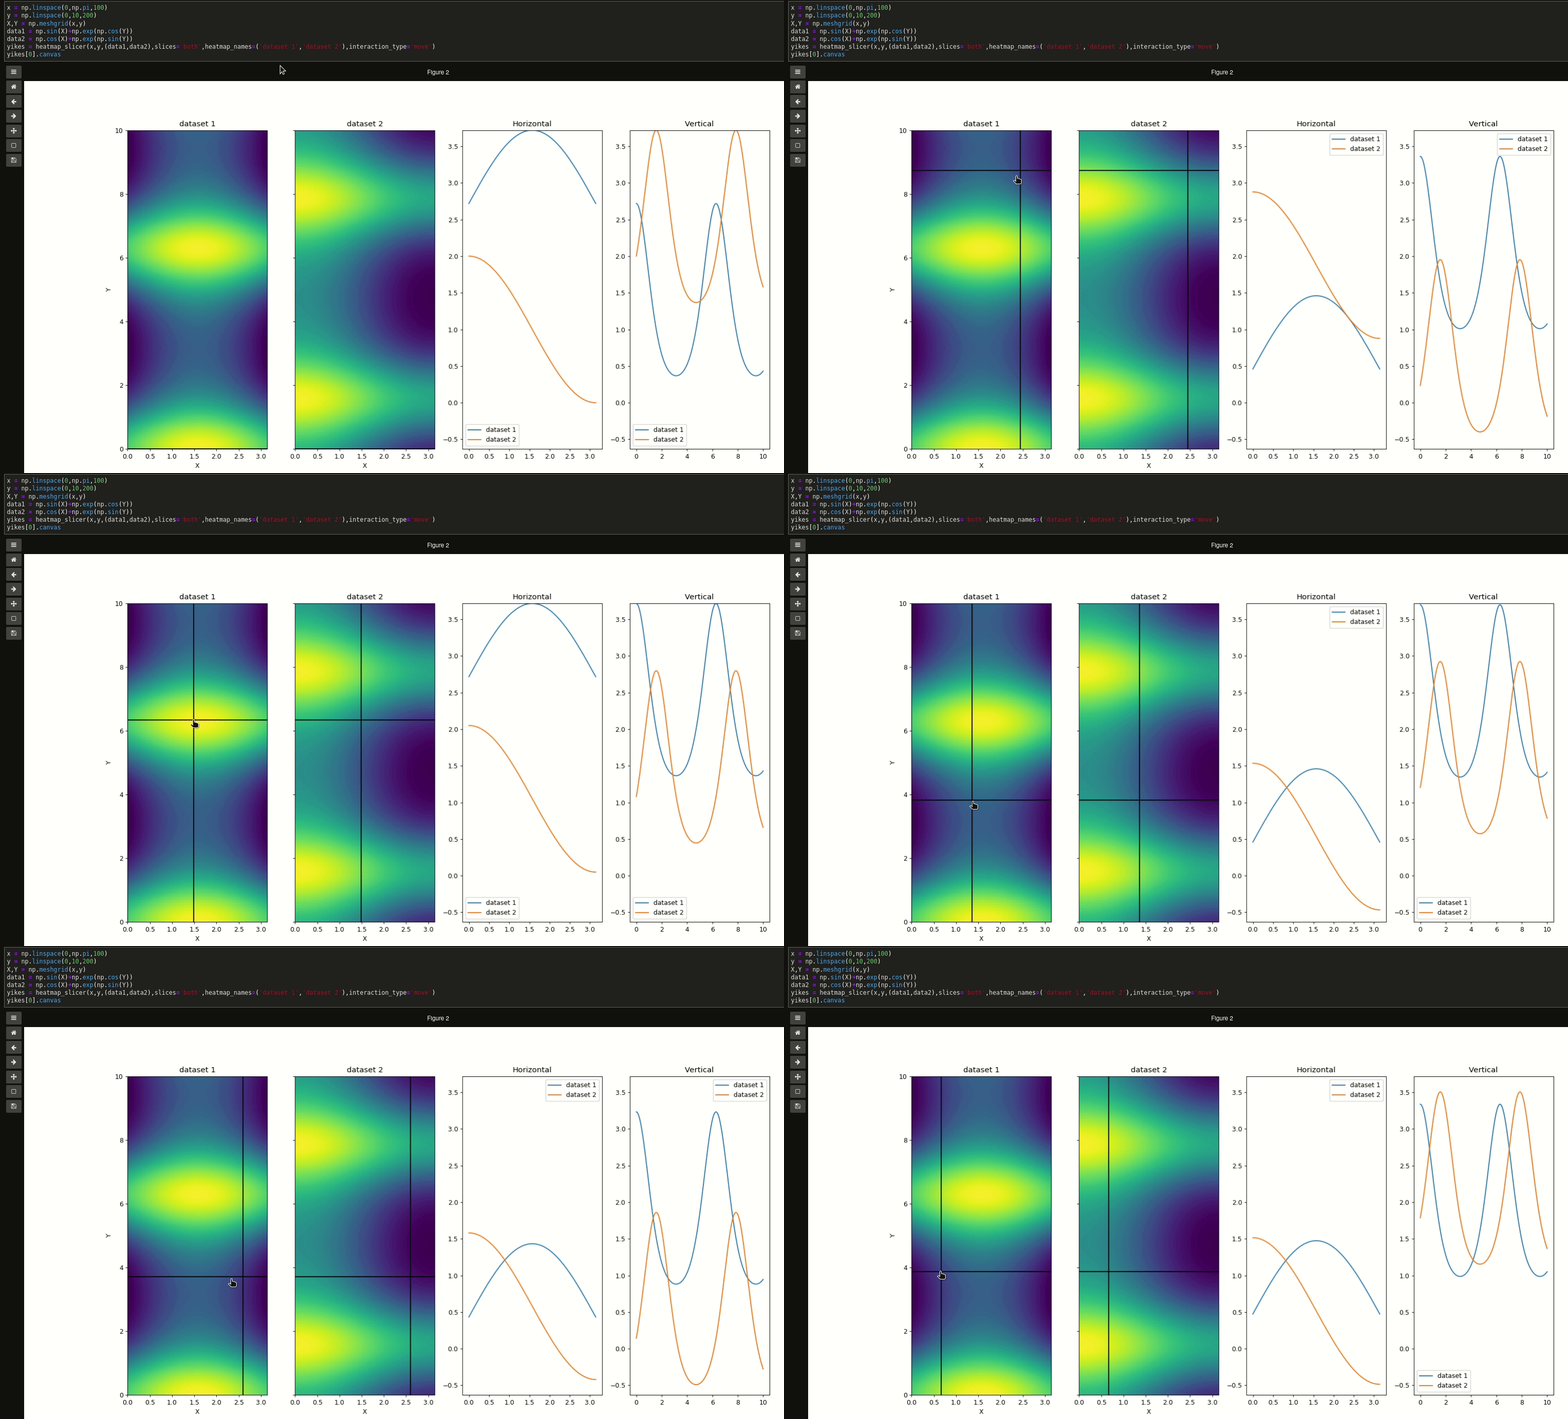
reconsider the heatmap_slicer slice choosing semantics

Currently slices accepts: 'vertical', 'horizontal', and 'both'. This has potential to become a nightmare of special casing once arbitrary angles are supported. In particular it should probably not accept 'both' and instead you use a list to specify.

xref: #29 and #33

remove github pages

With the switch to RTD and changes to .gitignore it no longer renders anyway.

allow interactive_plot to update title

with some sort of string format ideally

i.e. an argument like title = 'rotation: {param}' should be subjected ax.set_title(rotation.format(param=slider.value)) and/or this should apply to the figure suptitle. Or both suptitle and title default to none

get value of datapoint under mouse for 2d

arr = np.arange(0,12).reshape(4,3)
X = np.arange(4)
Y = np.arange(3)
plt.imshow(arr.T)
# plt.contourf(gs, scales, residuals.T, levels=np.linspace(0,420,10))
# plt.colorbar()
label = widgets.Label(value='none')
def update(event):
#     x_idx = nearest_idx(gs,event.xdata)
#     y_idx = nearest_idx(scales, event.ydata)
#     label.value = str(residuals[x_idx,y_idx])
    x_idx = nearest_idx(X,event.xdata)
    y_idx = nearest_idx(Y, event.ydata)
    label.value = str(arr[x_idx,y_idx])
    print(event.xdata)
#         print(event)
#         print(event.)
fig.canvas.mpl_connect('motion_notify_event', update)
# widgets.Label(value=)
out
display(label)

interactive_plot breaks if f returns multiple lines

beta = np.linspace(4,10,)
x = np.linspace(0,2*np.pi)
other_param = np.array([1,2])[None,:]
def f(x, beta):
    return np.sin(x*beta)[:,None]* other_param
print(f(x,beta[10]).shape)
interactive_plot(f,x=x,beta =beta)

Peek 2020-07-31 12-18

provide a decorator

basically the same as the interact decorator except that it's a special case to deal with matplotlib

make histograms easy

Not sure what the interface ought to be. Ideas:

  1. optional argument to interactive plot
  2. it's own function

proposed by @kmdalton

create interactive_* methods

It would be cool to have interactive_[imshow, pcolormesh, hist,...].
First list:
has a set_data method

no set_data method

Pretty much all of the functions in pyplot could be possibly be included, but the above are probably the most useful.

rename x_scale and y_scale to xlims and ylims

I just wrote down the following sentence when making documentation:

You can control how xlim/ylims behave using the x_scale/y_scale arguments

which demonstrates the absurdity of the current situation

allow f to not return x when x=None

def f(tau):
    blah blah
   return y
interactive_plot(f, tau = np.linspace...)

could be equivalent to plt.plot(f(tau[0])). .I think this would sacrifice the case where f returns both x and y but only a single point for both and not as numpy arrays. which like, whatever... that does not seem like a terrible thing to lose

Recommend Projects

  • React photo React

    A declarative, efficient, and flexible JavaScript library for building user interfaces.

  • Vue.js photo Vue.js

    🖖 Vue.js is a progressive, incrementally-adoptable JavaScript framework for building UI on the web.

  • Typescript photo Typescript

    TypeScript is a superset of JavaScript that compiles to clean JavaScript output.

  • TensorFlow photo TensorFlow

    An Open Source Machine Learning Framework for Everyone

  • Django photo Django

    The Web framework for perfectionists with deadlines.

  • D3 photo D3

    Bring data to life with SVG, Canvas and HTML. 📊📈🎉

Recommend Topics

  • javascript

    JavaScript (JS) is a lightweight interpreted programming language with first-class functions.

  • web

    Some thing interesting about web. New door for the world.

  • server

    A server is a program made to process requests and deliver data to clients.

  • Machine learning

    Machine learning is a way of modeling and interpreting data that allows a piece of software to respond intelligently.

  • Game

    Some thing interesting about game, make everyone happy.

Recommend Org

  • Facebook photo Facebook

    We are working to build community through open source technology. NB: members must have two-factor auth.

  • Microsoft photo Microsoft

    Open source projects and samples from Microsoft.

  • Google photo Google

    Google ❤️ Open Source for everyone.

  • D3 photo D3

    Data-Driven Documents codes.