The purpose of this data science project is to come up with a pricing model for ski resort tickets in our market segment. Big Mountain suspects it may not be maximizing its returns, relative to its position in the market. It also does not have a strong sense of what facilities matter most to visitors, particularly which ones they're most likely to pay more for. This project aims to build a predictive model for ticket price based on a number of facilities, or properties, boasted by resorts (at the resorts). This model will be used to provide guidance for Big Mountain's pricing and future facility investment plans.
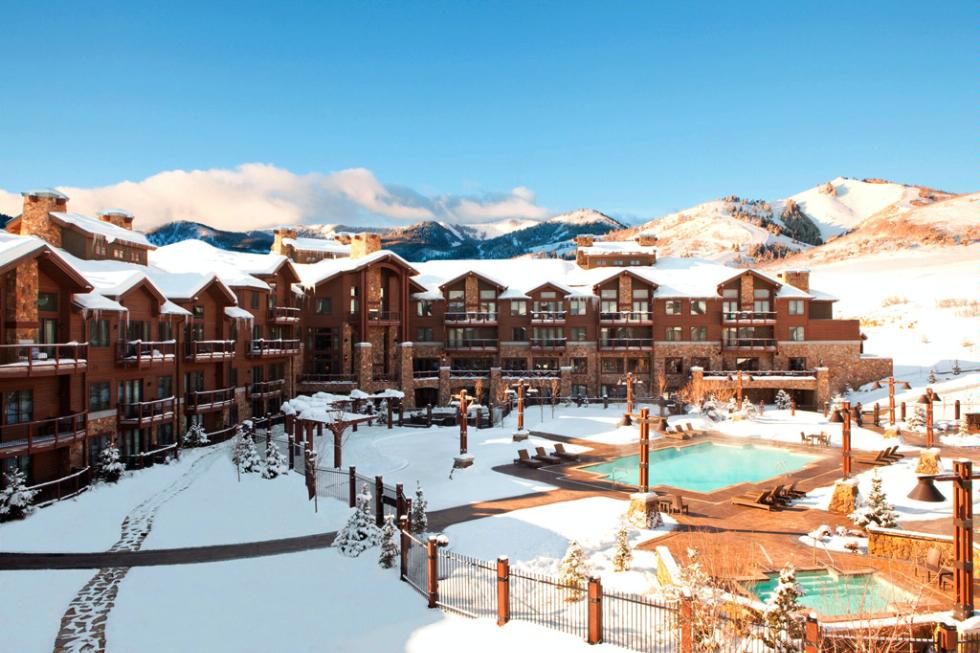
Big Mountain, a ski resort located in Montana offers spectacular views of Glacier National Park and Flathead National Forest with access to 105 trails. The business is looking to have a better idea on how to better price their premiums compared to similar competitors. They need a better understanding on how to better leverage their facilities against pricing while at the same time minimizing operating costs
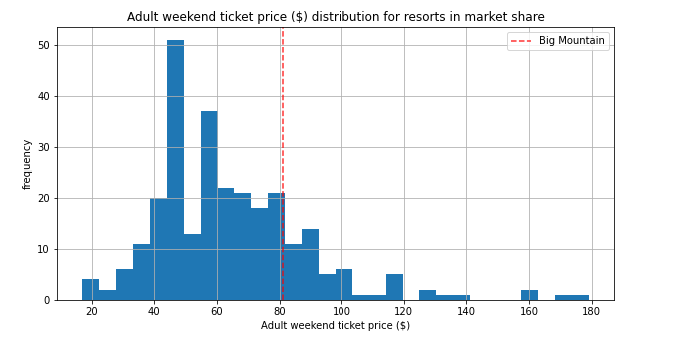
The resort’s pricing strategy, so far, has been to charge a premium above the average price of resorts in its market segment. Management is aware that there are limitations to this approach. This current pricing does not provide the business with a good sense of how important some facilities are compared to others which hampers investment strategy. This report will answer those issues by selecting a better value for their ticket price while leveraging costs.
Big Mountain Resort has been reviewing potential scenarios for either cutting costs or increasing revenue (from ticket prices). Ticket price is not determined by any set of parameters; the resort is free to set whatever price it likes. However, the resort operates within a market where people pay more for certain facilities, and less for others. Being able to sense how facilities support a given ticket price is a valuable business intelligence. This is where the utility of our model comes in.
The expected number of visitors over the season is 350,000 and, on average, visitors ski for five days. Assuming the provided data includes the additional lift that Big Mountain recently installed.
The business has shortlisted some options:
-
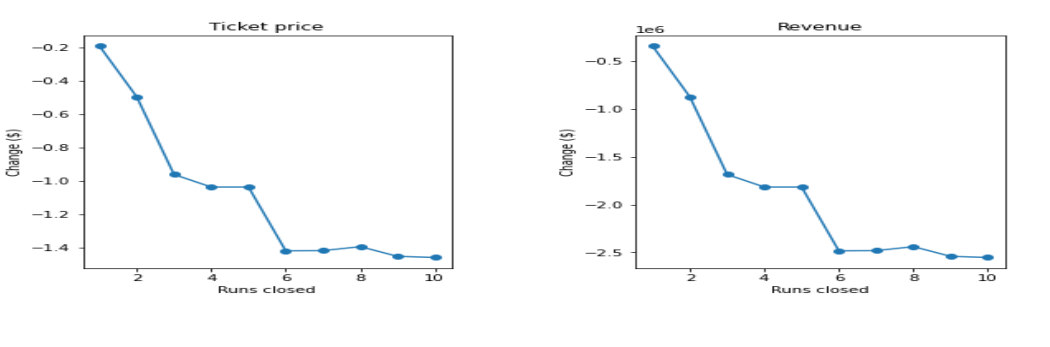
Permanently closing down up to 10 of the least used runs. This doesn't impact any other resort statistics.
-
The model says that closing one run makes no difference. Closing 2 and 3 successively reduces support for ticket price and revenue. If Big Mountain closes down 3 runs, it seems they may as well close down 4 or 5 as there’s no further loss in ticket price.
-
Increasing the closures down to 6 or more, leads to a large drop, however.
-
-
Increasing the vertical drop by adding a run to a point 150 feet lower down but requiring the installation of an additional chair lift to bring skiers back up, without additional snow making coverage.
- This scenario increases support for a ticket price from $81 to $92 (13.5% increase)
-
Same as number 2, but adding 2 acres of snow making cover:
- This scenario increases support for a ticket price from $81 to $94 (16 % increase)
-
Increasing the longest run by 0.2 mile to boast 3.5 miles length, requiring an additional snow making covering of 4 acres:
- No differences observed.
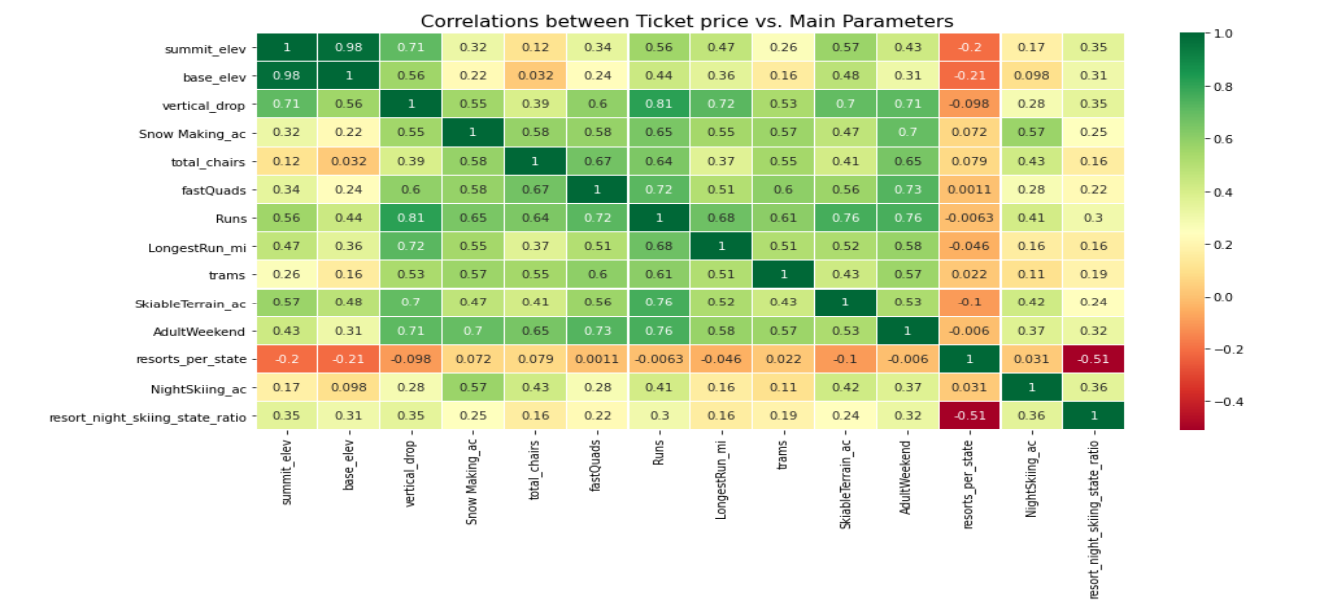
Feature Correlation heatmap is used to gain a high level view and identify patterns of relationships amongst the different features:
-
Summit and base elevation are highly correlated.
-
fastQuads stands out, along with Runs, Snow Making_ac and vertical_drop
Visitors would seem to value more guaranteed snow, which would cost in terms of snow making equipment, which would drive prices and costs up. As well as Runs, total_chairs are quite well correlated with the ticket price. This is plausible; the more runs you have, the more chairs you'd need to ferry people to them! Interestingly, they may count for more than the total skiable terrain area. For sure, the total skiable terrain area is not as useful as the area with snow making. People seem to put more value in guaranteed snow cover rather than more variable terrain area.
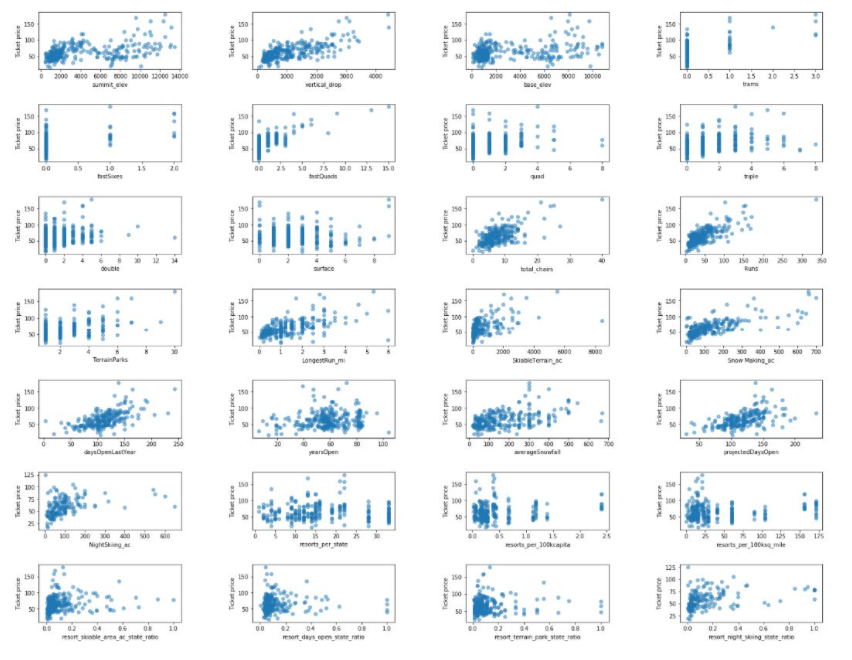
Feature Correlation Scatterplots: Correlations, particularly viewing them together as a heatmap, can be a great first pass at identifying patterns. But correlation can mask relationships between two variables
-
There's a strong positive correlation with vertical_drop.
-
fastQuads seems very useful. Runs and total_chairs appear quite similar and also useful.
Linear Model: In the process of building the linear model, missing values were entered with the median and mean values. If ticket prices were predicted using the linear model, they would be off by about $9. However, the initial linear model was overfitting and needed to be adjusted by the number of features. Through cross-validation, the value of k was set to eight features to focus on: vertical_drop, Snow Making_ac, total_chairs, fastQuads, Runs, LongestRun_mi, trams, and SkiableTerrain_ac. These features fit our initial assumptions from the Exploratory Data Analysis (EDA).
Random Forest Model: Like the linear model, missing values were entered with the median and mean values. While imputing the median was helpful, it was not helpful to scale the features. The random forest model revealed that the top four features to consider are fastQuads, Runs, Snow Making_ac, and vertical_drop.
Final Model Selection: After testing both the linear model and random forest model, the project will be moving forward with the forest regression model. A comparison of the two demonstrated that performance on the test set was consistent with the cross-validation results. Additionally, the cross�validation’s mean absolute error was lower using the random forest regressor
The findings suggest that the current Mountain Resort’s ticket price is lower than the predicted model by approximately 16%, and the resort have many potential scenarios for either cutting costs by closing runs or increasing ticket price by increasing the vertical drop or adding acres snow making.
-
Increasing the vertical drop by 150 ft would increase the ticket price by 13.5% from $81 to $92, resulting in revenue increase by $19,354,650.
-
Adding 2 acres of snow making would increase the ticket price by 16% from $81 to $94, resulting in revenue increase by $22,032,150.
-
When it comes to closing up to 10 used Runs, our Model predicted that closing one run only would be best as it would have no impact on the ticket price or revenue while reducing operation costs.
-
Closing 2 or more runs could negatively impact the ticket price and revenue.
- Because we don’t know the operating cost per used run, we can’t determine how much cost saving will be offset by a potential loss in revenue after closing more than one run.


![dependabot[bot] avatar](https://avatars.githubusercontent.com/in/29110?v=4 "dependabot[bot]")