Giter Club home page Giter Club logo

eclair's Introduction

Introduction

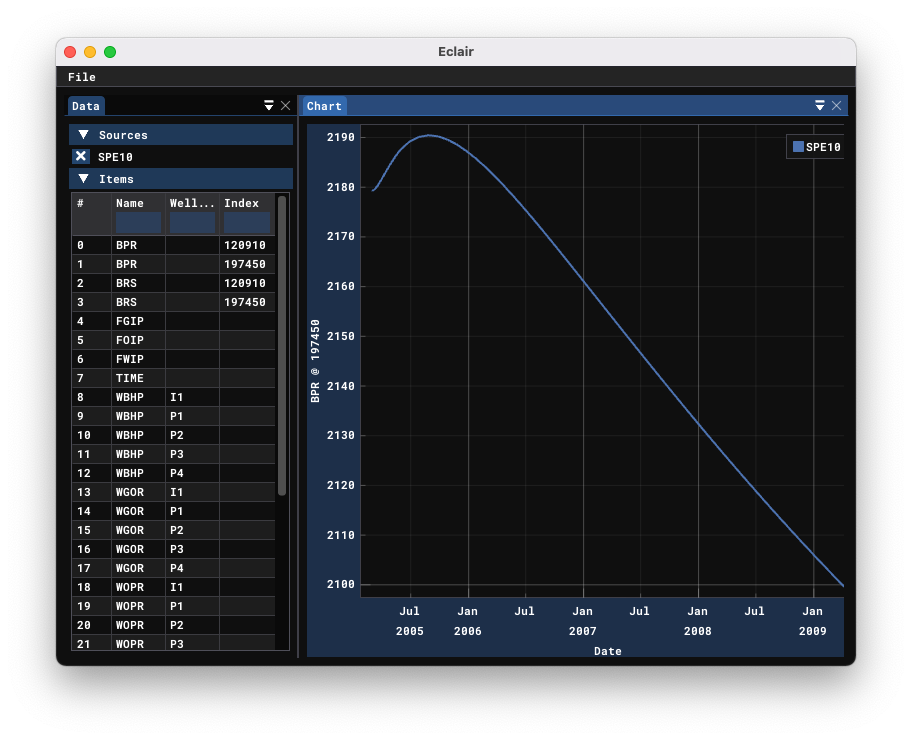
Eclair is a GUI application to visualize summary outputs of the oil&gas reservoir simulators that write out results in the Eclipse binary format:

Screenshot

Building Instructions

Eclair consists of the Rust back-end and the C++ front-end. To build the application, one first needs to compile the backend:

  • Install Rust and Cargo. Refer to https://rustup.rs/ for Rust installation instructions;

  • Inside the repo run cargo build --release --all

Afterwards one needs to build the CMake project inside the eclair-gui folder. The CMakeLists.txt is set up to automatically discover the necessary Rust files, so the build instructions are simply:

cd eclair-gui
mkdir build && cd build
cmake -DCMAKE_BUILD_TYPE=Release ..
make

On Windows, you might want to add -GNinja to the cmake invocation and then build with ninja instead of make.

On Linux you might have to install additional packages to compile the front-end. Refer to your distribution docs for details.

eclair's People

Contributors

dependabot[bot] avatar erichdongubler avatar

Stargazers

 avatar  avatar  avatar  avatar  avatar

Watchers

 avatar

Forkers

erichdongubler

eclair's Issues

Updating summary from a file should remember the last cursor position

When we read summary data from a file, we should assume that it could be in the "still-being-written-to" state and handle this gracefully by recording the cursor position of the end of the last successfully read data segment. This way we can seek to it at the beginning of the next read attempt.

Replace ZeroMQ with zmq.rs

zmq.rs is a native Rust implementation of ZeroMQ. They already implement the features I use (TCP transport, DEALER/ROUTER sockets and monitor sockets), so in theory I should be able to drop the C dependency altogether.

Multiple chart windows

We would like to have as many dockable chart windows open as a user requests. To make this work, I'd probably need to add a splitter with the left-hand child being the data window and the right-hand side being the dock space for multiple chart windows.

Multiple axes per chart

Implot supports up to 3 y-axes per chart. I am thinking that an axis should correspond to a given physical quantity. That is, if a user drops two WBHP items in the same chart area, they should both belong to a single y-axis, but a WBHP and a WTHP will be plotted using two different axes.

Extend the SMSPEC parser

  • Add optional region names when available;
  • Support data types that require a string-like ID (e.g. well names) be able to have them as both fixed and dynamic strings;

Recommend Projects

  • React photo React

    A declarative, efficient, and flexible JavaScript library for building user interfaces.

  • Vue.js photo Vue.js

    ๐Ÿ–– Vue.js is a progressive, incrementally-adoptable JavaScript framework for building UI on the web.

  • Typescript photo Typescript

    TypeScript is a superset of JavaScript that compiles to clean JavaScript output.

  • TensorFlow photo TensorFlow

    An Open Source Machine Learning Framework for Everyone

  • Django photo Django

    The Web framework for perfectionists with deadlines.

  • D3 photo D3

    Bring data to life with SVG, Canvas and HTML. ๐Ÿ“Š๐Ÿ“ˆ๐ŸŽ‰

Recommend Topics

  • javascript

    JavaScript (JS) is a lightweight interpreted programming language with first-class functions.

  • web

    Some thing interesting about web. New door for the world.

  • server

    A server is a program made to process requests and deliver data to clients.

  • Machine learning

    Machine learning is a way of modeling and interpreting data that allows a piece of software to respond intelligently.

  • Game

    Some thing interesting about game, make everyone happy.

Recommend Org

  • Facebook photo Facebook

    We are working to build community through open source technology. NB: members must have two-factor auth.

  • Microsoft photo Microsoft

    Open source projects and samples from Microsoft.

  • Google photo Google

    Google โค๏ธ Open Source for everyone.

  • D3 photo D3

    Data-Driven Documents codes.