KPI Monitor a Python tool for logging and plotting IoT experiments. It is used for the experiments on the OpenTestbed. It is used to log messages containting measurements in JSON format received over MQTT from IoT devices. Plotter tools are used to parse the logs, and plot different statistics in three formats:
- Time-series line charts,
- CDF plots, and
- PDF plots.
- Run MQTT logger as:
python kpi_mqtt_logger.py <experiment_id>: this will create a log sub-directory and will listen to the configured MQTT port. Received packets messages will be logged in JSONL file with data/time stamps and the experiment ID as in the example below:
command: python kpi_mqtt_logger.py g6TiSCH_6DYN_hybrid
{
   "timestamp":"2021-03-01 18:20:43.877000",
   "data":{
      "rpl_phy_stats":{
         "1":11,
         "0":11,
         "2":9
      },
      "src_id":"b640",
      "token":123,
      "time_elapsed":{
         "seconds":6308,
         "microseconds":911000
      },
      "rpl_churn":0,
      "rpl_node_count":32,
      "pkt_info":{
         "numTicksInTotal":1980111,
         "latency":1388,
         "src_id":"b640",
         "numTicksTx_2":580,
         "numTicksTx_1":2540,
         "numTicksTx_0":414,
         "numCellsUsedRx":0,
         "counter":101,
         "dagRank":1916,
         "maxBufferSize":4,
         "minBufferSize":0,
         "numTicksTx":3534,
         "numCellsUsedTx":0,
         "numNeighbors":70,
         "numTicksOn_0":7886,
         "numTicksOn_1":35285,
         "numTicksOn_2":9068,
         "numTicksOn":52239,
         "asn":628830
      }
   },
   "name":"g6TiSCH_6DYN_hybrid"
}
- Configure the
kpi_stats_parser.pytime-series plotter with the IDs of the experiments you wish to compare their results. For example:
#  make sure that g6tisch logs have the keyword "hybrid" in them so the script would plot the duty cycles of each PHY separately.

network_settings = [
'g6_fsk',
'g6_ofdm',
'g6_oqpsk',
'g6TiSCH_6DYN_hybrid'

]

labels = [
'FSK_868MHz',
'OFDM_868MHz',
'OQPSK_2.4GHz',
'g6TiSCH/6DYN
]
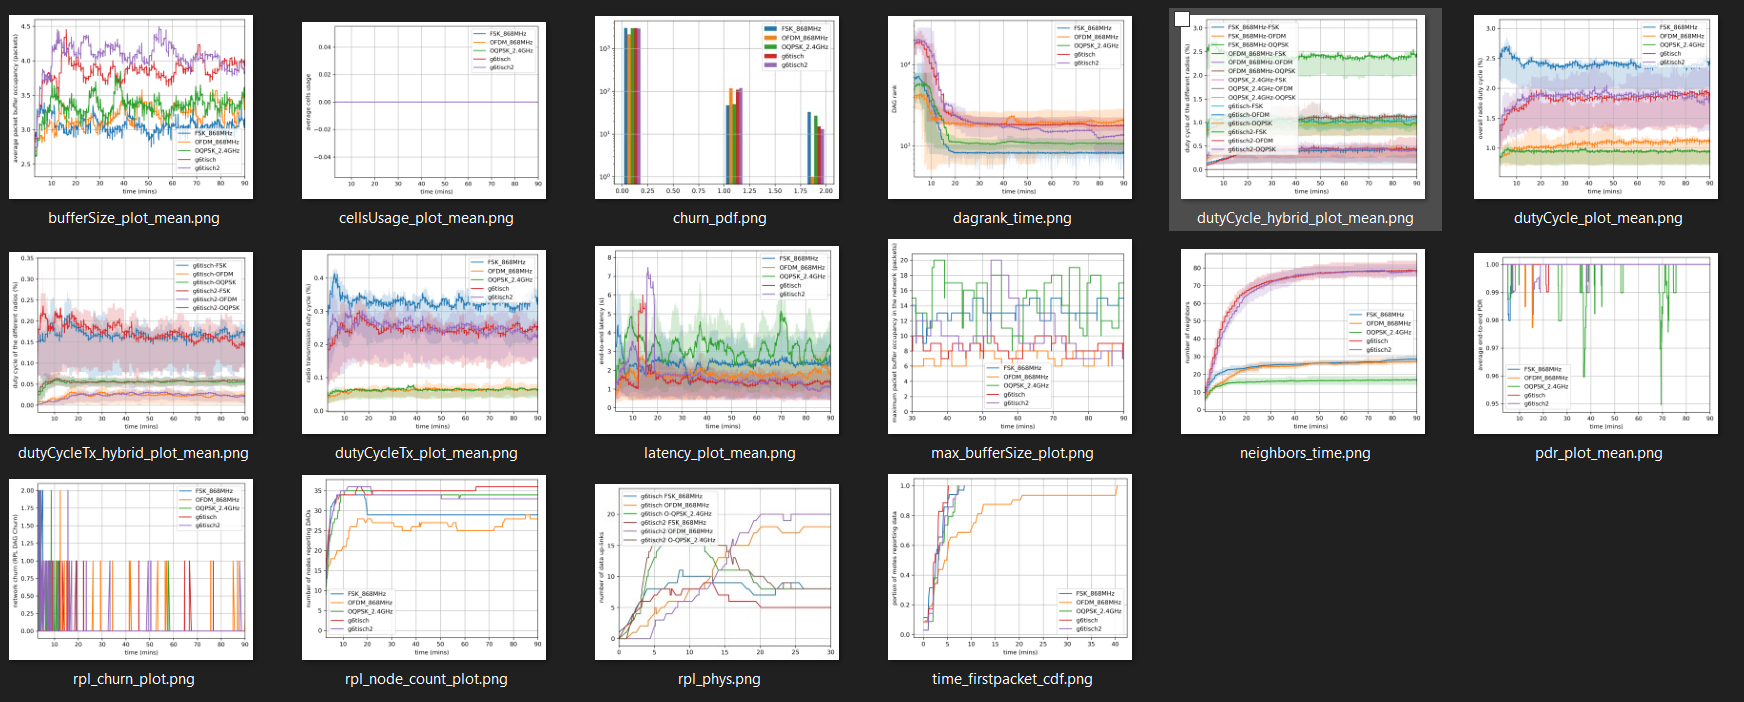
Run the time-series plotter kpi_stats_parser.py. It will go through ALL the log files and will extract all data points that match the experiment IDs you defines. It creates the following time-series plots under plots sub-directory:
- Run the CDF and PDF plotters the same way
kpi_full_cdf_parser.pyCDF plotter with the IDs of the experiments you wish to compare their results. The plots are created under sub-directories:cdf_plots_fullandpdf_plots_full.


- Those are the main tools that you need. Explore around the other random plotters/tools I created for different purposes! the scripts should be self explanatory! Such as Shell scripts to automate CDF/PDF plotters, 3D plotters, converters to Matlab var files.

