Giter Club home page Giter Club logo

wpa's Introduction

wpa

R build status License: MIT lifecycle CRAN status CRAN last month downloads

Analyze and Visualize Viva Leader Insights data

This is an R package for analyzing and visualizing data from Microsoft Workplace Analytics. For analyzing data from Microsoft Viva Insights, please see our other package vivainsights.

With the wpa package, you can...

  1. Run prebuilt analysis and visualizations off advanced insights data with settings for HR variables, privacy threshold, etc.

  2. Generate prebuilt interactive HTML reports, which cover specific areas e.g. collaboration, connectivity

  3. Leverage advanced analytics functions, such as text mining and hierarchical clustering, which are built for Workplace Analytics metrics

  4. Integrate analysis of Leader Insights data with your R workflow seamlessly

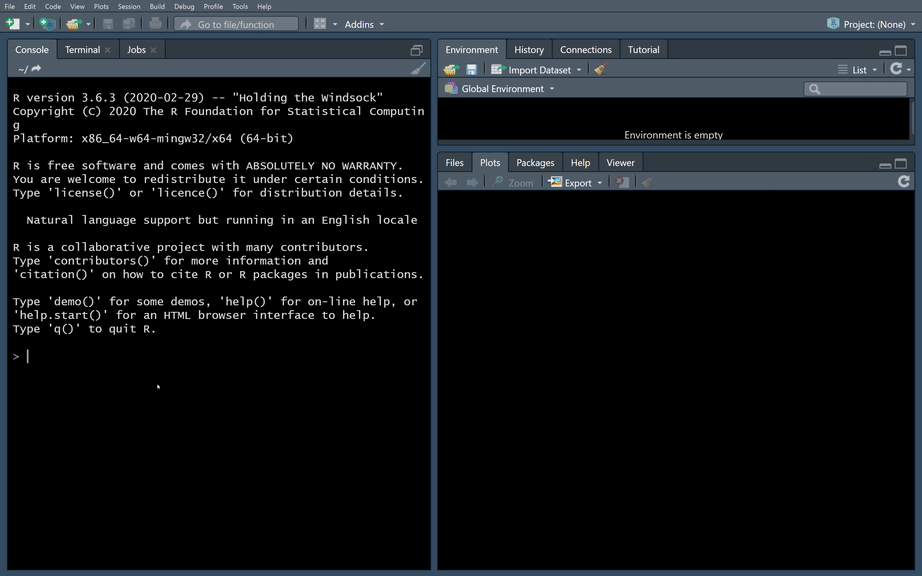
Here is an example of wpa in action:


๐Ÿš€ Users

To get started with the package, please see the following links:

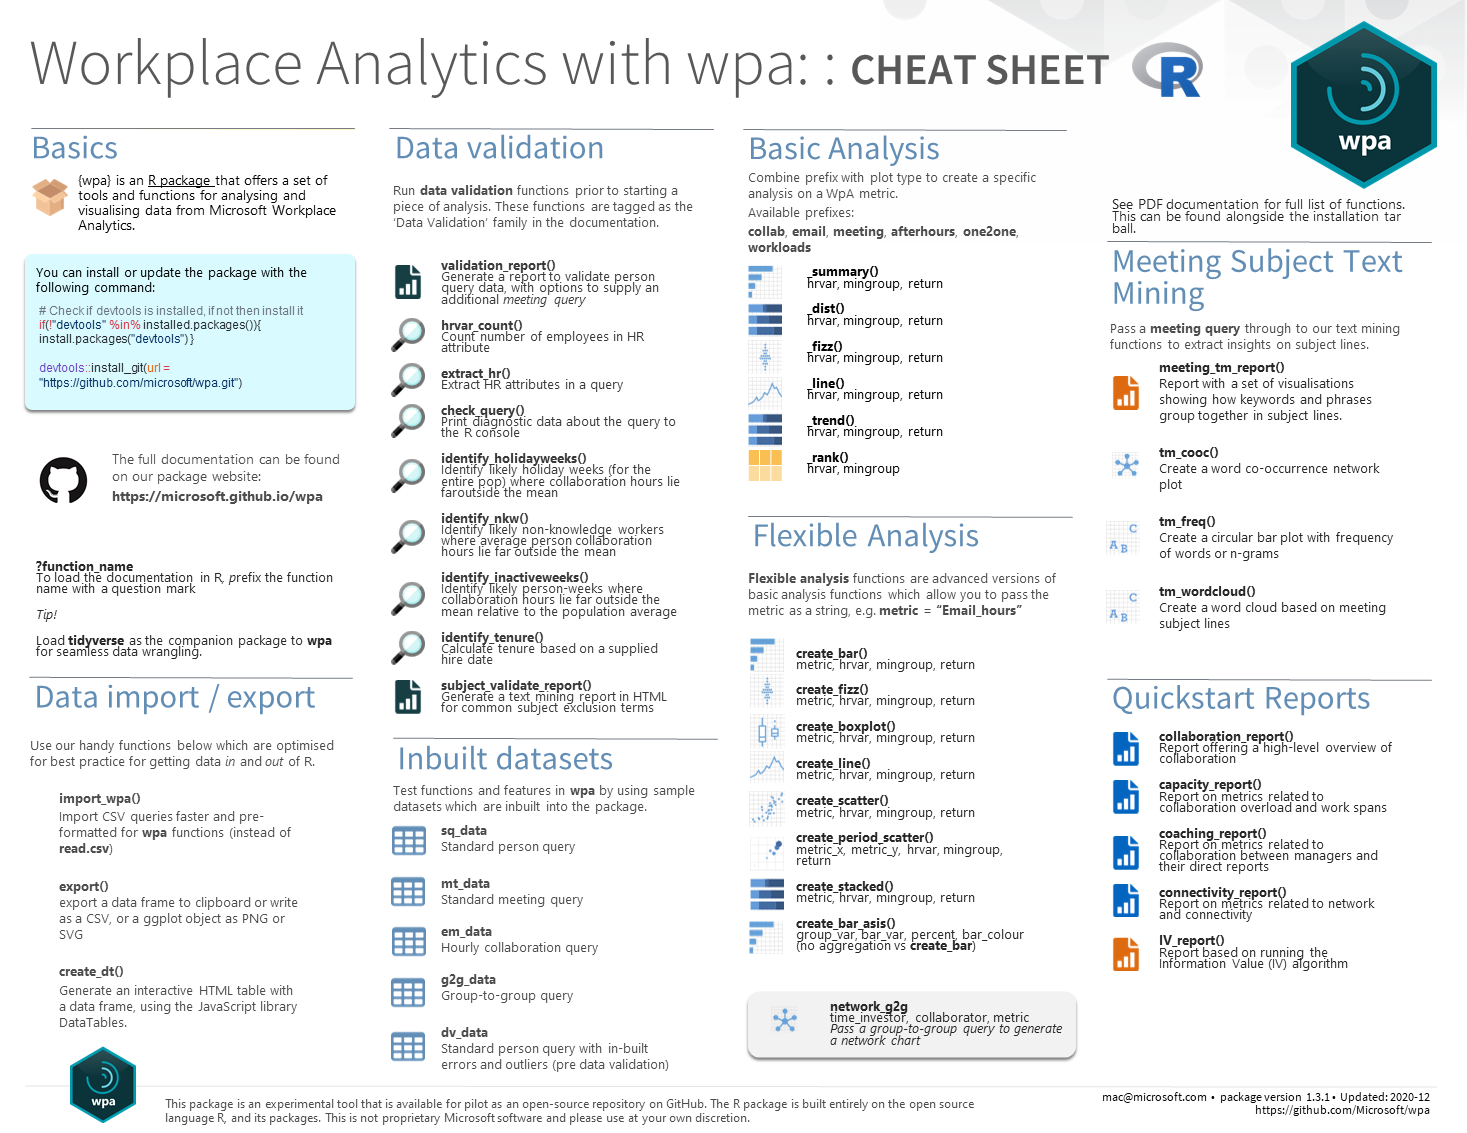
Also check out our package cheat sheet for a quick glimpse of what wpa offers:


๐Ÿ”จ Developers

We welcome contributions to the package!

Contributing code

If you would like contribute code to the repo, please read our Contributor Guide and Developer Guide. This documentation should provide you all the information you will need to get started.

Issues or Feature Requests

If you would like to log an issue or submit a feature request, please create a new issue or comment on an existing issue on GitHub Issues on this repo.

Reporting Security Issues

Please do not report security vulnerabilities through public GitHub issues. Please read our Security document for more details.

Changelog

See NEWS.md for the package changelog.


Related repositories


Code of Conduct

We would ask you to please read the Microsoft Open Source Code of Conduct prior to engaging with this package.

Trademarks

This project may contain trademarks or logos for projects, products, or services. Authorized use of Microsoft trademarks or logos is subject to and must follow Microsoft's Trademark & Brand Guidelines. Use of Microsoft trademarks or logos in modified versions of this project must not cause confusion or imply Microsoft sponsorship. Any use of third-party trademarks or logos are subject to those third-party's policies.


Finding this project useful?

โญ Please star this repository to keep us going!

Contributors to the GitHub repo:

See the full list of our contributors here.

wpa's People

Contributors

alashi-ms avatar davisvaughan avatar github-actions[bot] avatar juliajuju93 avatar m-m-powers avatar martinctc avatar microsoft-github-policy-service[bot] avatar moralec avatar olivroy avatar

Stargazers

 avatar  avatar  avatar  avatar  avatar  avatar  avatar  avatar  avatar  avatar  avatar  avatar  avatar  avatar  avatar  avatar  avatar  avatar  avatar  avatar  avatar  avatar  avatar  avatar  avatar  avatar  avatar  avatar  avatar

Watchers

 avatar  avatar  avatar  avatar  avatar  avatar  avatar  avatar  avatar  avatar

wpa's Issues

Refactor: simplify API so that `network_p2p()` can handle community detection

Currently the network visualizations that come from a p2p query are handled by a variety of functions. It would be best to have a single function (network_p2p) acting as a wrapper, with a range of visualization options as parameters (e.g. can color code nodes with both hr attributes or using a community detection algo)

For example:

Default behavior, displays network plot with nodes colored by Organization:

network_p2p(display="hrvar", hrvar="Organization", return="plot",  path=NULL)

Option to color code the nodes as a different hrvar:

network_p2p(display="hrvar", hrvar="LevelDesignation")

Option to color code the nodes using a Louvain community detection algorithm:

network_p2p(display="clusters", mode="louvain", return="plot")

Spike: Reduce long load time

Is your feature request related to a problem? Please describe.
Loading the {wpa} package takes upwards of 20 seconds sometimes, which is longer than other packages we use

Describe the solution you'd like
Either speed up the load time (primary) or insert a status bar that shows progress (Secondary)

Describe alternatives you've considered
I can't get another work computer :(

Additional context
Add any other context or screenshots about the feature request here.

Feature: Improve keymetrics_scan() plot

Is your feature request related to a problem? Please describe.
The KeyMetrics_Scan Plot is very ugly and puts our library to shame! Its really bad in comparison to the other plots.

Describe the solution you'd like
A super nice heatmap (The Economist style, see attached)!

Describe alternatives you've considered
I considered that maybe we should settle for a moderately nice plot - but after a lot of reflection, I think this function deserves a super nice one!

Additional context
MicrosoftTeams-image (12)

Feature: return "data" view for `mgrrel_matrix()`

Currently, mgrrel_matrix() does not provide access to the underlying data of which coaching style is allocated to which employee. Releasing this data will open up new analysis possibilities like combining its use with keymetrics_scan().

It should be a simple return = "data" option like many of {wpa} functions.

Aesthetics: font improvements

Is your feature request related to a problem? Please describe.
Currently the font sizes in the plots are inconsistent and can be visually jarring.

Describe the solution you'd like
A change to theme_wpa_basic() for the following:

  • We make the axis titles, subtitles and labels all of the same size.
  • Remove the subtitle italics
  • Make title one point larger and bold

Documentation: refer to Flexible Queries with their latest names

In the documentation, some queries are not being referred to with the most up-to-date names, such as 'Standard Query' which should be referred to as 'Standard Person Query'. Also, 'Collaboration Assessment Query' should be referred to as 'Ways of Working Assessment Query'.

Discussion: `After_hours_collaboration_hours` does not contain all after-hour metrics

Describe the bug
Looking at my data I saw that After_hours_collaboration_hours does only contain emails and meeting metrics. I had to also merge calls and IMs with them

Expected behavior
data2 <- data %>% mutate(After_hours_collaboration_hours =
select(.,
After_hours_email_hours,
After_hours_meeting_hours,
After_hours_in_calls,
After_hours_instant_messages) %>%
apply(1, sum))

Add `create_trend()` and use a DRY architecture

There is currently not a general-purpose function called create_trend(), which should accomplish similar to what the others accomplish, e.g. create_bar() and create_line().

Furthermore, the package should align to the don't repeat yourself (DRY) principle and make any relevant functions (e.g. email_trend(), meeting_trend()) directly call create_trend().

Feature: check for spaces and "NA" in `validation_report()`

Spaces and other text strings such as "NA", "N/A", and "#N/A" do not currently get detected as missing values by validation_report(). This is worth flagging to the analyst because they are effectively missing values.

A line that flags the presence of such values if they exist, e.g. "There are x values which may potentially represent missing values." May also be helpful to show what these values are.

Add PDF export option to `export()`

Would like to add an option to export PDF for plots in the function export(). This is a more familiar format to SVG, but at the same time preserves resolution better than PNG.

collaboration_sum() error - not outputting my unscheduled_call_hours and instant_messages

Describe the bug
I tried to run the collaboration_sum() function with some data but it was only showing me Email and Call hours. But I know that we also have "teams" data available.

I looked at the basis of the function and it seemed to have problems with the if line of "unscheduled Calls".

In my dataset it was name "unscheduled_call_hours.

So I had to rename the col with:
colnames(clean_ca)[colnames(clean_ca) == "Unscheduled_call_hours"] <- "Unscheduled_Call_hours"

And after that it worked for me -> I now have the hoped for table:
image

Screenshots
image

Feature: auto-detect column names if not supplied for `network_g2g()`

Currently, column names have to be explicitly supplied for network_g2g(), although there is huge predictability on which ones are required, i.e. prefixed with TimeInvestors_ and Collaborator_.

It would be great to have a solution where it automatically uses these columns if none are supplied, and perhaps return a message notifying that this is a default behaviour. This will make it easy for users to run the function without supplying many arguments.

Feature: implement Community Detection with `network_g2g()`

Problem

Currently, the network_g2g() only returns a network visual, and there are no complementary methods to derive more insights around it.

Suggested solution

An new function or an option that identifies group-based communities in a group-to-group network. One option is to use the Louvain method to maximise modularity, where modularity would be the measure of the strength of division of a network into modules (or clusters).

References

Layout of network graph

When I am plotting a network graph (using Louvain) the layout seems to be random.

Can we consider enabling the option of a force-directed layout that minimizes edges crossing and prevents overlap? (like Fruchterman-Reingold or Kamada Kawai?

Fix: no output is generated for `collab_line()`

Describe the bug
I am using wpa package โ€˜1.4.0โ€™ and I tried to use the collab_line(sq_data) function - the documentation tells me that there will be a plot or table output, but I am not getting any output at all.

Expected behavior
I would have expected an output as a table or plot

Screenshots
If applicable, add screenshots to help explain your problem.
image
image

import_wpa does not support double-bite characters

Describe the bug
When a query data with double bite characters is imported using import_wpa, those characters are garbled.

To Reproduce
Steps to reproduce the behavior:

  1. Prepare query data with double bite characters as values (not headers, of course)
  2. Use import_wpa to import the data
  3. View the imported data. You will see gabled characters in the table.

Expected behavior
Double bite characters should remain legible.

Screenshots
None

Additional context
Specifying encoding as UTF-8 should solve this bug.

Feature request: interval_compare()

Is your feature request related to a problem? Please describe.
A flexible function to compare changes period on period across HR Attributes.

Describe the solution you'd like
A function that calculates the averages of any wpa metric for a baseline and a follow up period, and their corresponding change.
API:

interval_compare(
data,
hrvar,
compvar,
before_start = min(as.Date(data$Date, "%m/%d/%Y")),
before_end,
after_start = as.Date(before_end) + 1,
after_end = max(as.Date(data$Date, "%m/%d/%Y")),
return = "count"
)

Return: Table
group Before After Delta

1 Biz Dev 7.02 7.72 0.70

Return: Plot

image

Documentation: Fix Families

Is your feature request related to a problem? Please describe.
Current Family structure is inconsistent and not very useful.

Describe the solution you'd like
Suggestion to move 8 pillars

  • Plot and Data Visualisation
  • Data Validation
  • Data Import / Export
  • Quickstart Reports
  • Text Mining
  • Variable Importance (Rank, Information Value)
  • Network Analysis
  • Clustering / Community Detection

Feature request: `meeting_classify()` by subject line

This is a feature request for a meeting_classify() (or similarly named) function that classifies meetings in a meeting query based on the keywords that appear in them. Each classification is for ONE binary match, and the API could look something like:

meeting_classify(
  mt_data,
  category = "Customer",
  keywords = c("Customer", "Sales")
)

In this case, you will get a column called Customer and a TRUE or FALSE flag to signify whether that keyword has appeared. This can be wrapped into a wider function that performs multiple classifications in the meeting, and enhance the current meeting_tm_report().

Feature: histogram visualization - `create_hist()`

Is your feature request related to a problem? Please describe.
Some WpA metrics (like workload generated) as best visualized using a histogram / frequency distribution (company wide or comparing histograms across values of an HR attribute - like level).

Describe the solution you'd like
Flexible create_histogram function. Could power other functions (eg collaboration_histogram)

Feature request: ingest Odata links

It would be great to explore an option for ingesting Odata links from Workplace Analytics, with also the ability to authenticate. This can provide an alternative to CSV inputs.

Here is a reference package whereby this can be done:
https://cran.r-project.org/web/packages/OData/index.html

Other references

Documentation: unwrap `dontrun` examples where not necessary

Please unwrap the examples if they are executable in < 5 sec, or replace \dontrun{} with \donttest{}. This is more for CRAN compliance reasons.

\dontrun{} should only be used if the example really cannot be executed (e.g. because of missing additional software, missing API keys, ...) by the user. That's why wrapping examples in \dontrun{} adds the comment ('# Not run:') as a warning for the user.

Feature change: align data validation logic with Power BI dashboards

Currently, there are certain known differences in logic which makes the data validation process between the R package different to the Power BI dashboards. For instance:

  1. {wpa} uses the direct Collaboration_hours metric which currently does not include Unscheduled_Call_hours and Instant_Message_hours. The Power BI dashboard calculates this.
  2. identify_nkw() uses a greater than (>) for the collaboration hours threshold. In the Power BI, greater than or equal to (>=) logic is used. The current workaround is to supply a value like 4.9999 instead of 5 to align.

The first point also applies to After_hours_collaboration_hours (as mentioned in #74), but does not affect data validation.

Feature request: one2one_freq()

Is your feature request related to a problem? Please describe.
A function to calculate the typical frequency of one2one meetings.

Describe the solution you'd like
Option to return Averages by org:
image

Option to return Distributions by org:

image

No network plotting function for the person-to-person and person-to-group query

Is your feature request related to a problem? Please describe.
There is currently no network plotting function to plot from the person-to-person (P2P) and the person-to-group (P2G) query.

Describe the solution you'd like
Perhaps a p2g_network() and a p2p_network(), with a similar output and structure as the current g2g_network().

Variable name check should be optional in check_query function

Is your feature request related to a problem? Please describe.
We are currently using check_query(return = "text") at the beginning of each one of our reports. This is a great summary of what the query contains, but also checks the names of variables. This seems out of place.

Describe the solution you'd like
Make the name check optional

Documentation: Add examples of the interactive reports

Currently, there are no examples of what the interactive report outputs look like (e.g. collaboration_report(), validation_report()). It would be helpful to see these as part of the current pkgdown site, perhaps hosted as a static HTML file.

Feature request: automated analysis "tables" in Excel

Here is an idea inspired by market research practices....

For survey analysis, traditionally people run "tables", which is like 50 odd pages of data tables that have all the means, medians, % of contingency pre-run for an entire questionnaire. It's basically like sufficient to do a substantial piece of analysis on it. It's great for very fast data exploration for analysts and detail-oriented customers, even though it's not necessarily something busy stakeholders would want.

I was thinking whether we can re-produce something similar with the R package - i.e. an Excel workbook output with one sheet per table. Almost like a keymetrics_scan() per value per org. It's overwhelming and is almost like appendix material, but you almost just run it once and barely have to look back again the analysis.

We may require a writexl dependency or suggests. For naming, we can discuss but a starting point could be: keymetrics_tables().

Enhancement: improve output of the "describe" function

When passing "describe" to the return function I get a list of combination of attributes with a % that describes what percentage of the total population in the company with that respective (combination of) attribute(s) falls in the respective community.

I expect the function to return the opposite: the % of of the communities population with that respective (combination of) attribute(s).

Can we fix this?

Second it would be nice to shorten the list of outputs by filtering on a combination of a minimum of 2 attributes (most of the time 1 attribute on it's own doesn't help very much).

Bug: `create_dist()` assume metric is in hours

Describe the bug
When you create a custom dist with Create_Dist, the labels show "hours", even if you are

To Reproduce
Steps to reproduce the behavior:

sq_data %>% select("PersonId", "Date", "Meetings_with_manager_1_on_1", "Organization") %>% group_by(PersonId)  %>% mutate(total=sum(Meetings_with_manager_1_on_1), weeks=n())  %>% mutate(Frequency_of_1_on_1_with_manager = (1 - (total/weeks))) %>%  create_dist(metric="Frequency_of_1_on_1_with_manager", hrvar="Organization", cut = c(.1, .25, 5))

wpa export 20210218_151307

Fix: do not change user options or par for `network_p2p()`

Currently there is a par() argument used within network_p2p(), network_leiden(), and network_louvain() where user's plotting options are changed within the function. This is not allowed as per CRAN submission requirements. Full detail are:

Please make sure that you do not change the user's options, par or
working directory. If you really have to do so within functions, please
ensure with an immediate call of on.exit() that the settings are reset
when the function is exited. e.g.:
...
oldpar <- par(no.readonly = TRUE) # code line i
on.exit(par(oldpar)) # code line i + 1
...
par(mfrow=c(2,2)) # somewhere after
...

...
old <- options() # code line i
on.exit(options(old)) # code line i+1
...
options(digits = 3)
...
e.g.:
If you're not familiar with the function, please check ?on.exit. This
function makes it possible to restore options before exiting a function
even if the function breaks. Therefore it needs to be called immediately
after the option change within a function.

Feature: plot for collaboration_rank()

Is your feature request related to a problem? Please describe.
Collaboration_Rank is missing a plot.

Describe the solution you'd like
Lets add a killer visual!

Describe alternatives you've considered
See attachment!
collab_rank

Additional context
This will be awesome!

Feature: option in `extract_hr()` to exclude single-group variables (e.g. Domain, Timezone)

Is your feature request related to a problem? Please describe.
Currently extract_hr does a good job at extracting the full list of available HR variables available. However, many tenants include columns that constant (e.g. Domain, Timezone), and these are not useful for analysis / affect some applications (e.g. create_Rank). See example below.

Describe the solution you'd like
It would be good that extract_hr had an option to exclude HR attributes without variability. Potentially a exclude_constants parameter like:
extract_hr(data, exclude_constants= TRUE, max_unique = 50, return = "names")

Example
image

Feature change: `network_g2g()` should return a matrix, not a long table

Currently, network_g2g() returns a "long" table when 'table' is passed to return. However, it is more useful for user to actually get an interaction matrix, as they will need to further manipulate the table in order to get to a matrix.

The suggested solution is for network_g2g() to return an interaction matrix rather than long a long table.

Feature: show company total

Is your feature request related to a problem? Please describe.
It is not easy to get the graphs and tables for the whole compnay, without breaking it down into an HR attribure

Describe the solution you'd like
One option could be to have the option of typing Hrvar= "Total"

Describe alternatives you've considered
It could also be added at the end, or the default when you don't have an HRvar

Additional context
Add any other context or screenshots about the feature request here.

Improve consistency of working patterns functions

Is your feature request related to a problem? Please describe.
Currently we have three working patterns functions. However their behaviour is inconsistent:

  • Area plots can graph activity by day for categories within a HR attribute (this is the desired behaviour)
  • Rank plots a graph for entire company but not for a HR attribute.
  • Hclust only does clustering for the Volume / area graph

Describe the solution you'd like
Two main actions:

  • Update rank function so it can plot based on an HR attribute (Same graph, several columns)
  • Update hclust function so it can do clusters based on binary signal (same output as rank function with HR attribute, just that by cluster)

Bug/Feature request: current `IV_by_period()` has very limited return options

Currently, the function IV_by_period() can only return a "table" option. There are many other viable return options, including the original IV object, a plot, or a list of the WOE tables. We can reference create_IV() to return a consistent set of outputs.

Have marked this function as experimental life stage in #67 for this reason.

Feature: option to customize org data threshold in validation_report()

Is your feature request related to a problem? Please describe.
There is currently no argument or option within validation_report() to customize the threshold for detecting organizational variables. For instance, some perfectly valid org data variables like Offices could likely exceed 100 (default threshold), but should still be covered in the validation_report().

Describe the solution you'd like
An additional argument in validation_report() that pipes through to hrvar_count_all(), perhaps call it hrvar_threshold.

Feature: export more arguments for validation_report()

Currently, there is a very limited range of arguments in validation_report(). For instance, it is not possible to change the outlook hour threshold settings from the report itself.

The arguments available to the individual functions within validation_report() should be made available to validation_report() itself.

Add documentation on customizing plot outputs

Would be great to have some documentation and examples on how to customize the plot outputs from wpa functions, i.e. layering + ggtitle() or flipping the coordinates of the plots.

Recommend Projects

  • React photo React

    A declarative, efficient, and flexible JavaScript library for building user interfaces.

  • Vue.js photo Vue.js

    ๐Ÿ–– Vue.js is a progressive, incrementally-adoptable JavaScript framework for building UI on the web.

  • Typescript photo Typescript

    TypeScript is a superset of JavaScript that compiles to clean JavaScript output.

  • TensorFlow photo TensorFlow

    An Open Source Machine Learning Framework for Everyone

  • Django photo Django

    The Web framework for perfectionists with deadlines.

  • D3 photo D3

    Bring data to life with SVG, Canvas and HTML. ๐Ÿ“Š๐Ÿ“ˆ๐ŸŽ‰

Recommend Topics

  • javascript

    JavaScript (JS) is a lightweight interpreted programming language with first-class functions.

  • web

    Some thing interesting about web. New door for the world.

  • server

    A server is a program made to process requests and deliver data to clients.

  • Machine learning

    Machine learning is a way of modeling and interpreting data that allows a piece of software to respond intelligently.

  • Game

    Some thing interesting about game, make everyone happy.

Recommend Org

  • Facebook photo Facebook

    We are working to build community through open source technology. NB: members must have two-factor auth.

  • Microsoft photo Microsoft

    Open source projects and samples from Microsoft.

  • Google photo Google

    Google โค๏ธ Open Source for everyone.

  • D3 photo D3

    Data-Driven Documents codes.