Giter Club home page Giter Club logo

vscode-notebook-renderers's Introduction

Renderers for Jupyter Notebooks in Visual Studio Code

A Visual Studio Code extension that provides renderers for outputs of Jupyter Notebooks.

Getting Started

  • Install this extension
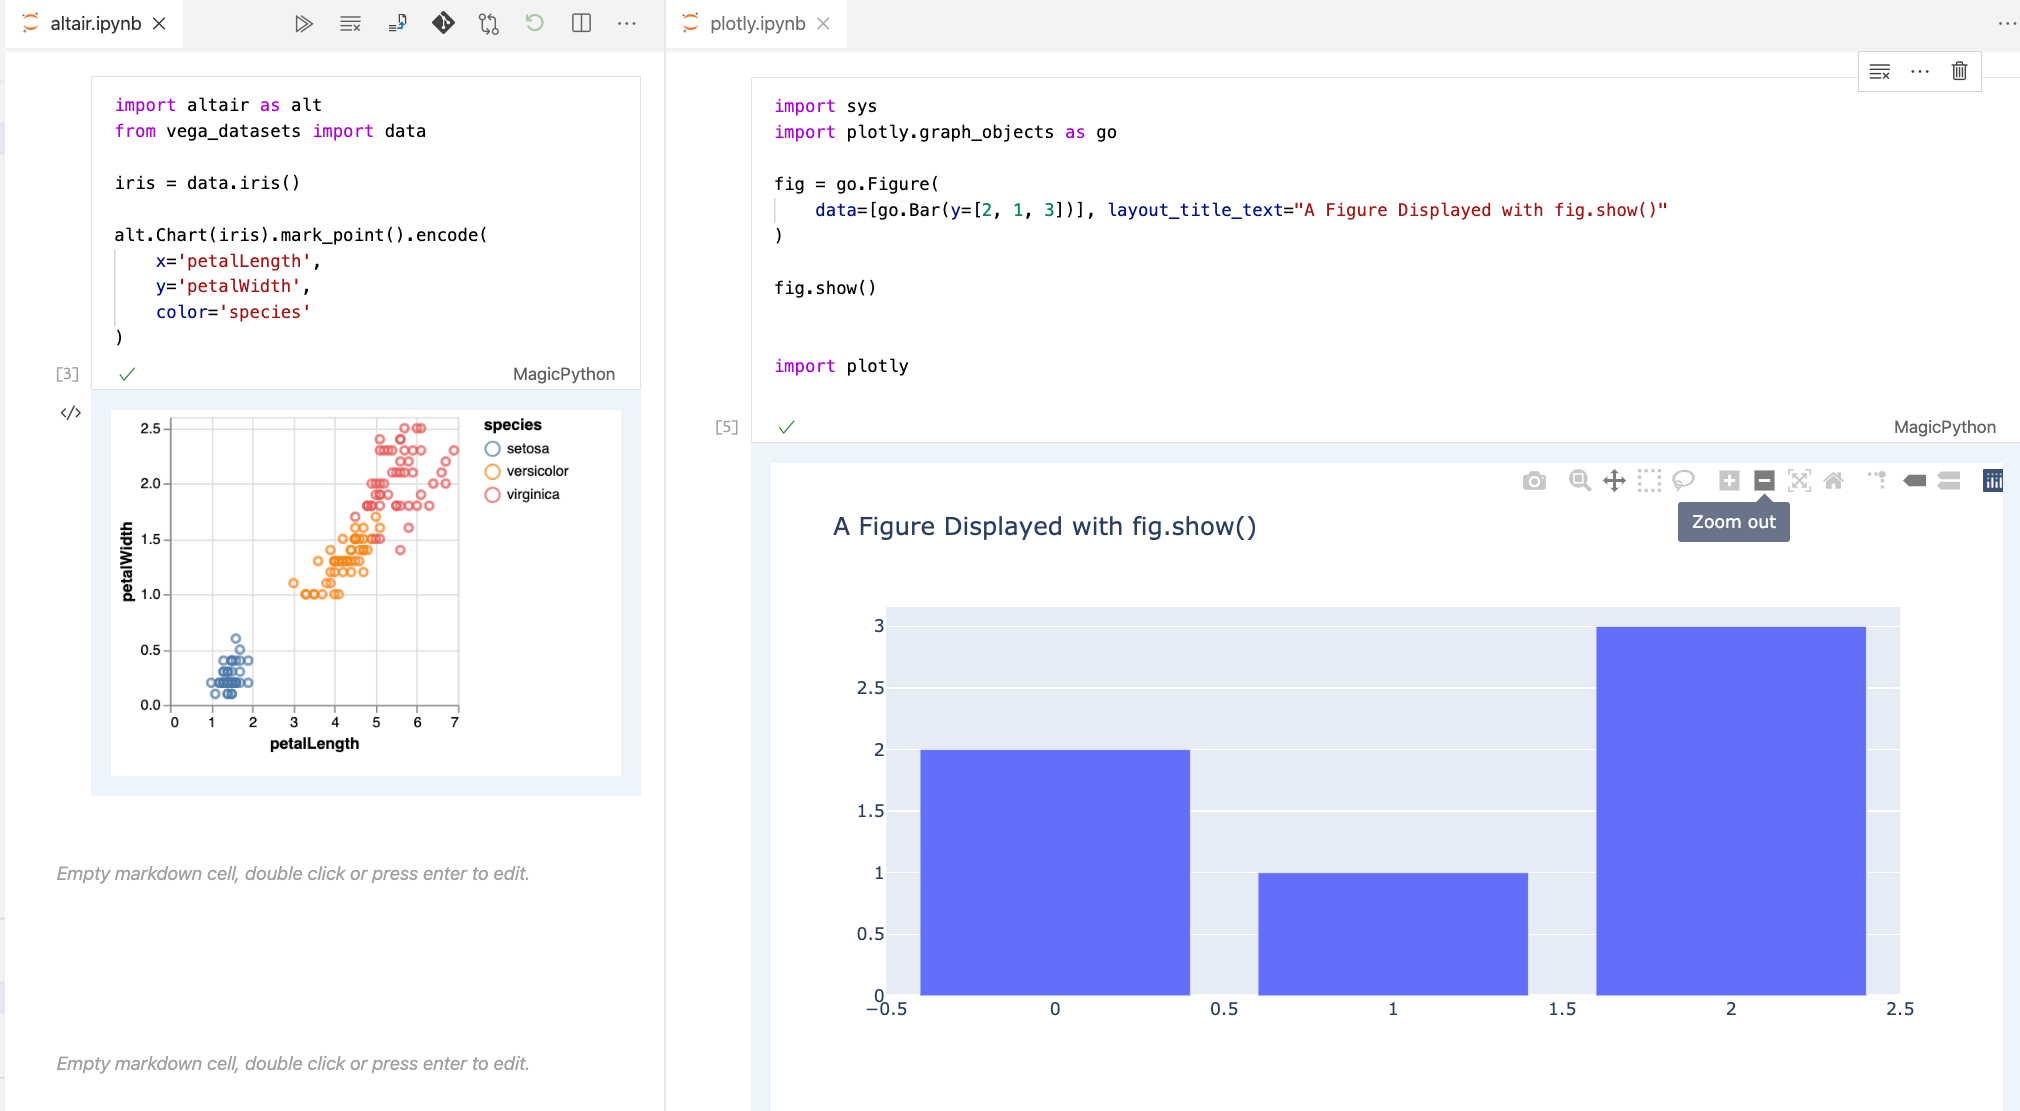
  • Open a Jupyter Notebook in VS Code
  • Outputs of the following mime type will be rendered by this extension:
    • image/gif
    • image/png
    • image/jpeg
    • image/svg+xml
    • image/webp
    • application/geo+json
    • application/vdom.v1+json
    • application/vnd.dataresource+json
    • application/vnd.plotly.v1+json
    • application/vnd.vega.v2+json
    • application/vnd.vega.v3+json
    • application/vnd.vega.v4+json
    • application/vnd.vega.v5+json
    • application/vnd.vegalite.v1+json
    • application/vnd.vegalite.v2+json
    • application/vnd.vegalite.v3+json
    • application/vnd.vegalite.v4+json
    • application/vnd.vegalite.v5+json
    • application/x-nteract-model-debug+json
    • text/vnd.plotly.v1+html

Contributing

This project welcomes contributions and suggestions. Most contributions require you to agree to a Contributor License Agreement (CLA) declaring that you have the right to, and actually do, grant us the rights to use your contribution. For details, visit https://cla.opensource.microsoft.com.

When you submit a pull request, a CLA bot will automatically determine whether you need to provide a CLA and decorate the PR appropriately (e.g., status check, comment). Simply follow the instructions provided by the bot. You will only need to do this once across all repos using our CLA.

This project has adopted the Microsoft Open Source Code of Conduct. For more information see the Code of Conduct FAQ or contact [email protected] with any additional questions or comments.

vscode-notebook-renderers's People

Contributors

amunger avatar blackhc avatar dependabot[bot] avatar donjayamanne avatar ianmatthewhuff avatar joyceerhl avatar lramos15 avatar lszomoru avatar microsoftopensource avatar mjbvz avatar mohtar avatar nicolaskruchten avatar rchiodo avatar rebornix avatar someguynamedjosh avatar

Stargazers

 avatar  avatar  avatar  avatar  avatar  avatar  avatar  avatar  avatar  avatar  avatar  avatar  avatar  avatar  avatar  avatar  avatar  avatar  avatar  avatar  avatar  avatar  avatar  avatar  avatar  avatar  avatar  avatar  avatar  avatar  avatar  avatar  avatar  avatar  avatar  avatar  avatar  avatar  avatar  avatar  avatar  avatar  avatar  avatar  avatar  avatar  avatar  avatar  avatar  avatar  avatar  avatar  avatar  avatar  avatar  avatar  avatar  avatar  avatar  avatar  avatar  avatar  avatar  avatar  avatar  avatar  avatar  avatar  avatar  avatar  avatar  avatar  avatar  avatar  avatar  avatar  avatar  avatar  avatar  avatar  avatar  avatar  avatar  avatar  avatar  avatar  avatar  avatar  avatar  avatar  avatar  avatar  avatar  avatar  avatar  avatar  avatar  avatar  avatar  avatar

Watchers

 avatar  avatar  avatar  avatar  avatar  avatar  avatar  avatar  avatar  avatar  avatar  avatar  avatar  avatar  avatar  avatar  avatar  avatar

vscode-notebook-renderers's Issues

notebook outline not updated

Type: Bug

When I add a new markdown cell and create more outline titles, e.g. # test outline2, the OUTLINE in the EXPLORER in on the left side window does not automaticly update until I click other icons on the left side bar (e.g. search or source control) then click back to Explorer. That is very unconvenient. It is ok on the previous insider version.

Extension version: 1.0.17
VS Code version: Code - Insiders 1.82.0-insider (ccb95fd921349023027a0df25ed291b0992b9a18, 2023-08-17T05:33:29.141Z)
OS version: Windows_NT x64 10.0.22621
Modes:
Remote OS version: Linux x64 5.15.90.1-microsoft-standard-WSL2

System Info
Item Value
CPUs AMD Ryzen 9 5950X 16-Core Processor (32 x 3400)
GPU Status 2d_canvas: enabled
canvas_oop_rasterization: enabled_on
direct_rendering_display_compositor: disabled_off_ok
gpu_compositing: enabled
multiple_raster_threads: enabled_on
opengl: enabled_on
rasterization: enabled
raw_draw: disabled_off_ok
video_decode: enabled
video_encode: enabled
vulkan: disabled_off
webgl: enabled
webgl2: enabled
webgpu: enabled
Load (avg) undefined
Memory (System) 127.93GB (100.90GB free)
Process Argv --crash-reporter-id 37912040-c721-4ea4-9cc9-539e301e87e2
Screen Reader no
VM 0%
Item Value
Remote WSL: Ubuntu-22.04
OS Linux x64 5.15.90.1-microsoft-standard-WSL2
CPUs AMD Ryzen 9 5950X 16-Core Processor (32 x 3400)
Memory (System) 98.23GB (95.56GB free)
VM 0%
A/B Experiments
vsliv695:30137379
vsins829:30139715
vsliv368:30146709
vsreu685:30147344
python383:30185418
vspor879:30202332
vspor708:30202333
vspor363:30204092
vstes516:30244333
vslsvsres303:30308271
pythontb:30258533
pythonptprofiler:30281269
vshan820:30294714
vscod805cf:30301675
bridge0708:30335490
bridge0723:30353136
vsaa593:30376534
pythonvs932:30404738
py29gd2263:30784851
vsclangdf:30492506
c4g48928:30535728
dsvsc012cf:30540253
pynewext54:30618038
showlangstatbar:30737417
24365598:30687740
pythonfmttext:30716741
pythoncmvfstr:30726892
fixshowwlkth:30771523
showindicator:30805243
pythongtdpath:30726887
i26e3531:30792625
gsofa:30797620
pythonnosmt12:30779711
pythonidxpt:30768918
pythonnoceb:30776497
copilotsettingt:30808721
e537b577:30772214
h0f32768:30792099
asynctokenver:30799129
dsvsc013:30777762
dsvsc014:30777825
diffeditorv2:30786206

IPyWidgets not working with Jupyter Kernel

VS Code Version: 1.75.1 (Universal)

Whenever I am using sth with ipywidgets in a jupyter notebook in VS code, I get the notification from the screenshot that says: "The installed version of the Renderer Extension is outdated and required and update to view IPyWidgets. Click Yes to open Jupyter Notebook Renderer Extension installation page." However, I already have the latest version and tried multiple other version but nothing changes. Other than that there is no error message or something, the widget is simply not displayed. But it blocks the whole notebook because it's stuck with the command where the widget should be generated.

I already tried a lot, downgrading libraries etc but cannot make it work.
Easy example to trigger the bug:

import ipywidgets as widgets


def run(a, b):
    print(f"Slider : {a}\nDropdown : {b}")

widgets.interact(
    run,
    a=widgets.IntSlider(
        value=1,
        min=1,
        max=3,
        step=1,
        description="Slider :",
    ),
    b=widgets.Dropdown(
        options=["1", "2", "3"],
        value="2",
        description="Dropdown :",
        disabled=False,
    ),
)

Bildschirm­foto 2023-02-24 um 08 27 15

I am using pipenv to handle the venv:
pipenv run jupyter --version
Output:
Selected Jupyter core packages...
IPython : 8.10.0
ipykernel : 6.21.2
ipywidgets : 7.7.3
jupyter_client : 8.0.3
jupyter_core : 5.2.0
jupyter_server : 2.3.0
jupyterlab : 3.6.1
nbclient : 0.7.2
nbconvert : 7.2.9
nbformat : 5.7.3
notebook : 6.5.2
qtconsole : not installed
traitlets : 5.9.0

Do Not See nteract Rendering

Hello.

I followed this post https://devblogs.microsoft.com/dotnet/net-interactive-with-sql-net-notebooks-in-visual-studio-code/#querying-and-visualizing-data
and was able to query some data in my database. Unfortunately, it doesn't appear to be rendering with nteract as described.

The results of the query are displayed using the nteract Data Explorer,providing a rich interactive filter and visualization experience where the user can explore their data in a number of ways.

Can anyone point me in the right direction here? I just see results as essentially an HTML table and the only other option is csv, but there appear to be no renderers available for that.

image

Thank you.

Wrap Interactive Window Output

The Interactive Window is not wrapping the output, therefore the user has to frequently horizontal scroll to see the result, which is very painful...
As an example, see screenshot below:
image

Is it possible to configure the renderer to auto-wrap the output?

Thank you

Установщик

We have written the needed data into your clipboard because it was too large to send. Please paste.

Error: "The installed version of the Renderer Extension is outdated [...]" even though it is up to date.

Type: Bug

Hello,

On a Jupyter notebook, I have the following in the first cell:

%matplotlib widget

When I try to run a cell that actually wants to display a plot, I'm presented with the following error:

The installed version of the Renderer Extension is outdated and requires an update to view IPyWidgets. 
Click Yes to open Jupyter Notebook Renderer Extension installation page. 

I have automatic updates on all extensions, so it's not out of date.

Relevant extensions:

Extension Author (truncated) Version
isort ms- 2023.9.10461023
pylint ms- 2023.3.10391012
python ms- 2023.3.10461028
vscode-pylance ms- 2023.2.20
jupyter ms- 2023.2.1000471055
jupyter-keymap ms- 1.0.0
jupyter-renderers ms- 1.0.14
vscode-jupyter-cell-tags ms- 0.1.6
vscode-jupyter-powertoys ms- 0.0.6
vscode-jupyter-slideshow ms- 0.1.5

Extension version: 1.0.14
VS Code version: Code 1.75.1 (441438abd1ac652551dbe4d408dfcec8a499b8bf, 2023-02-08T21:32:34.589Z)
OS version: Windows_NT x64 10.0.19045
Modes:
Sandboxed: Yes

System Info
Item Value
CPUs AMD Ryzen 5 4600H with Radeon Graphics (12 x 2994)
GPU Status 2d_canvas: enabled
canvas_oop_rasterization: disabled_off
direct_rendering_display_compositor: disabled_off_ok
gpu_compositing: enabled
multiple_raster_threads: enabled_on
opengl: enabled_on
rasterization: enabled
raw_draw: disabled_off_ok
skia_renderer: enabled_on
video_decode: enabled
video_encode: enabled
vulkan: disabled_off
webgl: enabled
webgl2: enabled
webgpu: disabled_off
Load (avg) undefined
Memory (System) 15.36GB (5.78GB free)
Process Argv --no-sandbox --crash-reporter-id 5fb2a04f-d73a-4990-ab57-e4870467f19e
Screen Reader no
VM 0%
A/B Experiments
vsliv368cf:30146710
vsreu685:30147344
python383cf:30185419
vspor879:30202332
vspor708:30202333
vspor363:30204092
vslsvsres303:30308271
pythonvspyl392:30443607
vserr242cf:30382550
pythontb:30283811
vsjup518:30340749
pythonptprofiler:30281270
vshan820:30294714
vstes263:30335439
vscoreces:30445986
pythondataviewer:30285071
vscod805:30301674
binariesv615:30325510
bridge0708:30335490
bridge0723:30353136
cmake_vspar411:30581797
vsaa593cf:30376535
pythonvs932:30410667
cppdebug:30492333
vscaac:30438847
vsclangdf:30486550
c4g48928:30535728
dsvsc012cf:30540253
azure-dev_surveyone:30548225
pyindex848:30662994
nodejswelcome1cf:30587006
282f8724:30602487
pyind779cf:30662993
f6dab269:30613381
pythonsymbol12:30657548
2i9eh265:30646982
vsctsb:30662444
vscodeenable:30660116

Error loading preloads. Errors failing to display in Jupyter Interactive

Issue Type: Bug

Open a Jupyter Interactive Window.
Do something that causes an error:

1 / 0

Output:

Error loading preloads:
Failed to fetch dynamically imported module: https://file+.vscode-resource.vscode-webview.net/c%3A/Users/104104/.vscode-insiders/extensions/ms-toolsai.jupyter-2022.1.1001605991/out/datascience-ui/errorRenderer/errorRenderer.js

Extension version: 1.0.4
VS Code version: Code - Insiders 1.64.0-insider (e8a26d3ebf5095d4324ad4bf794787540ed3b33e, 2021-12-21T05:15:30.501Z)
OS version: Windows_NT x64 10.0.19042
Restricted Mode: No

System Info
Item Value
CPUs Intel(R) Core(TM) i7-10850H CPU @ 2.70GHz (12 x 2712)
GPU Status 2d_canvas: enabled
gpu_compositing: enabled
multiple_raster_threads: enabled_on
oop_rasterization: enabled
opengl: enabled_on
rasterization: enabled
skia_renderer: enabled_on
video_decode: enabled
vulkan: disabled_off
webgl: enabled
webgl2: enabled
Load (avg) undefined
Memory (System) 15.61GB (3.76GB free)
Process Argv --crash-reporter-id cb42f697-ad09-444c-b86d-8cd62a1d3e46
Screen Reader no
VM 0%
A/B Experiments
vsliv695:30137379
vsins829:30139715
vsliv368cf:30146710
vsreu685:30147344
python383:30185418
vspor879:30202332
vspor708:30202333
vspor363:30204092
pythontb:30258533
pythonvspyt551cf:30291413
pythonptprofiler:30281269
vshan820:30294714
pythondataviewer:30285072
vscod805:30301674
pythonvspyt200:30323110
bridge0708:30335490
bridge0723:30353136
vsaa593:30376534
pythonvs932:30404738
vscop804cf:30404767
vscop453:30404998
vsclayoutctrc:30405799
py55gd98:30408621
vscexrecpromp3c:30407757
azactmsal:30409287

Output Rendering Misalignment

Hi This is potentially not a bug nor an issue. But since I upgraded my Mac OS to Monterey version, the rendering is now somehow giving me issues.

My Mac:

  System Version:	macOS 12.2.1 (21D62)
  Kernel Version:	Darwin 21.3.0
  Boot Volume:	Macintosh HD

pd.Series misalignment:
df_raw['CONVERTED_PCT_T12'].describe()

count 5300.000000
mean 0.005806
std 0.024838
min 0.000000
25% 0.000000
50% 0.000000
75% 0.000000
max 0.285714

Screen Shot 2022-03-09 at 11 48 12 PM

Inconsistent font rendering

Issue Type: Bug

Compare text in a plain Markdown file and a Markdown cell in a Jupyter notebook. In edit mode both look the same:

Screenshot from 2021-12-17 12-26-23

In preview mode, font sizes in the Markdown file look consistent with the edit mode. However, fonts in the Jupyter notebook look ginormous:

Screenshot from 2021-12-17 12-26-42

Extension version: 1.0.4
VS Code version: Code - Insiders 1.64.0-insider (886fd126446cd4b8b03f2b32f09c173dec541e6d, 2021-12-14T17:34:32.388Z)
OS version: Linux x64 5.13.0-22-generic
Restricted Mode: No

System Info
Item Value
CPUs Intel(R) Core(TM) i7-1065G7 CPU @ 1.30GHz (8 x 1500)
GPU Status 2d_canvas: enabled
gpu_compositing: enabled
multiple_raster_threads: enabled_on
oop_rasterization: disabled_off
opengl: enabled_on
rasterization: disabled_software
skia_renderer: enabled_on
video_decode: disabled_software
vulkan: disabled_off
webgl: enabled
webgl2: enabled
Load (avg) 2, 1, 1
Memory (System) 15.22GB (1.99GB free)
Process Argv --unity-launch --crash-reporter-id 2273c5d1-5f55-44d1-afd8-13c81c1bf0ca
Screen Reader no
VM 0%
DESKTOP_SESSION ubuntu
XDG_CURRENT_DESKTOP Unity
XDG_SESSION_DESKTOP ubuntu
XDG_SESSION_TYPE x11

High IDL CPU Consumption

Type: Bug

Hey there,

with the help of vscode "Help: Start Extension Bisect" I found out that the above extension seems to be the reason for a very high CPU consumption during idl. I did not run any script but just had ipynb files open and all my CPU cores were used at very high percentage for a longe time.

Kind regards
Marius

Extension version: 1.0.17
VS Code version: Code 1.86.2 (903b1e9d8990623e3d7da1df3d33db3e42d80eda, 2024-02-13T19:40:56.878Z)
OS version: Windows_NT x64 10.0.19045
Modes:
Connection to 'ssh-remote+mogon' could not be established

System Info
Item Value
CPUs Intel(R) Core(TM) i7-7700HQ CPU @ 2.80GHz (8 x 2808)
GPU Status 2d_canvas: enabled
canvas_oop_rasterization: enabled_on
direct_rendering_display_compositor: disabled_off_ok
gpu_compositing: enabled
multiple_raster_threads: enabled_on
opengl: enabled_on
rasterization: enabled
raw_draw: disabled_off_ok
skia_graphite: disabled_off
video_decode: enabled
video_encode: enabled
vulkan: disabled_off
webgl: enabled
webgl2: enabled
webgpu: enabled
Load (avg) undefined
Memory (System) 15.86GB (4.30GB free)
Process Argv --crash-reporter-id 2ec5ec3d-1115-444e-9f5c-101ba0c214db
Screen Reader no
VM 0%

Connection to 'ssh-remote+mogon' could not be established

A/B Experiments
vsliv368:30146709
vspor879:30202332
vspor708:30202333
vspor363:30204092
vswsl492:30256859
vscorecescf:30445987
vscod805:30301674
binariesv615:30325510
vsaa593cf:30376535
py29gd2263:30899288
c4g48928:30535728
azure-dev_surveyone:30548225
962ge761:30959799
pythongtdpath:30769146
welcomedialog:30910333
pythonidxpt:30866567
pythonnoceb:30805159
asynctok:30898717
pythontestfixt:30902429
pythonregdiag2:30936856
pyreplss1:30897532
pythonmypyd1:30879173
pythoncet0:30885854
2e7ec940:30968132
pythontbext0:30879054
accentitlementst:30887150
dsvsc016:30899300
dsvsc017:30899301
dsvsc018:30899302
edj9j583:30969295
7j2b6412:30969109

[docs] Help: Linking up the development build

I've followed the contributing docs to get the local dev build going. However, I can't seem to activate the local extension. Can the contributing guidelines give a bit more on how to get this package going? I'd love to fix several mimetypes.

New Window Crash

Type: Bug

I tried to open a new window and the system kept crashing

Extension version: 1.0.9
VS Code version: Code 1.82.2 (Universal) (abd2f3db4bdb28f9e95536dfa84d8479f1eb312d, 2023-09-14T05:59:47.790Z)
OS version: Darwin x64 21.6.0
Modes:

System Info
Item Value
CPUs Intel(R) Core(TM) i5-5257U CPU @ 2.70GHz (4 x 2700)
GPU Status 2d_canvas: enabled
canvas_oop_rasterization: disabled_off
direct_rendering_display_compositor: disabled_off_ok
gpu_compositing: enabled
multiple_raster_threads: enabled_on
opengl: enabled_on
rasterization: enabled
raw_draw: disabled_off_ok
video_decode: enabled
video_encode: enabled
vulkan: disabled_off
webgl: enabled
webgl2: enabled
webgpu: enabled
Load (avg) 11, 7, 4
Memory (System) 8.00GB (0.03GB free)
Process Argv --crash-reporter-id 1ee6bbb7-0aea-4394-8bc4-84aa8aa3d25b
Screen Reader no
VM 0%
A/B Experiments
vsliv368cf:30146710
vsreu685:30147344
python383:30185418
vspor879:30202332
vspor708:30202333
vspor363:30204092
vslsvsres303:30308271
vserr242cf:30382550
pythontb:30283811
vsjup518:30340749
pythonptprofiler:30281270
vshan820:30294714
vstes263:30335439
vscod805:30301674
binariesv615:30325510
bridge0708:30335490
bridge0723:30353136
vsaa593cf:30376535
pythonvs932:30410667
vsclangdf:30486550
c4g48928:30535728
dsvsc012cf:30540253
pynewext54:30695312
azure-dev_surveyone:30548225
3biah626:30602489
f6dab269:30613381
showlangstatbar:30737416
962ge761:30841074
a2ce3375:30757347
7ij38806:30736111
pythonfmttext:30731395
fixshowwlkth:30771522
showindicator:30805244
pythongtdpath:30769146
i26e3531:30792625
pythonnosmt12:30797651
pythonidxptcf:30805731
pythonnoceb:30805159
copilotsettingc:30839828
dsvsc013:30795093
dsvsc014:30804076
diffeditorv2:30821572
dsvsc015:30845448

Unset white background of SVG

Description

Currently, the SVG renderer forces the background to be white which doesn’t play well with dark mode. This is unlike the built-in renderer in VSCode which doesn't set it.

It’s caused by the following rule targeting the wrapping div.

.svgContainerStyle svg {
  background-color: white;
}

Steps To Reproduce

See denoland/deno#22427

Expected Result

expected

Actual Result

actual

Additional Information

  • Jupyter v2024.1.1

Exclude all `.map` files from extension bundle

Hi, I noticed that this extension currently includes a number of .map files that make up about 1/4 of the extension size:

4.0K    ./out/extension_renderer/constants.js.map
8.0K    ./out/extension_renderer/index.js.map
4.0K    ./out/client_renderer/preload.js.map
3.8M    ./out/client_renderer/vegaRenderer.js.map
468K    ./out/client_renderer/builtinRendererHooks.js.map
420K    ./out/client_renderer/renderers.js.map
4.6M    total

I suggest removing these from the published extension. I don't think they are useful, especially because the original sources are not included in the extension bundle

Release

  • Rename main branch
  • Change log, readme

plotly.js outdated version

Environment data

  • VS Code version: 1.86.2
  • Jupyter Extension version v2024-1-1
  • Python Extension version v2024.0.1
  • OS Windows 10
  • Python 3.10.9
  • Environment in docker
  • Jupyter server running: Remote

Expected behaviour

Some Latest plotly features are not working with the version of plotly.js proposed in VS code for jupyter notebooks. Can you update it?

I noticed it doing a sankey plot with a new argument called 'align' released in latest plotly version v5.19.0. In the following picture I expect the sankey plot to align to the left, but it does not as I have plotly.js v2.20.0 instead of v2.29.1 for example. I tried it in Jupyterlab and it works as expected. It is the following picture. You can read plotly.js version in the top right corner.

image

Actual behaviour

And Here is the final figure I get in VS code.

image

Steps to reproduce:

If needed, I can share with you the code I used.

Expand Image gets stuck when showing a wide but short image

After I draw a very wide but short image to show a time series and click the Expand Image button, the preview will get stuck when I enlarge it and drag from right to left.
This is the full image and I can drag it well.
image

But when I enlarge the image, I can't see the right part anyway.
image
The screenshot above is the rightest I can drag.

However, the left blank becomes more.
image

Only text/plain is available

I'm trying to see a simple image, and it is not showing. After quite a bit of searching, I discovered notebooks need a renderer, and this extension might be responsible for providing them.

However, the only available option for me is 'plain/text' . Can't figure out why...

Screenshot 2023-03-30 at 12 01 07

The extension is installed

Version

Version: 1.75.1
Commit: 441438abd1ac652551dbe4d408dfcec8a499b8bf
Date: 2023-02-08T21:34:59.000Z
Electron: 19.1.9
Chromium: 102.0.5005.194
Node.js: 16.14.2
V8: 10.2.154.23-electron.0
OS: Darwin x64 21.6.0
Sandboxed: No

Extensions installed on SSH: obiwan:

[email protected]
[email protected]
[email protected]
[email protected]
[email protected]
[email protected]
[email protected]
[email protected]
[email protected]
[email protected]
[email protected]
[email protected]
[email protected]

Not sure how to generate list of extensions locally

Updating Notebook results while the output is collapsed makes the output invisble when expanded again.

Type: Bug

When a notebook updates text in a collapsed cells unexpected things happen.

The Jupyter Notebook renders the output while still showing that the output is collapsed.

Node.JS Notebooks and httpBook show empty cells and will only show the output again when expanded, collapsed, expanded again

Extension version: 1.0.17
VS Code version: Code 1.83.1 (Universal) (f1b07bd25dfad64b0167beb15359ae573aecd2cc, 2023-10-10T23:46:55.789Z)
OS version: Darwin arm64 23.0.0
Modes:

System Info
Item Value
CPUs Apple M1 Max (10 x 24)
GPU Status 2d_canvas: enabled
canvas_oop_rasterization: enabled_on
direct_rendering_display_compositor: disabled_off_ok
gpu_compositing: enabled
multiple_raster_threads: enabled_on
opengl: enabled_on
rasterization: enabled
raw_draw: disabled_off_ok
video_decode: enabled
video_encode: enabled
vulkan: disabled_off
webgl: enabled
webgl2: enabled
webgpu: enabled
Load (avg) 2, 3, 3
Memory (System) 32.00GB (0.16GB free)
Process Argv
Screen Reader no
VM 0%

Outdated CONTRIBUTING docs

Hi there 👋 !

I wanted to build the extension on my own today, but noticed the CONTRIBUTING file is still mentioning Node 12 and npm 6, which do not work when setting up.

As stated previously, I tried building the extension, although it was successful at the end sometimes, I got timeouts and sometimes npm parse errors, it seems building as per the docs only works on Node 14. Maybe the package JSON should be updated to v2? I could not get the build to work when not installing deps cleanly, which might be a bug, or a feature 😄.

PS: maybe would be also useful to publish releases and add the .vsix file assets to them as file assets for easy download and debugging. I would love to help out with a workflow for this, but I am not sure how it might conflict with #25.

Plotly render issue inside ipywidgets output

Hi
This code works fine in Jupyter Lab, but there's no plot in VSCode:

import plotly.express as px
import ipywidgets as widgets
from IPython.display import display

df = px.data.iris()
fig = px.scatter(df, x="sepal_width", y="sepal_length", color="species", marginal_y="violin",
                 marginal_x="box", trendline="ols", template="plotly_dark")
 
out = widgets.Output()
display(out)

with out:
    fig.show()

EDIT:
Ok, I tested again with a remote jupyter server in VSC and it's now working!
But it doesn't work with local jupyter server, should I enable something?
Is there any workaround?

Cannot download pdf format from renderer

When trying to download a Cairo plot from the jupyter notebook renderer (image/svg+xml from ms-toolsai/jupyter-renderers) I'm unable to download the pdf format (I click save as pdf but nothings happens). The SVG save file works fine.

When opening the Plots using "Expand image" button there is another save button which can save in SVG, PNG (both working fine) and also PDF which gives an error

19:29:06.896 [info] exporting plot...
19:29:14.669 [info] Attempting pdf write...
19:29:14.669 [error] [TypeError: Invalid host defined options
	at iL (~\.vscode\extensions\ms-toolsai.jupyter-2024.1.1-win32-x64\dist\extension.node.js:362:62189)
	at kI.exportPlot (~\.vscode\extensions\ms-toolsai.jupyter-2024.1.1-win32-x64\dist\extension.node.js:362:61723)]

This is the code I used to replicate the bug (it uses the igraph library with pycairo)

import igraph as ig
graph = ig.Graph.Lattice((3, 3))
ig.plot(graph, layout="grid")

Versions
vscode 1.86.1
jupyter v2024.1.1
jupyter notebook renderers v1.0.17
python-igraph 0.11.3
pycairo 1.25.1

Requested feature: interactive JSON view

Code:

from IPython.display import JSON
JSON(my_dictionary)

Expected behavior (from other Jupyter editors): Interactive JSON view similar to that supported by browsers/. Allows expanding and collapsing the JSON tree structure.

Observed behavior: JSON is rendered as a single paragraph/blob with no interactivity.

I believe that implementing this would help data scientists using VS Code who work with JSON data with some regularity.

Type `application/vnd.dataresource+json` does not produce any visible output

I first discovered this issue while trying to use nodejs-polars in a Deno Jupyter kernel. Here's the example code for a notebook cell in Python:

from IPython.display import display

display(
    {
        "application/vnd.dataresource+json": {
            "data": [
                {"continent": "Africa", "total_pop_est": 993281878},
                {"continent": "Antarctica", "total_pop_es": 3802},
                {"continent": "Asia", "total_pop_es": 4085852698},
                {"continent": "Europe", "total_pop_es": 728131201},
                {"continent": "North America", "total_pop_es": 539350981},
                {"continent": "Oceania", "total_pop_es": 33519610},
                {"continent": "Seven seas (open ocean)", "total_pop_es": 140},
                {"continent": "South America", "total_pop_es": 394355478}
            ],
            "schema": {
                "fields": [
                    {"name": "continent", "type": "string"},
                    {"name": "total_pop_est", "type": "integer"}
                ]
            }
        },
        "text/html": "<table><thead><tr><th>continent</th><th>total_pop_est</th></tr></thead><tbody><tr><td>Africa</td><td>993281878</td></tr><tr><td>Antarctica</td><td>3802</td></tr><tr><td>Asia</td><td>4085852698</td></tr><tr><td>Europe</td><td>728131201</td></tr><tr><td>North America</td><td>539350981</td></tr><tr><td>Oceania</td><td>33519610</td></tr><tr><td>Seven seas (open ocean)</td><td>140</td></tr><tr><td>South America</td><td>394355478</td></tr></tbody></table>"
    },
    raw=True
)

Using the text/html presentation works fine. But the application/vnd.dataresource+json presentation does not, and produces basically nothing:

image

VS Code version: 1.85.1
Extension version: 1.0.17
OS: Windows 10

Plotly.js needs update

Environment data

  • VS Code version: 1.65.2
  • Jupyter Extension version: v2022.2.1030672458
  • Jupyter Notebook Renderers: v1.0.6
  • OS and version: Windows 10
  • Python version: 3.9.9
  • Type of virtual environment: NA
  • Jupyter server running: Local

Expected behaviour

Full functionality of latest Plotly Python package is available in VS code / Jupyter, i.e. text labels on heatmap segments are working when running with Plotly version 5.5.0+.

Actual behaviour

The example from https://plotly.com/python/heatmaps/#text-on-heatmap-points does not show the text labels in each color block when running in VS Code / Jupyter with the vscode renderer. It does show the labels when using the notebook renderer which uses the Plotly.js from the Python package.

Steps to reproduce:

import plotly.graph_objects as go

fig = go.Figure(data=go.Heatmap(
                z=[[1, 20, 30],
                  [20, 1, 60],
                  [30, 60, 1]],
                text=[['one', 'twenty', 'thirty'],
                      ['twenty', 'one', 'sixty'],
                      ['thirty', 'sixty', 'one']],
                texttemplate="%{text}",
                textfont={"size":20}))

fig.show()

Details

It looks like the Plotly.js version shipped with Jupyter Notebook Renderers is still version 2.7.0 while Plotly 5.5.0 was released with Plotly.js 2.8.3 and Plotly 5.6.0 (currently latest) was released with Plotly.js 2.9.0.

Recommend Projects

  • React photo React

    A declarative, efficient, and flexible JavaScript library for building user interfaces.

  • Vue.js photo Vue.js

    🖖 Vue.js is a progressive, incrementally-adoptable JavaScript framework for building UI on the web.

  • Typescript photo Typescript

    TypeScript is a superset of JavaScript that compiles to clean JavaScript output.

  • TensorFlow photo TensorFlow

    An Open Source Machine Learning Framework for Everyone

  • Django photo Django

    The Web framework for perfectionists with deadlines.

  • D3 photo D3

    Bring data to life with SVG, Canvas and HTML. 📊📈🎉

Recommend Topics

  • javascript

    JavaScript (JS) is a lightweight interpreted programming language with first-class functions.

  • web

    Some thing interesting about web. New door for the world.

  • server

    A server is a program made to process requests and deliver data to clients.

  • Machine learning

    Machine learning is a way of modeling and interpreting data that allows a piece of software to respond intelligently.

  • Game

    Some thing interesting about game, make everyone happy.

Recommend Org

  • Facebook photo Facebook

    We are working to build community through open source technology. NB: members must have two-factor auth.

  • Microsoft photo Microsoft

    Open source projects and samples from Microsoft.

  • Google photo Google

    Google ❤️ Open Source for everyone.

  • D3 photo D3

    Data-Driven Documents codes.