
Timeline Storyteller is an expressive visual storytelling environment for presenting timelines in the browser or in Microsoft Power BI.
Use it to present different aspects of timeline data using a palette of timeline representations, scales, and layouts, as well as controls for filtering, highlighting, and annotation.

To learn more about the research that informed this project, see timelinesrevisited.github.io, which includes a survey of timeline tools and more than 200 bespoke timelines.
See these examples of timelines and timeline stories made with Timeline Storyteller.
- Matthew Brehmer
- Bonghsin Lee
- Nathalie Henry Riche
- Darren Edge
- Christopher White
- Kate Lytvynets
- David Tittsworth
-
Clone the main branch of this repository:
git clone https://github.com/Microsoft/timelinestoryteller.git -
Open a terminal at the root of the repository and install node modules:
yarnORnpm_install. -
Build public/app/timelinestoryteller.js:
npm test -
Start the node server:
npm start -
Open localhost:8000
The application source code can be found in the src/ directory.
This respository contains the source for Timeline Storyteller as a standalone web application. To generate the Timeline Storyteller custom visual for Power BI, refer to github.com/Microsoft/PowerBI-visuals-TimelineStoryteller.
Timeline Storyteller currently supports datasets of events in CSV, JSON, or Google Spreadsheet format.
Each event is specified by the following attributes:
- Required:
start_date, date: YYYY, YYYY-MM-DD, or YYYY-MM-DD HH:MMZ (ISO 8601) formats are supported (Z necessary for specifying UTC, otherwise HH:MM will be time-zone dependent). BC dates are permitted, e.g., -27, -13800000000 - Optional:
end_date, date: using same format asstart_date - Optional:
category, a string corresponding to the category of the event (which Timeline Storyteller encodes as colour) - Optional:
facet,a string corresponding to another category of the event (which Timeline Storyteller uses to create a faceted timeline layout;categoryandfacetcan be identical if desired) - Optional:
content_text, a string description of the event (which Timeline Storyteller exposes as event annotations)
{ "start_date":"1775", "end_date":"1783", "content_text":"American Revolutionary War: an armed struggle for secession from the British Empire by the Thirteen Colonies that would subsequently become the United States.", "facet":"North America", "category":"North America" },
header row:
start_date,end_date,content_text,facet,category
example event row:
1775,1783,American Revolutionary War: an armed struggle for secession from the British Empire by the Thirteen Colonies that would subsequently become the United States.,North America,North America
Here is the The Daily Routines of Famous Creative People demo dataset used in Timeline Storyteller's demo in a Google Sheet.
- Ensure that the spreadsheet is published (open the Google Spreadsheet 'File' menu, select 'Publish to the Web').
- Ensure that
start_dateandend_datecolumns are formatted as text and not as dates (e.g.,'1926-06-29). - Required: Spreadsheet URL
- Optional: Worksheet title (i.e., tab name) for this dataset:
dailyroutines - Enter the spreadsheet URL and worksheet title into Timeline Storyteller's load dialog.
Note that more detailed usage instructions are available at timelinestoryteller.com
-
Load timeline data (demo dataset, JSON, CSV, Google Spreadsheet) or saved timeline story (a JSON Blob with extension .cdc; see step 6)
-
Select a combination of representation, scale, and layout from the menu at the top of the screen; only some combinations are valid; see our guidance on selecting appropriate combinations for your story. Mouseover these options to view a tooltip that describes how they might be useful.
-
Edit the canvas
-
Click on events to annotate with their
content_textlabel; resize and reposition labels; SHIFT + click to highlight events without showing label. -
Annotate with captions and images; resize and reposition captions and images.
-
Filter events by category, facet, or segment. Filter by highlighting emphasizing matching events (de-emphasizing non-matching events).
-
You can also filter by hiding non-matching events.
-
-
Record current canvas as a scene, which retains labels, captions, and images. Enter playback mode, navigate to previous / next recorded scene.
-
Export current canvas as a PNG, SVG.
-
Export the scenes as an animated GIF or as a JSON Blob (.cdc extension).
Timeline Storyteller
Copyright (c) Microsoft Corporation
All rights reserved.
MIT License
Permission is hereby granted, free of charge, to any person obtaining a copy of this software and associated documentation files (the Software), to deal in the Software without restriction, including without limitation the rights to use, copy, modify, merge, publish, distribute, sublicense, and/or sell copies of the Software, and to permit persons to whom the Software is furnished to do so, subject to the following conditions:
The above copyright notice and this permission notice shall be included in all copies or substantial portions of the Software.
THE SOFTWARE IS PROVIDED AS IS, WITHOUT WARRANTY OF ANY KIND, EXPRESS OR IMPLIED, INCLUDING BUT NOT LIMITED TO THE WARRANTIES OF MERCHANTABILITY, FITNESS FOR A PARTICULAR PURPOSE AND NONINFRINGEMENT. IN NO EVENT SHALL THE AUTHORS OR COPYRIGHT HOLDERS BE LIABLE FOR ANY CLAIM, DAMAGES OR OTHER LIABILITY, WHETHER IN AN ACTION OF CONTRACT, TORT OR OTHERWISE, ARISING FROM, OUT OF OR IN CONNECTION WITH THE SOFTWARE OR THE USE OR OTHER DEALINGS IN THE SOFTWARE.
If you use Timeline Storyteller to make a timeline for a research paper, you can cite us in two ways. You can cite the tool itself:
@misc{TimelineStoryteller, author = {Matthew Brehmer and Bongshin Lee and Nathalie Henry Riche and Darren Edge and Christopher White and Kate Lytvynets and David Tittsworth}, title = {Microsoft Timeline Storyteller}, year = {2017}, note = {\url{https://timelinestoryteller.com}} }
Or you can cite our recent journal paper about the timeline design space:
@article{Brehmer2016, author = {Matthew Brehmer and Bongshin Lee and Benjamin Bach and Nathalie Henry Riche and Tamara Munzner}, title = {Timelines Revisited: A Design Space and Considerations for Expressive Storytelling}, journal = {IEEE Transactions on Visualization and Computer Graphics (TVCG)}, year = {2017}, volume = {23}, issue = {9}, pages = {2151--2164}, doi = {10.1109/TVCG.2016.2614803}, ISSN = {1077-2626} }
- Priestley's Chart of Biography
- Great Philosophers since the 8th Century BC
- History's Largest Empires
- East Asian Dynasties
- Epidemics since the 14th Century
- Prime Ministers of Canada
- Presidents of France
- Chancellors of Germany
- Presidents of Italy
- Prime Ministers of Japan
- Prime Ministers of the UK
- Presidents of the USA
- C4-5 Hurricanes: 1960-2010
- The Daily Routines of Famous Creative People -'Visualizing painters' lives" by Accurat
- 'From first published to masterpieces' by Accurat
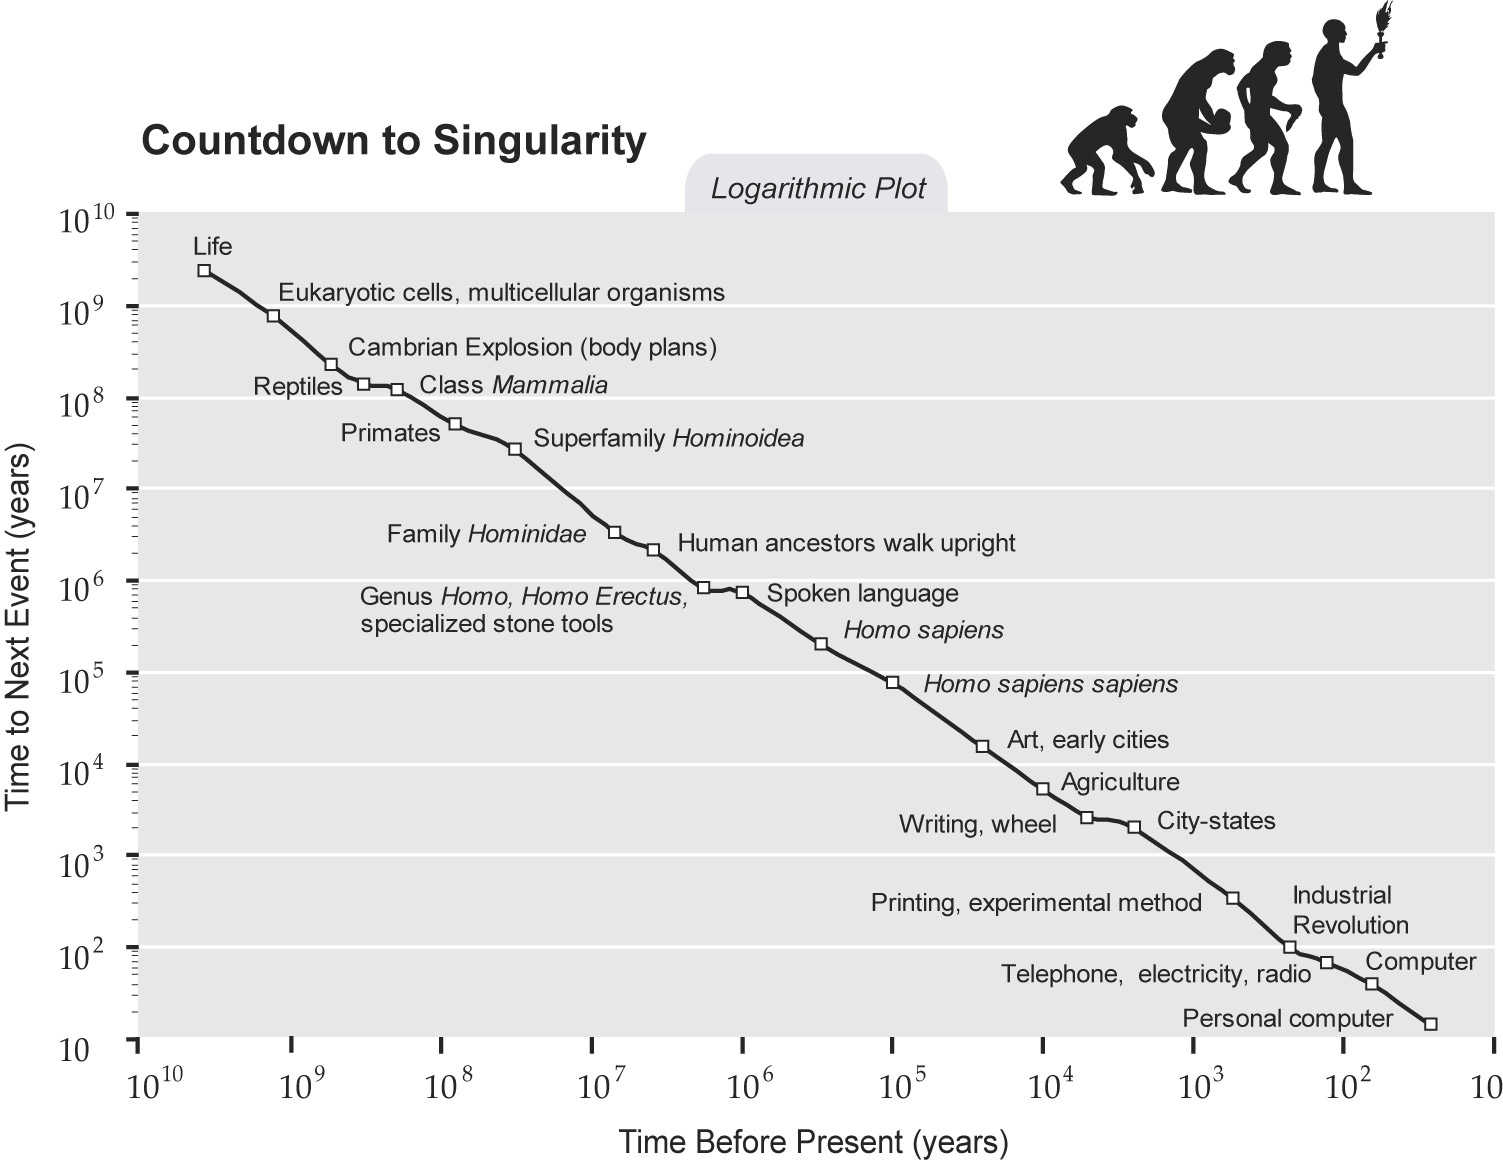
- Kurzweil's 'Countdown to Singularity'
- 'A Perspective on Time' by mayra.artes for Wait But Why
- 'Life of a Typical American' by Tim Urban for Wait But Why
All Icons CC BY 3.0, by name and author:
- check-mark (Arthur Shlain)
- calendar (Kiril Tomilov)
- timeline (Alecander Bickov)
- gif-file (Pranav Grover)
- png-file (Pranav Grover)
- svg-file (Pranav Grover)
- json-file (Pranav Grover)
- csv-file (Pranav Grover)
- drive (Denis Klyuchnikov)
- grid (Doejo)
- folder (iconoci)
- filter (Creative Shell)
- image (Creative Shell)
- quotation-mark (Veronika Krpciarova)
- pin (Alexandr Cherkinsky)
- eraser (Terrence Kevin Oleary)
- invisible (Kid A)
- book (Setyo Ari Wibowo)


![microsoft-github-policy-service[bot] avatar](https://avatars.githubusercontent.com/in/95686?v=4 "microsoft-github-policy-service[bot]")


