microsoft / powerbi-visuals-radarchart Goto Github PK
View Code? Open in Web Editor NEWRepo for Power BI Radar Chart custom visual
License: Other
Repo for Power BI Radar Chart custom visual
License: Other


When using a slicer (I've tried multiple slicers to confirm), there are certain slicer values that do not update the radar chart. My guess is that it has to do with the blanks in my dataset because I don't get this issue if I fill in the blanks. Would it be possible to look into this issue please?
I've created a sample Power BI dashboard for you to see the issue in action:
https://app.powerbi.com/view?r=eyJrIjoiOWVjYWI0OGEtOTYxYi00NjAwLTkyZjItNDY4ODQ4YWM2NjIyIiwidCI6ImUxNTY0OGY4LWZiMTMtNDIyNy1hMjk5LTBlY2E2MWJjOGYxYyJ9
I have also attached my test dataset for reference.
Radar Chart Test Data.xlsx
Test Case #1: Selecting the "C", "E" or "I" values of the slicer does nothing to the radar chart.
Test Case #2: Selecting the "D" value of the slicer and then selecting the "E" value of the slicer does not update the radar chart. Instead the same chart for D is visible but on a different set of axes.
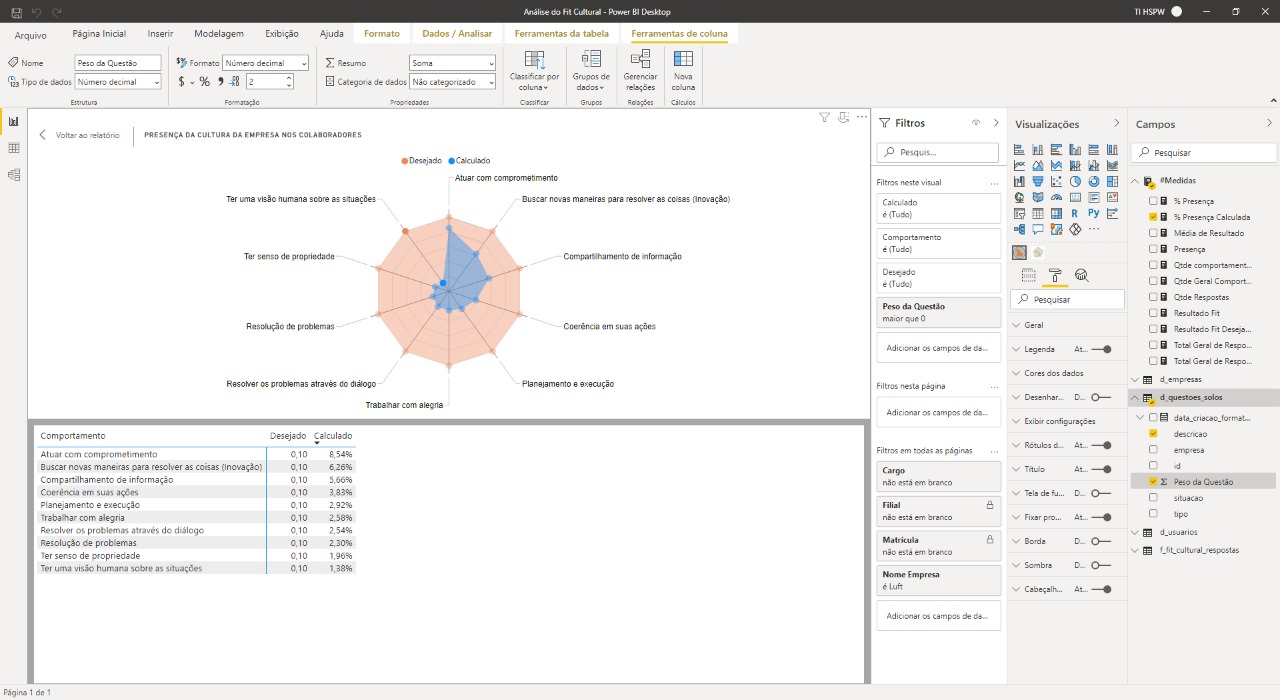
I created a radar chart using the below data table, manually entered. I've noticed, repeatedly, that whatever category has the lowest score (in this case, humor, a value of 10), that category is not visually displayed correctly - it will be shown at the center of the visual, rather than on one of the "web" edges.
Included a screenshot and data table for copy/paste reproducibility:
Data Table
category score
humor 10
charisma 15
insight 17
empathy 13
Screenshot

The current repo is very old and cannot be run with the latest power bi api version. Also it lacks support for drill-down.
Are there any plans for those two?
Hi,
Can we sort the order of the axis display ? It seems today they are sorted by Y-axis, desc, and I'l like to have a fix display order on a based on another colum.
Thanks
With a Measure in % format, the scale maximum seems locked to 100%. When all the values are less than 30%, this results in a chart that is mostly whitespace. A better max detection auto setting would help (ref standard column chart), plus a property to set an arbitrary max.
Add Scale Type to the Axis option. This option is similar to what we have in Column Chart.

Where can I set the scale of data label? User wants to know the exact value
I just downloaded the repository and ran "pbiviz start" from PowerShell and got the attached output. Any help would be greatly appreciated.
Hi there,
When formatting both Y Values to Percent it shrink to the middle:

When formatting one of the values to decimal, it shows more correctly:
It seems that there is some fixed value in relation to the opening of the graph web ...
Or is there a way around this situation that I have demonstrated?
Plot values/ Labels should be good, and the possibility to customize dynamic axes scale
There are important files that Microsoft projects should all have that are not present in this repository. A pull request has been opened to add the missing file(s). When the pr is merged this issue will be closed automatically.
Microsoft teams can learn more about this effort and share feedback within the open source guidance available internally.
Radar is super helpful, thanks for developing! I have a use case where I'd like to be able to hover on the radar items and activate tooltips (as in this https://learn.microsoft.com/en-us/power-bi/create-reports/desktop-custom-tooltips?tabs=powerbi-desktop) however this doesn't seem to be active on this visual?
On macOS High Sierra with Google Chrome 62.0 if I click on Edit report and then keep clicking on the Reload Visual Code button the memory usage keeps growing without ever going back.
A declarative, efficient, and flexible JavaScript library for building user interfaces.
🖖 Vue.js is a progressive, incrementally-adoptable JavaScript framework for building UI on the web.
TypeScript is a superset of JavaScript that compiles to clean JavaScript output.
An Open Source Machine Learning Framework for Everyone
The Web framework for perfectionists with deadlines.
A PHP framework for web artisans
Bring data to life with SVG, Canvas and HTML. 📊📈🎉
JavaScript (JS) is a lightweight interpreted programming language with first-class functions.
Some thing interesting about web. New door for the world.
A server is a program made to process requests and deliver data to clients.
Machine learning is a way of modeling and interpreting data that allows a piece of software to respond intelligently.
Some thing interesting about visualization, use data art
Some thing interesting about game, make everyone happy.
We are working to build community through open source technology. NB: members must have two-factor auth.
Open source projects and samples from Microsoft.
Google ❤️ Open Source for everyone.
Alibaba Open Source for everyone
Data-Driven Documents codes.
China tencent open source team.