Giter Club home page Giter Club logo

charticulator-extensions's Introduction

Charticulator Extensions

This repository contains a collection of charticulator extensions.
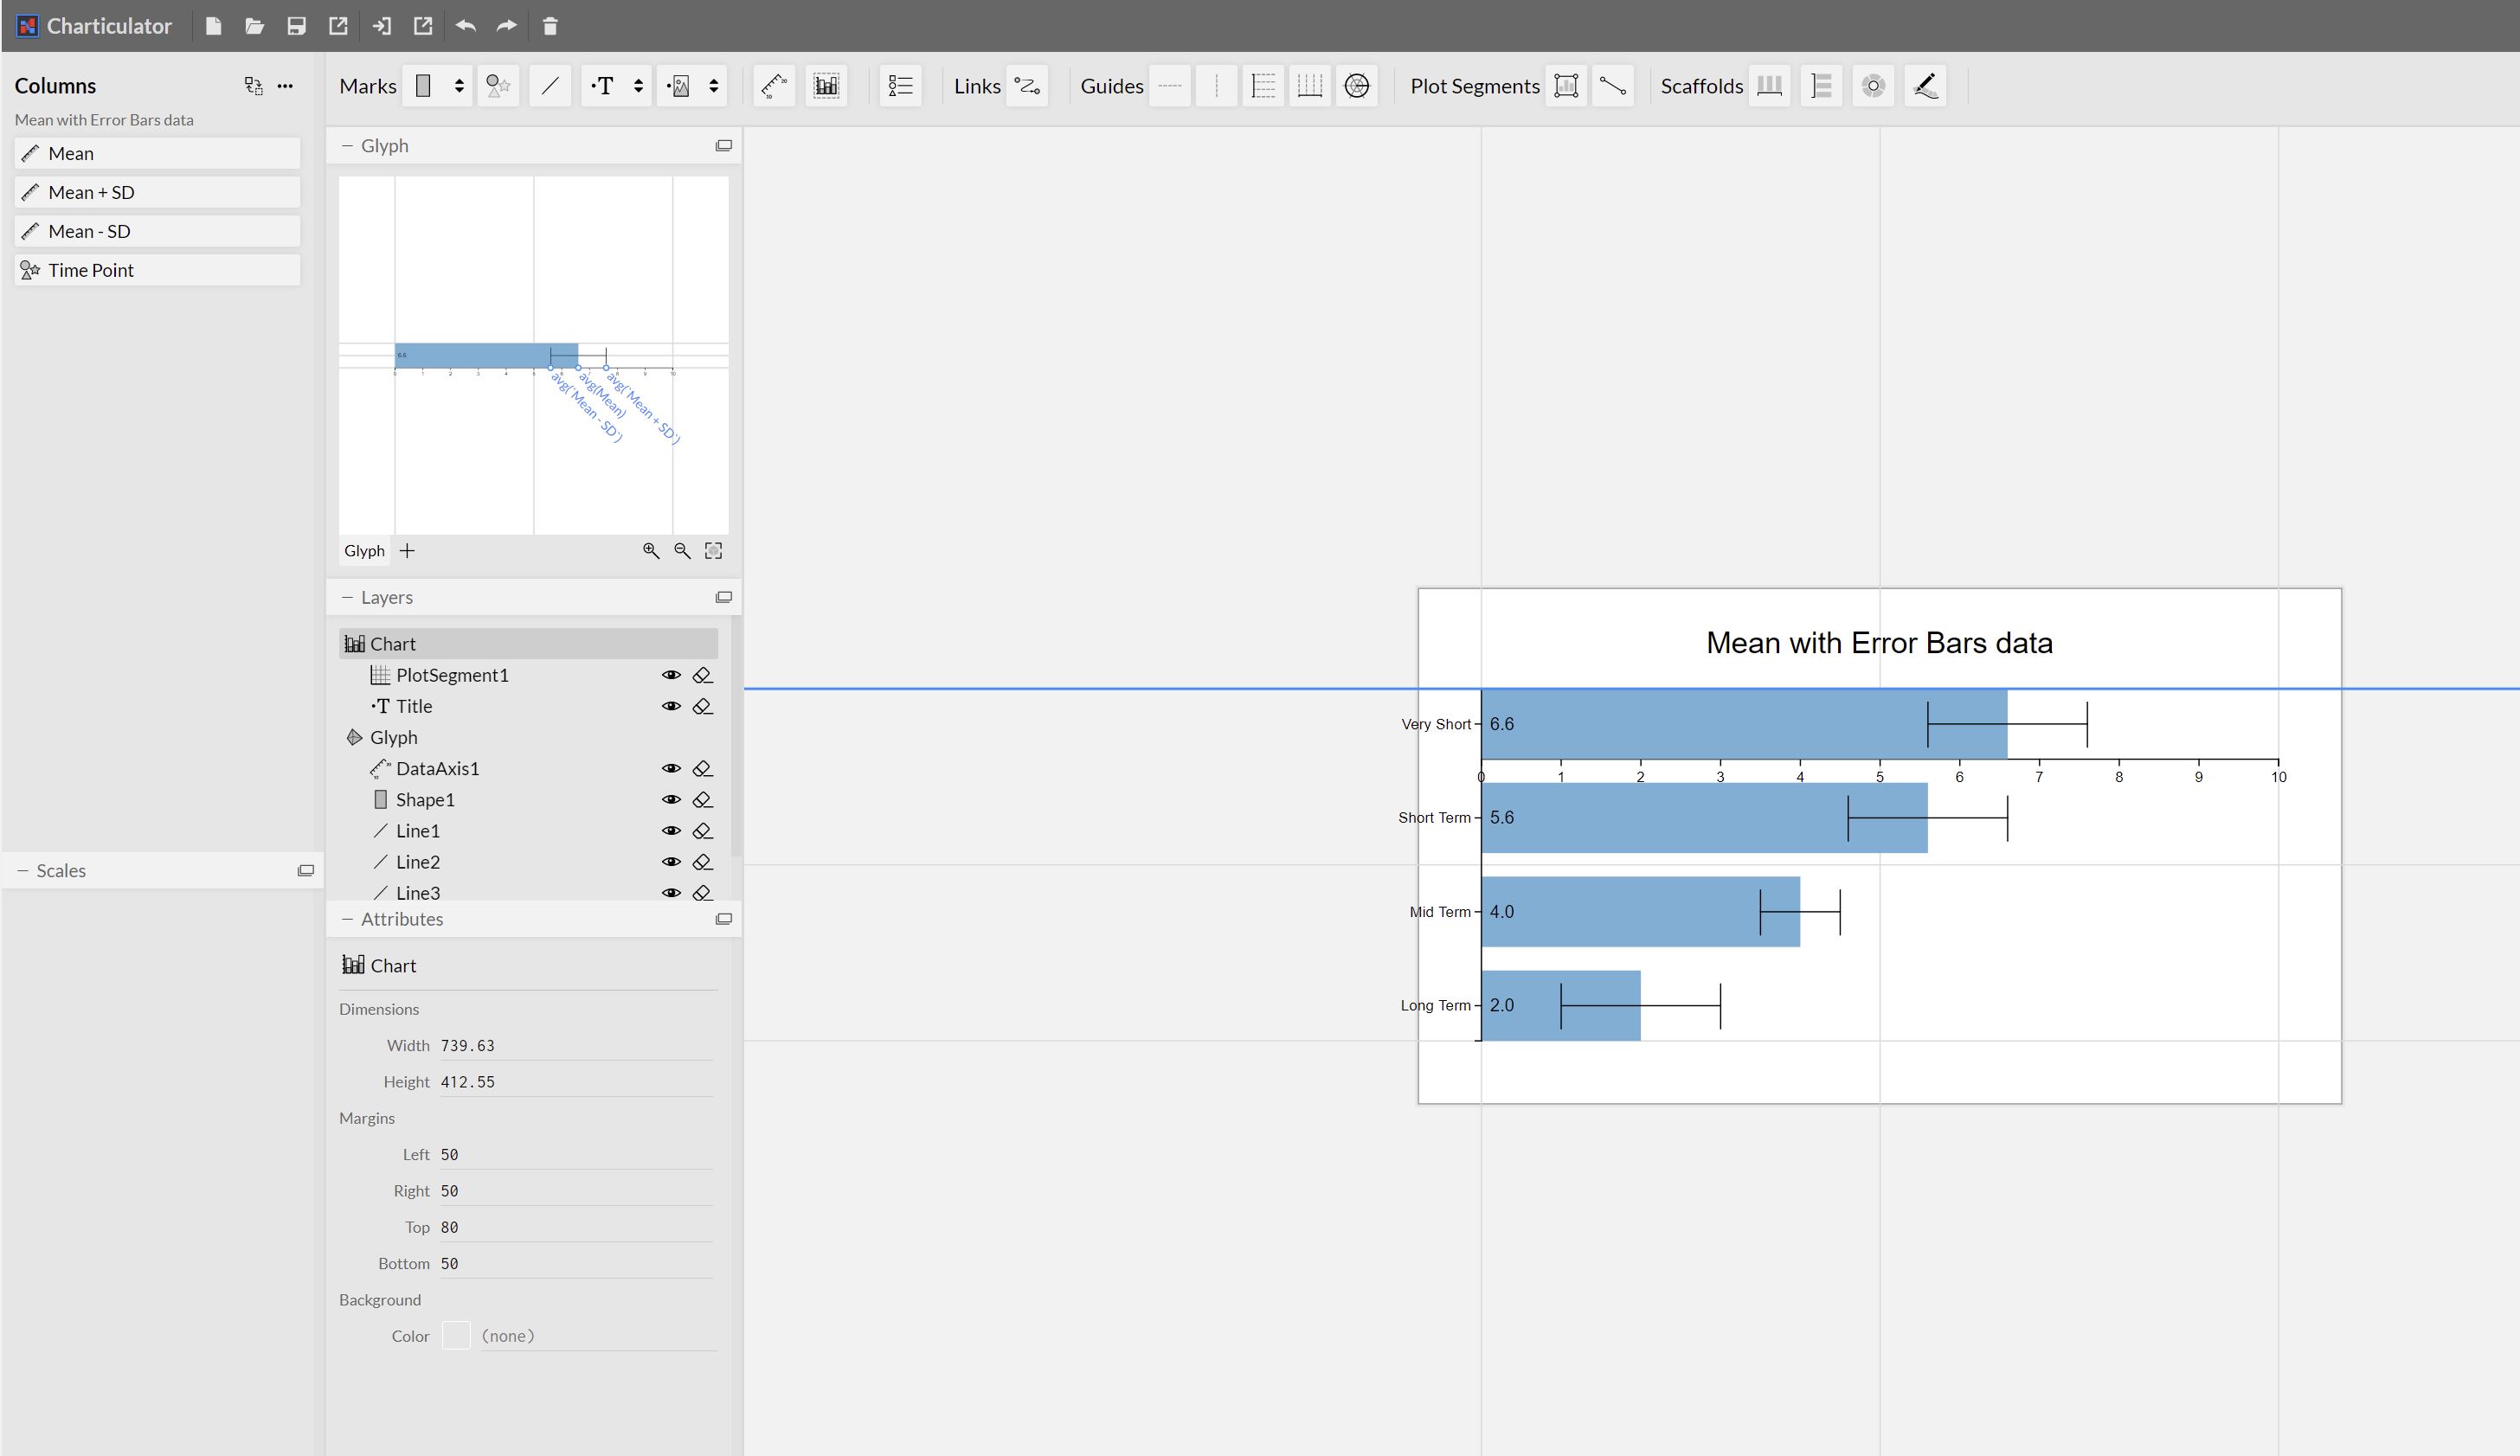
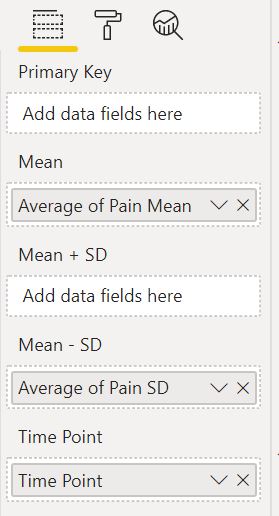
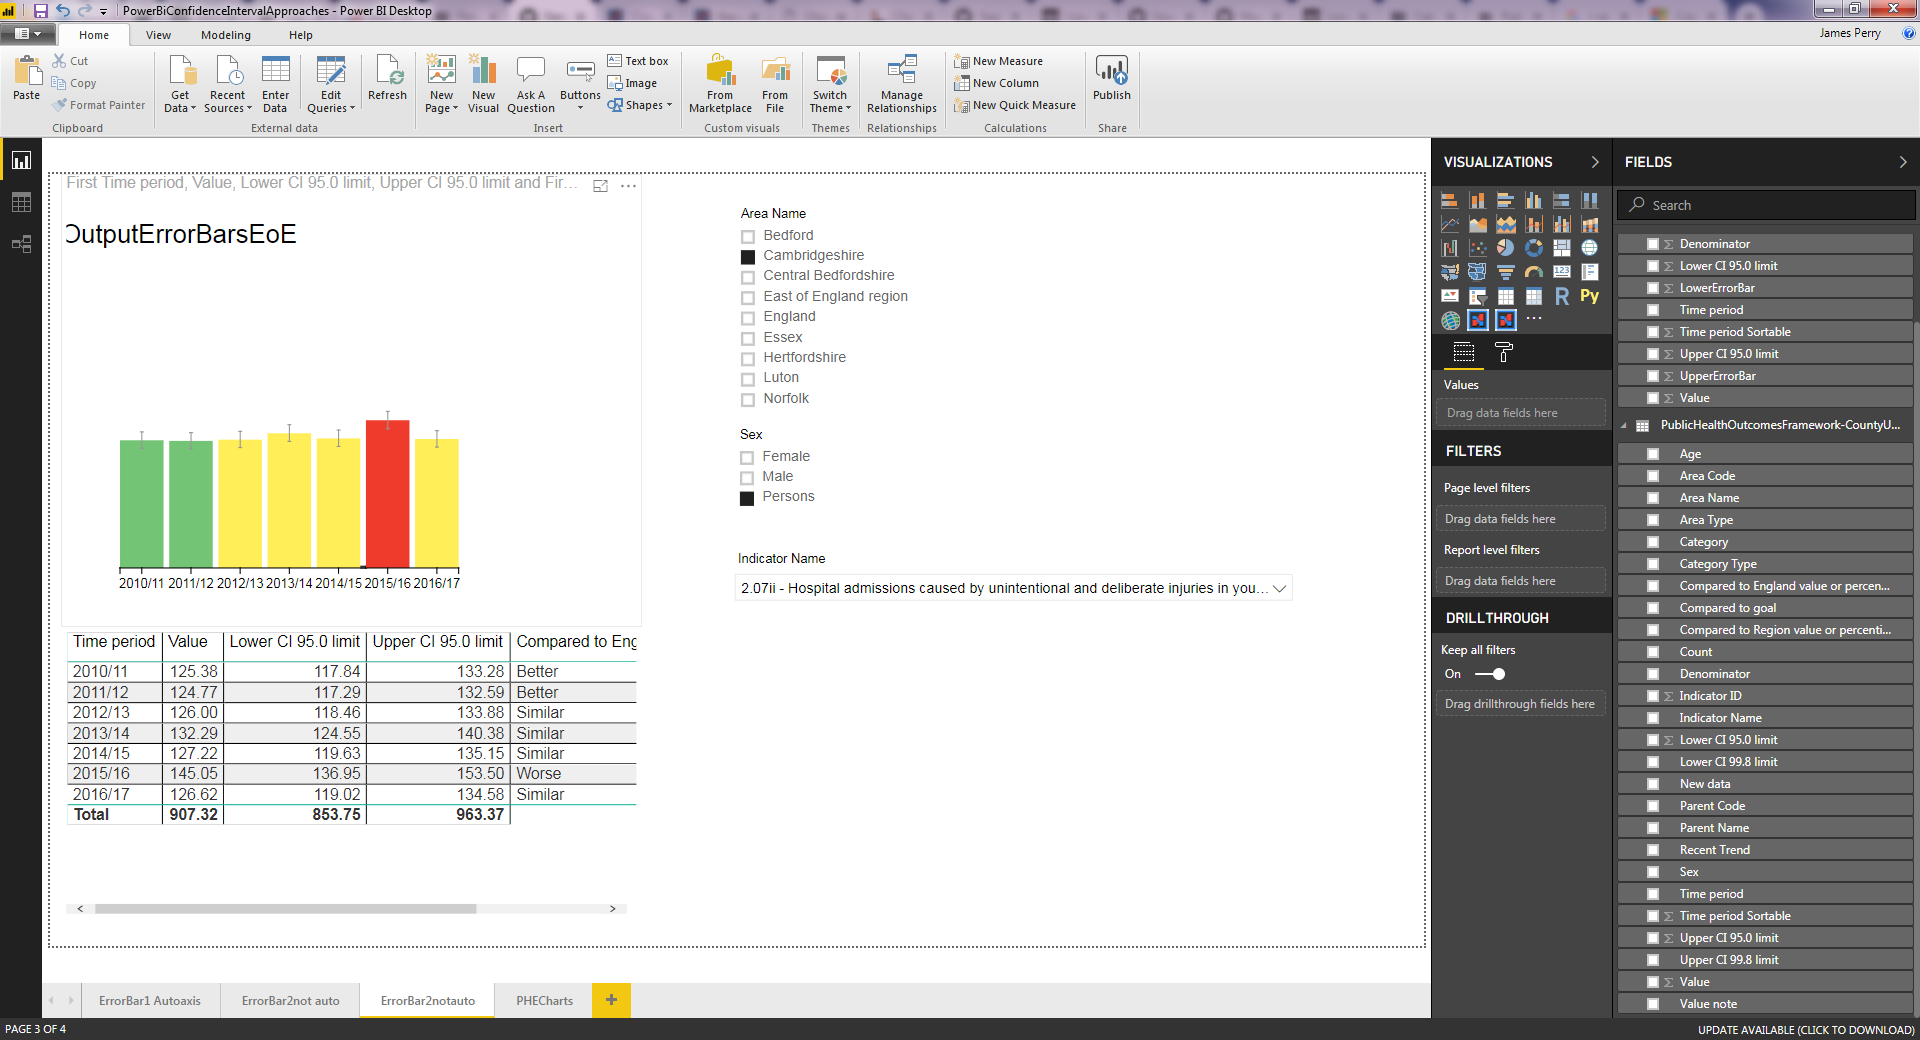
Contributing

This project welcomes contributions and suggestions. Most contributions require you to agree to a Contributor License Agreement (CLA) declaring that you have the right to, and actually do, grant us the rights to use your contribution. For details, visit https://cla.microsoft.com.

When you submit a pull request, a CLA-bot will automatically determine whether you need to provide a CLA and decorate the PR appropriately (e.g., label, comment). Simply follow the instructions provided by the bot. You will only need to do this once across all repos using our CLA.

This project has adopted the Microsoft Open Source Code of Conduct. For more information see the Code of Conduct FAQ or contact [email protected] with any additional questions or comments.

charticulator-extensions's People

Contributors

danmarshall avatar dependabot[bot] avatar donghaoren avatar microsoft-github-policy-service[bot] avatar microsoftopensource avatar msftgits avatar stopyoukid avatar

Stargazers

 avatar  avatar  avatar  avatar  avatar  avatar  avatar  avatar  avatar  avatar  avatar

Watchers

 avatar  avatar  avatar  avatar  avatar  avatar  avatar  avatar  avatar  avatar  avatar  avatar  avatar  avatar  avatar  avatar  avatar

charticulator-extensions's Issues

Charticulator pbviz not accepting a field

I'm trying to make a Dynamite plot - mean values with whiskers for mean values +/- Standard deviations, - I followed the tutorial here: https://charticulator.com/tutorials/tutorial9.html (Bar Chart with Error bars) but there's a strange glitch.
I am unable to place any value in the "Mean + SD" field well.
The available field wells are mean, Mean - SD, Mean +SD (along with Primary Key)
At first I thought this was because I was using measures (which calculate weighted means for these values), but I've also tried this using columns from the source table, and the same problem exists.
I have tried horizontal as well as vertical bars, and double checked each step from the tutorial, all to no avail.

Here's the .pbviz file: https://1drv.ms/u/s!AgytcDfT4DRFj_kGVfnpM5J89BjqLQ?e=aceqsK and here's a screen capture from both the final Charticulator output, and the available field wells:
Capture01
Capture
Thanks in advance for any help,
Rod

Tooltips in PowerBi

Is it possible to add tooltips to the custom visual outputs? I've got a custom visual working quite well (although having issues with the axis labels) but the addition of tooltips would be great.
image

Line marks getting distorted on export to PowerBI

It should look like this:

image

It looks like this in PowerBI:
image

Here is the PBIX, rename from .zip to .pbiviz
charticulator (76).zip

This seems to work fine if I draw the line mark DIRECTLY on the data axis between the min/max values, and it snaps vertically to the data axis. Which leads me to believe that the line that I drew in this issue was slightly diagonal, and the powerbi rendering is just blowing that out of proportion (but it looks fine in charticulator)

Recommend Projects

  • React photo React

    A declarative, efficient, and flexible JavaScript library for building user interfaces.

  • Vue.js photo Vue.js

    ๐Ÿ–– Vue.js is a progressive, incrementally-adoptable JavaScript framework for building UI on the web.

  • Typescript photo Typescript

    TypeScript is a superset of JavaScript that compiles to clean JavaScript output.

  • TensorFlow photo TensorFlow

    An Open Source Machine Learning Framework for Everyone

  • Django photo Django

    The Web framework for perfectionists with deadlines.

  • D3 photo D3

    Bring data to life with SVG, Canvas and HTML. ๐Ÿ“Š๐Ÿ“ˆ๐ŸŽ‰

Recommend Topics

  • javascript

    JavaScript (JS) is a lightweight interpreted programming language with first-class functions.

  • web

    Some thing interesting about web. New door for the world.

  • server

    A server is a program made to process requests and deliver data to clients.

  • Machine learning

    Machine learning is a way of modeling and interpreting data that allows a piece of software to respond intelligently.

  • Game

    Some thing interesting about game, make everyone happy.

Recommend Org

  • Facebook photo Facebook

    We are working to build community through open source technology. NB: members must have two-factor auth.

  • Microsoft photo Microsoft

    Open source projects and samples from Microsoft.

  • Google photo Google

    Google โค๏ธ Open Source for everyone.

  • D3 photo D3

    Data-Driven Documents codes.