MSAGL is a .NET library and tool for graph layout and viewing.
MSAGL was developed in Microsoft by Lev Nachmanson, Sergey Pupyrev, Tim Dwyer, Ted Hart, and Roman Prutkin.
The simplest way to start with MSAGL in C# is to open GraphLayout.sln in Visual Studio and browse the Samples folder.
Note: This repository requires Visual Studio with the UWP (Universal Windows Platform) development workload installed, as well as the Windows 10 SDK. If these are not installed, Visual Studio will recommend installing them when you open the solution. Please ensure these components are installed to successfully build the project.
The Core Layout engine (AutomaticGraphLayout.dll) - NuGet package This .NET asssembly contains the core layout functionality. Use this library if you just want MSAGL to perform the layout only and afterwards you will use a separate tool to perform the rendering and visalization.
The Drawing module (AutomaticGraphLayout.Drawing.dll) - NuGet package The Definitions of different drawing attributes like colors, line styles, etc. It also contains definitions of a node class, an edge class, and a graph class. By using these classes a user can create a graph object and use it later for layout, and rendering.
A WPF control (Microsoft.Msagl.WpfGraphControl.dll) - NuGet package The viewer control lets you visualize graphs and has and some other rendering functionality. Key features: (1) Pan and Zoom (2) Navigate Forward and Backward (3) tooltips and highlighting on graph entities (4) Search for and focus on graph entities.
A Windows Forms Viewer control (Microsoft.Msagl.GraphViewerGdi.dll) - NuGet package The viewer control lets you visualize graphs and has and some other rendering functionality. Key features: (1) Pan and Zoom (2) Navigate Forward and Backward (3) tooltips and highlighting on graph entities (4) Search for and focus on graph entities.
The code snippets demonstrate the basic usage of the viewer. It uses the C# language.
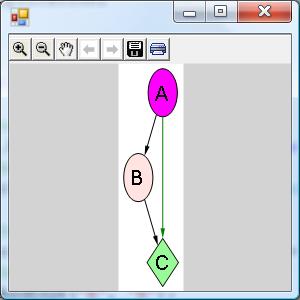
Drawing of the graph from the sampleDrawing of the graph from the sample
using System;
using System.Collections.Generic;
using System.Windows.Forms;
class ViewerSample {
    public static void Main() {
    //create a form
        System.Windows.Forms.Form form = new System.Windows.Forms.Form();
    //create a viewer object
        Microsoft.Msagl.GraphViewerGdi.GViewer viewer = new Microsoft.Msagl.GraphViewerGdi.GViewer();
    //create a graph object
        Microsoft.Msagl.Drawing.Graph graph = new Microsoft.Msagl.Drawing.Graph("graph");
    //create the graph content
        graph.AddEdge("A", "B");
        graph.AddEdge("B", "C");
        graph.AddEdge("A", "C").Attr.Color = Microsoft.Msagl.Drawing.Color.Green;
        graph.FindNode("A").Attr.FillColor = Microsoft.Msagl.Drawing.Color.Magenta;
        graph.FindNode("B").Attr.FillColor = Microsoft.Msagl.Drawing.Color.MistyRose;
        Microsoft.Msagl.Drawing.Node c = graph.FindNode("C");
        c.Attr.FillColor = Microsoft.Msagl.Drawing.Color.PaleGreen;
        c.Attr.Shape = Microsoft.Msagl.Drawing.Shape.Diamond;
    //bind the graph to the viewer
        viewer.Graph = graph;
    //associate the viewer with the form
        form.SuspendLayout();
        viewer.Dock = System.Windows.Forms.DockStyle.Fill;
        form.Controls.Add(viewer);
        form.ResumeLayout();
    //show the form
        form.ShowDialog();
    }
}
More code samples can be found here…
GraphMaps lets you view very large graphs like oneline maps - as you zoom in more detail is revealed. Watch a video that shows how GraphMaps works, and here is the video of the previous version.
- open GraphLayout.sln and build the solution,
- run TestGraphMaps.
NOTES:
- The configuration Release/x64 needs to be used to load a large graph.
- The graph from the video can be found in GraphLayout/graphs/composers.zip. Please load composers.msagl to avoid the preprocessing step.
- If composers.dot is loaded then composers.msagl and the tiles directory composers.msagl_tiles will be regenerated.
The ideas, design, and the mathematics of GraphMaps are described in this paper.


WebMSAGL is a version of MSAGL that was transcompiled to JavaScript with SharpKit, plus a TypeScript wrapper and rendering/interaction layer that provides a friendly TypeScript API. You can create a graph either programmatically or from a JSON object, have MSAGL create a layout for it, and then render it to an HTML Canvas or to an SVG block. All layout operations are run in a web worker, ensuring that your application remains responsive while computation is taking place. Limited interactivity is also supported.
- open WebMsagl.sln and build the solution,
- set index.html from any of the sample folders as the starting page,
- run WebMsagl.
This project has adopted the Microsoft Open Source Code of Conduct. For more information see the Code of Conduct FAQ or contact [email protected] with any additional questions or comments.
A release containing the binaries of agl.exe can be created automatically by a github action of ".github\workflows\agl.yaml'. To invoke the action do the following. Create a new tag in the form "v*". For example, "git tag -a v_11 -m "some comment here"". Then execute git push with this tag: "git push origin v_11". These should trigger the release creation. Alternatively, you can use python script "createRelease.py", as following "python createRelease.py 1.1.1".


![dependabot[bot] avatar](https://avatars.githubusercontent.com/in/29110?v=4 "dependabot[bot]")


![microsoft-github-policy-service[bot] avatar](https://avatars.githubusercontent.com/in/95686?v=4 "microsoft-github-policy-service[bot]")