


okama is a library with investment portfolio analyzing & optimization tools. CFA recommendations are used in quantitative finance.
okama goes with free «end of day» historical stock markets data and macroeconomic indicators through API.
...entities should not be multiplied without necessity
-- William of Ockham (c. 1287–1347)
- Okama main features
- Financial data and macroeconomic indicators
- Installation
- Getting started
- Documentation
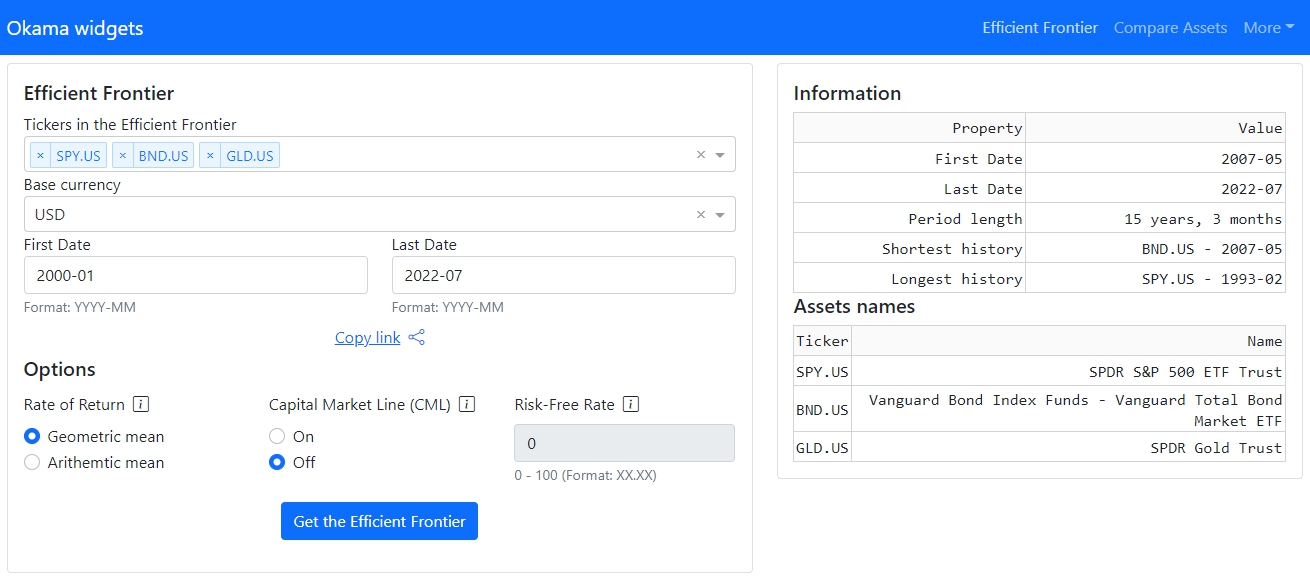
- Financial Widgets
- RoadMap
- Contributing to okama
- Communication
- Investment portfolio constrained Markowitz Mean-Variance Analysis (MVA) and optimization
- Rebalanced portfolio optimization with constraints (multi-period Efficient Frontier)
- Investment portfolios with contributions / withdrawals cash flows (DCF)
- Monte Carlo Simulations for financial assets and investment portfolios
- Popular risk metrics: VAR, CVaR, semi-deviation, variance and drawdowns
- Different financial ratios: CAPE10, Sharpe ratio, Sortino ratio, Diversification ratio
- Forecasting models according to normal, lognormal and other popular distributions
- Testing distribution on historical data
- Dividend yield and other dividend indicators for stocks
- Backtesting and comparing historical performance of broad range of assets and indexes in multiple currencies
- Methods to track the performance of index funds (ETF) and compare them with benchmarks
- Main macroeconomic indicators: inflation, central banks rates
- Matplotlib visualization scripts for the Efficient Frontier, Transition map and assets risk / return performance
- Stocks and ETF for main world markets
- Mutual funds
- Commodities
- Stock indexes
- FX currencies
- Crypto currencies
- Central bank exchange rates
For many countries (China, USA, United Kingdom, European Union, Russia, Israel etc.):
- Inflation
- Central bank rates
- CAPE10 (Shiller P/E) Cyclically adjusted price-to-earnings ratios
- Real estate prices
- Top bank rates
pip install okama
The latest development version can be installed directly from GitHub:
git clone https://github.com/mbk-dev/okama@dev
poetry install
import okama as ok

x = ok.AssetList(['SPY.US', 'BND.US', 'DBXD.XFRA'], ccy='USD')
x  # all examples are for Jupyter Notebook/iPython. For raw Python interpreter use 'print(x)' instead.
Get the main parameters for the set:
x.describe()
Get the assets accumulated return, plot it and compare with the USD inflation:
x.wealth_indexes.plot()
weights = [0.3, 0.2, 0.2, 0.2, 0.1]
assets = ['T.US', 'XOM.US', 'FRE.XFRA', 'SNW.XFRA', 'LKOH.MOEX']
pf = ok.Portfolio(assets, weights=weights, ccy='EUR')
pf.table
Plot the dividend yield of the portfolio (adjusted to the base currency).
pf.dividend_yield.plot()
ls = ['SPY.US', 'GLD.US']
curr = 'USD'
last_date='2020-10'
# Rebalancing periods is one year (default value)
frontier = ok.EfficientFrontierReb(ls, last_date=last_date, ccy=curr, rebalancing_period='year')
frontier.names
Get the Efficient Frontier points for rebalanced portfolios and plot the chart with the assets risk/CAGR points:
import matplotlib.pyplot as plt

points = frontier.ef_points

fig = plt.figure(figsize=(12,6))
fig.subplots_adjust(bottom=0.2, top=1.5)
frontier.plot_assets(kind='cagr')  # plots the assets points on the chart
ax = plt.gca()
ax.plot(points.Risk, points.CAGR) 
* - rebalancing period is one year.
ls = ['SPY.US', 'GLD.US', 'BND.US']
map = ok.EfficientFrontier(ls, ccy='USD').plot_transition_map(x_axe='risk')
More examples are available in form of Jupyter Notebooks.
The official documentation is hosted on readthedocs.org: https://okama.readthedocs.io/
okama-dash repository has interactive financial widgets (multi-page web application) build with okama package and Dash (plotly) framework. Working example is available at okama.io.
The plan for okama is to add more functions that will be useful to investors and asset managers.
- Add Omega ratio to EfficientFrontier, EfficientFrontierReb and Portfolio classes.
- Make complex withdrawals / contributions strategies in Portfolio class.
- Make complex portfolio rebalancing strategies.
- Add Black-Litterman asset allocation
- Accelerate optimization for multi-period Efficient Frontier: minimize_risk and maximize_risk methods of EfficientFrontierReb class.
- Make a single EfficientFrontier class for all optimizations: single-period or multu-period with rebalancing period as a parameter.
- Add different utility functions for optimizers: IRR, portfolio survival period, semi-deviation, VaR, CVaR, drawdowns etc.
- Add more functions based on suggestion of users.
Contributions are most welcome. Have a look at the Contribution Guide for more.
Feel free to ask questions on Discussuions.
As contributors and maintainers to this project, you are expected to abide by okama' code of conduct. More information can be found at: Contributor Code of Conduct
For basic usage questions (e.g., "Is XXX currency supported by okama?") and for sharing ideas please use GitHub Discussions. Russian language community is available at okama.io forums.
MIT