##HIV-30 Zoom Visualization
[project] 30 years of HIV sentiment analysis visualization with Chambua
###Overview Internews-Kenya's retrospective on HIV in East African media considered equally the news content as well as the language associated with that coverage. While our approach to this project studied the general tag trends as seen in the "Words Through Time" section, we also considered the proper-noun taxonomy associated with 30 years of media coverage on HIV. The motivation for this approach was to track the conversation according to the associated persons, locations (international and domestic), and organizations-of-interest who were associated with the conversation around HIV as it grew over time.
To do this, Internews pulled and processed articles from the Daily Nation, a Kenyan publication with 30 years of reporting history on the development of the AIDS virus in East Africa. We then extracted people, places, and organizations mentioned therein, and clustered these in a visualization. Read below for descriptions of our methodology and data visualization decisions.
###Methodology Analyzing the articles involved a multi-step process roughly divided into data collection, data processing, and data visualization workflows.
####Data Collection Journalists at Internews Kenya tirelessly scoured the Daily Nation archives online and off to scan, caption, process in Overview and export articles about HIV and AIDS over the course of several weeks. They then exported these files with default names as .docx files and passed them to developers on the team to handle the post-processing.
In tandem, the team developers brainstormed ways to visualize the vocabulary from these articles.
####Data Processing Data processing to extract proper-noun entities was designed to used Chambua, an Ushahidi open-source project that curls text files to extract people, place, and organization terms and output a json object with these entities.
The project works cleanly for one file, we needed it to work for a batch of files, organized by year. To use Chambua in this way, we converted the files from .docx to .txt, wrapped them in a text object using wrap_json.py, and wrote Python scripts to run chambua over each article in a directory (named by year) and output a comparable people, place, and organization object on a per-article basis using send_json.py.
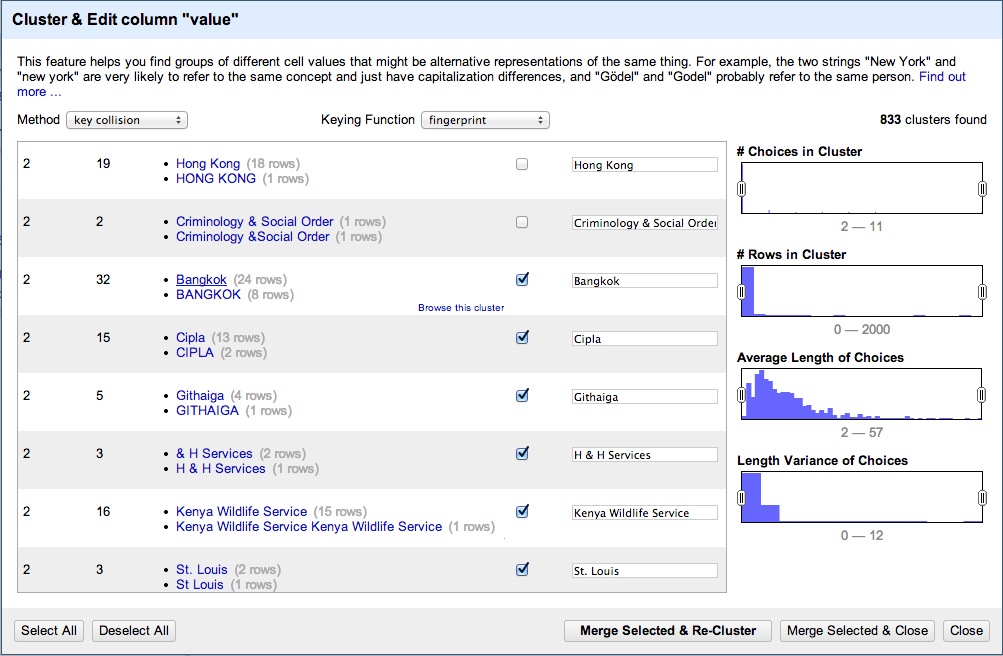
Once the terms were extracted, they needed to be cleaned and reformated to suit a flare structure for a D3 visualization. For this, we developed a node process to run through the chambua articles in each year's directory, combine them all into one csv file and then clean the terms in Open Refine. Refine's macros were useful in eliminating unicode errors, miss- or similar- spellings and invalid terms. We then output the clean csv and processed it to map to a json file with a D3-appropriate structure.
The documentation for our cleaning process can be found in the following resoures:
- Processing Notes - File Cleaning
- Processing Notes - Chambua
- Additional Notes - General Iterations
- Python Scripts
- Node Scripts
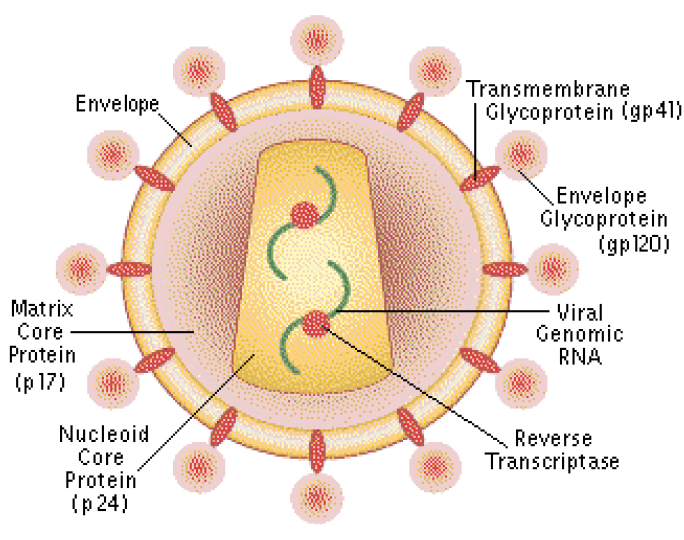
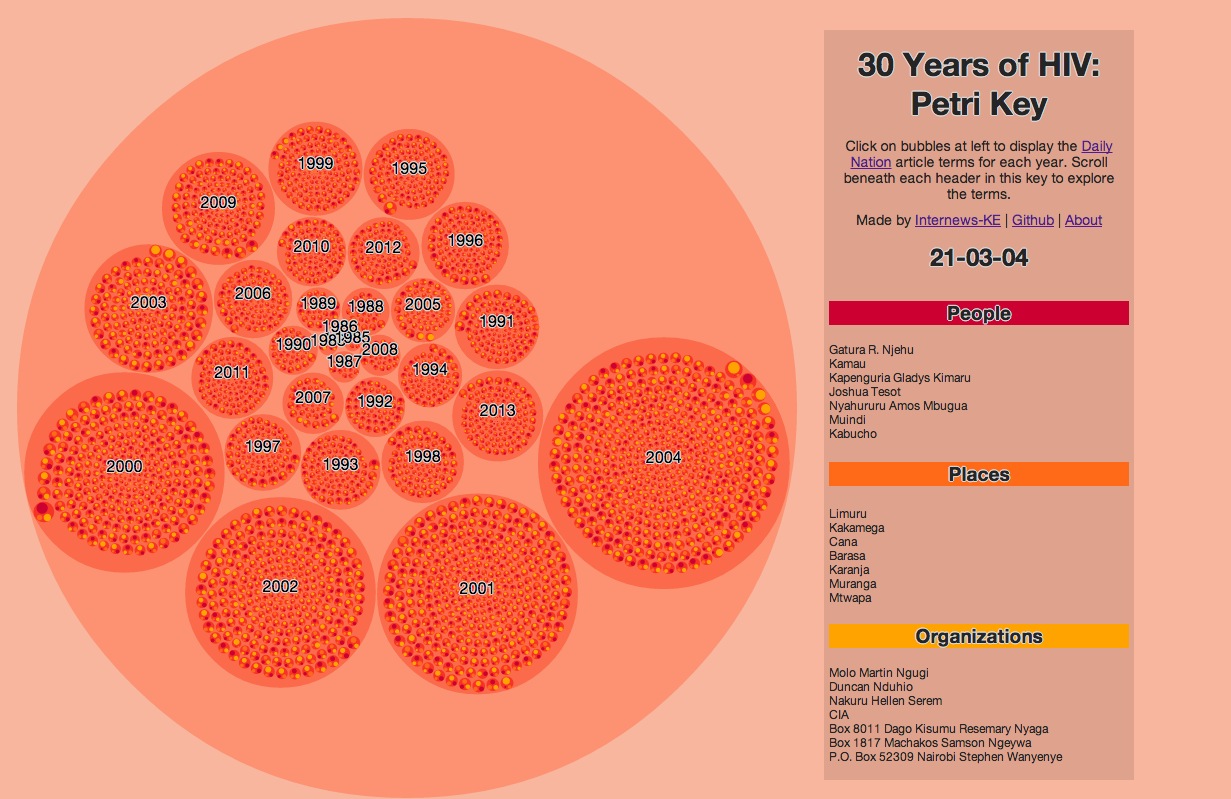
####Data Visualization Data visualization of these terms was originally designed as a force-directed node-edge map, where the shape and color of the visualization was meant to represent microscopic photographs of the HIV-Virus, and the external notes would represent glycoproteins on the periphery of each virus. From a user-experience perspective however, this was tough to explore and unintuitive, so we pivoted to representing the people, places, and institutions as ameobic sub-clusters in a larger 'petri dish' per year.
The result was the following small multiples representation, available live here, where red: people, orange: places, and yellow: institutions and the size of each blog is determined by the number of terms within it.
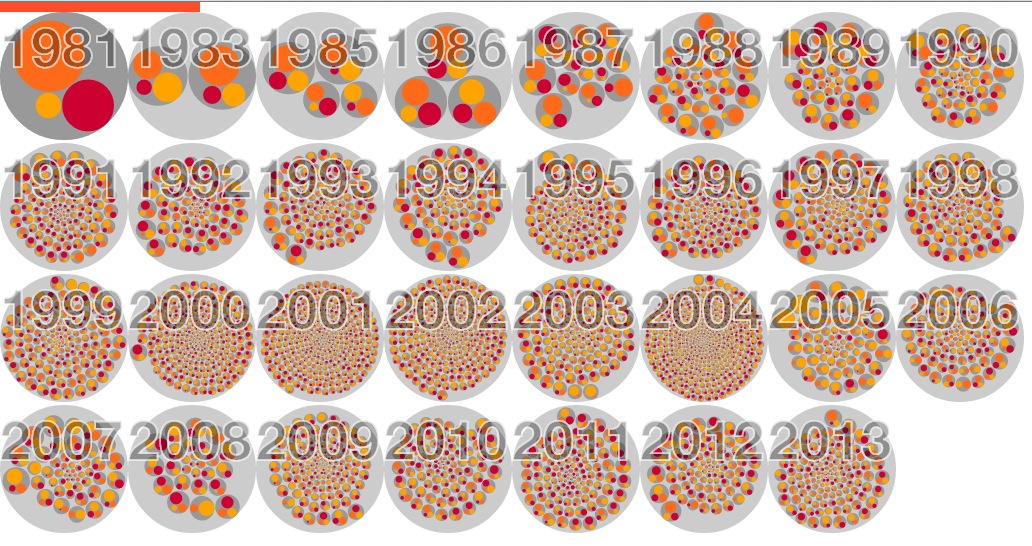
From this, you can see the general increase in article volume, the explosion of articles in 2004, the paucity of articles and early coverage for the as-yet nameless epidemic in the 1980s. To be clear, this illustrates proper noun mentions (so proper names, places identifiable as cities, locations, on a map, and organizations with a recognized authority or presence in the media). It should not be confused with a representation of HIV research depth; it only illustrates media coverage on HIV.
Media coverage remains interesting from sociocultural and geo-political perspectives. Whether or not the nation was mentioning foreign or domestic personalities, certain city-level locations or foreign research bodies, is significant to an understanding of how the converstion progressed in its 30 years of media treatment.
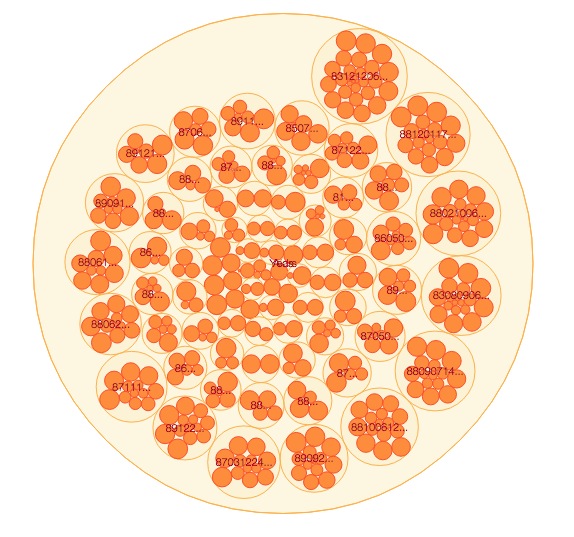
###Design Visualizing a zoomed-out view of the conversation density wasn't enough; we wanted to build a tool to discover terms and explore the articles based on these Chambua extractions. From the above cluster visualization, we build a larger dynamic 'petri dish' to explore all of the entities by date of article publication.
The zoomable visualization is available here.
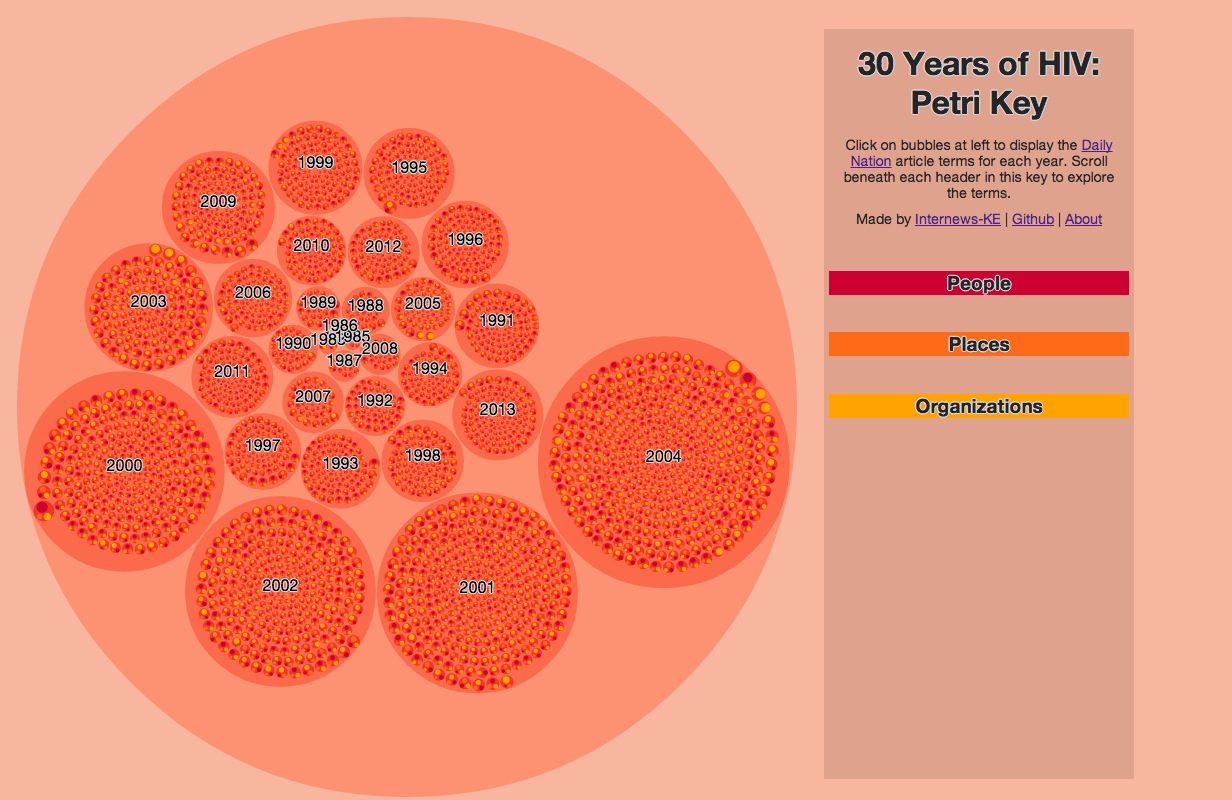
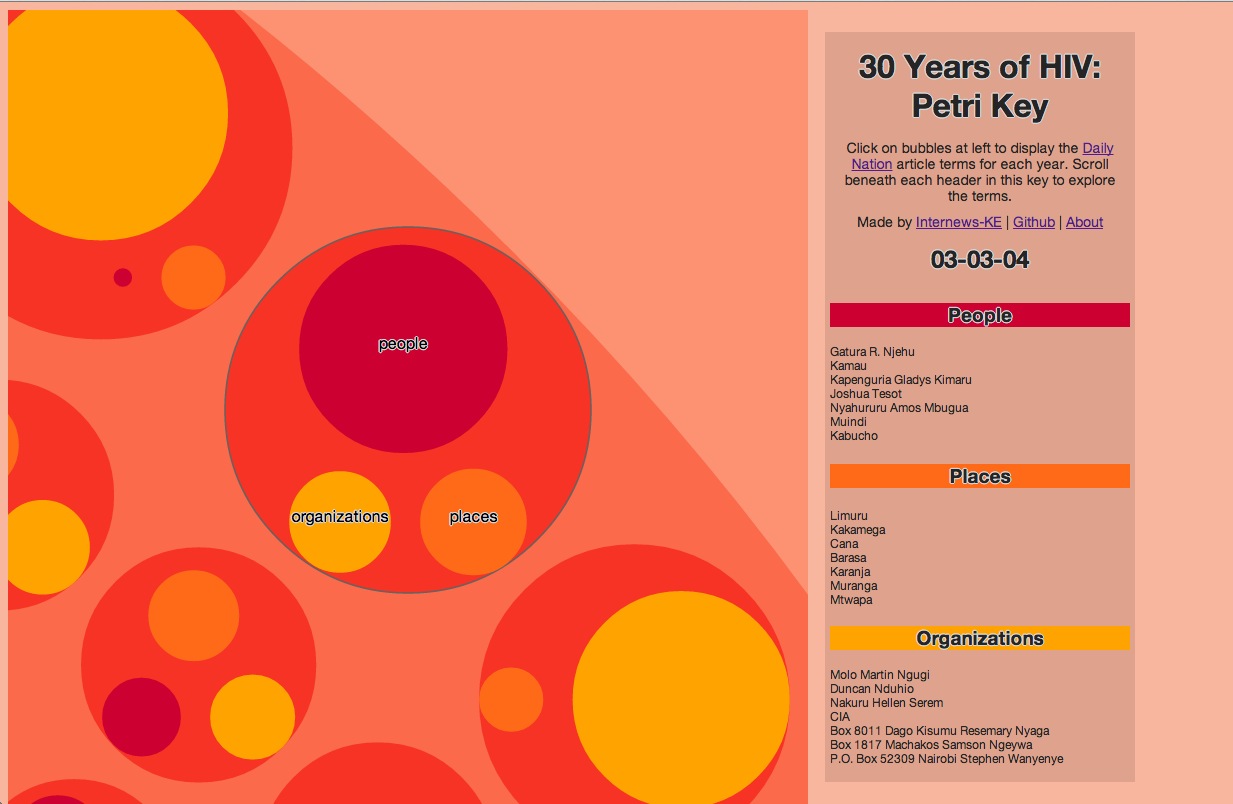
###How To View Click on any circle to zoom in or out. The 'petri dish' enables two layers of zoom, at the year-level, and at the article-level. Articles are organized by date, and the largest circles represent the years with the most articles. Each article contains a people, place, and organization cluster, and on click the article circle, the key at right populates with affiliated terms and the publication date. You can scroll beneath each header in the key to reveal terms if there are more than six.
###References For more on this project, please consult the links below:
- Source articles in a .txt format can be found in this github repository: HIV-Sentiment Analysis
- Information on the data cleaning scripts can be found in these python and node folders: Python pre-process | Node batch process
- A cluster visualization to view all petris separately
- A zoom visualization to view the terms in connection
- To learn more about zoomable circle packs in D3 see also this static circle packing example, for the template


