Travic CI Build Status:

Machine Learning engine generates predictions given any dataset using regression.
Tech: prediction-algorithm pandas-dataframes similarity-metric matplotlib root-mean-squared-error-metric multivariate-models scipy scikit-learn hyperparameter-optimization cross-validation aws-lambda linear-regression knn-regression logistic-regression unittest continous-integration binary-classification k-means-clustering correlation multi-classify-with-sklearn
- Applies Supervised Machine Learning techniques on past data using a regression process since we want to predict a specific optimum number value for a chosen Target feature (column) of a given dataset based on a list of chosen Training features by using a chosen Train/Test Validation Process and optionally performing K-Folds Cross Validation (splitting into different the Train/Test partitions), and with Hyperparameter k Optimisation (trying different quantity of nearest neighbors to find optimum) with Machine Learning Models using different Regressors including Logistic, Linear, and K-Nearest-Neighbors (KNN) algorithms provided by the Scikit-Learn library, which use Similarity Metrics such as the Euclidean Distance equation to perform comparisons, and evaluate the quality of the prediction accuracy using Error Metrics such as Median Average Error (MAE), Mean Squared Error (MSE), and Root Mean Squared Error (RMSE) equations, where RMSE penalises large errors more (caused by outliers).
When Logistic Regression is used we also calculate the Accuracy, Sensitivity, Specificity, and Area Under Curve (AUC) for predictions and plot ROC Curve prior to K-Folds Cross Validation (to help understand the generalisability and reduce overfitting of models by trying different values of K to get a better sense of how accurate we expect the model to perform on unseen data it was not trained on) and Hyperparameter Optimisation.
Unsupervised Machine Learning algorithms including K-Means Clustering is used in Example 5 to find patterns in the data and generates a new column in the main DataFrame that is ordered and continuous for subsequent use by Supervised Machine Learning Prediction Algorithms as the Target Column (which did not exist prior). Prior to using K-Means Clustering, an "affiliation_column" property must be added within the dataset key and assigned the column that is associated with each cluster.
Data cleansing is achieved using different approaches including plotting the Correlation between the Target features (column) and other features and removing columns with correlation below configured threshold.
Refer to Implementation Guide in prediction_config.py for details.
-
Install dependencies:
pip freeze > requirements.txt pip install -r requirements.txt -
Setup image rendering backend of matplotlib on macOS:
touch ~/.matplotlib/matplotlibrc; echo 'backend: TkAgg' >> ~/.matplotlib/matplotlibrc` -
Run Examples:
-
Instructions:
- Copy/paste below commands into Terminal and press Enter to run each example.
- Show all available CLI arguments with:
python3 main.py --help.
-
Run Example 1 via CLI.
- Warning:
--logisticflag is not set to prevent error since the Target Feature"price"is of continous type float
python main.py --data-set 1 \ --linear \ --knn "scikit" \ --training-features "accommodates" "bedrooms" "bathrooms" "number_of_reviews" \ --target-feature "price" \ --exclude-non-numeric "host_response_time" "host_response_rate" "host_acceptance_rate" \ "host_is_superhost" "host_listings_count" "host_verifications" \ "host_has_profile_pic" "host_identity_verified" "property_type" \ "room_type" "bed_type" "amenities" "calendar_updated" "has_availability" \ "requires_license" "license" "instant_bookable" "cancellation_policy" \ "require_guest_profile_picture" "require_guest_phone_verification" \ --exclude-non-ordinal "latitude" "longitude" "zipcode" \ --exclude-out-of-scope "id" "listing_url" "scrape_id" "last_scraped" "name" "summary" "space" \ "description" "experiences_offered" "neighborhood_overview" "notes" "transit" \ "thumbnail_url" "medium_url" "picture_url" "xl_picture_url" \ "host_id" "host_url" "host_name" "host_since" "host_location" \ "host_about" "host_thumbnail_url" \ "host_picture_url" "host_neighbourhood" "street" "neighbourhood" \ "neighbourhood_cleansed" "neighbourhood_group_cleansed" "city" \ "state" "market" "smart_location" "country_code" \ "country" "is_location_exact" "calendar_last_scraped" "first_review" \ "last_review" "jurisdiction_names" \ --cleanse-price-format-features "price" "weekly_price" "monthly_price" "security_deposit" \ "cleaning_fee" "extra_people" \ --affiliation-feature "" \ --kfold \ --kfold-qty 10 \ --hyper-optim \ --hyper-optim-range 20 - Warning:
-
Run Example 2 via CLI:
- Warning:
--logisticflag is not set to prevent error since the Target Feature"price"is of continous type float
python main.py --data-set 2 \ --linear \ --knn "scikit" \ --training-features "num-of-doors" "curb-weight" "horsepower" "city-mpg" "highway-mpg" \ --target-feature "price" \ --exclude-non-numeric "make" "fuel-type" "aspiration" "body-style" "drive-wheels" "engine-location" "engine-type" "fuel-system" \ --exclude-out-of-scope "symboling" "normalized-losses" \ --cleanse-price-format-features "price" \ --convert-feature-words-to-digits "num-of-doors" "num-of-cylinders" \ --affiliation-feature "" \ --kfold \ --kfold-qty 10 \ --hyper-optim \ --hyper-optim-range 20 - Warning:
-
Run Example 3 via CLI
-
Non-Logistic Regression
- Key Differences from Logistic Regression:
- "model_workflow_for_logistic_regression_algorithm_toggle": False
- Target column: mpg
- "multi_classification_input_columns": []
python main.py --data-set 3 \ --linear \ --knn "scikit" \ --training-features "cylinders" "displacement" "horsepower" "weight" "acceleration" "model-year" "car-name" \ --target-feature "mpg" \ --exclude-non-numeric "car-name" \ --affiliation-feature "" \ --kfold \ --kfold-qty 10 \ --hyper-optim \ --hyper-optim-range 20 - Key Differences from Logistic Regression:
-
Logistic Regression
- Warning:
- Beware of using too many Multi-Classification inputs and their corresponding Categories since it will create x new columns to replaces the existing Category columns, where x is the amount of categories of values in the existing Category columns, which may cause the prediction to take too long and the output Legend to be too big to fit into the plot (caused when too many Binary Classification Columns are generated from Categorical Columns)
- Key Differences from Non-Logistic Regression
- "model_workflow_for_logistic_regression_algorithm_toggle": True
- "k_fold_cross_validation_toggle": False
- Target column: origin
- "multi_classification_input_columns": ["cylinders", "model-year"]
python main.py --data-set 3 \ --logistic \ --linear \ --knn "scikit" \ --training-features "cylinders" "displacement" "horsepower" "weight" "acceleration" "model-year" "car-name" \ --target-feature "origin" \ --multi-class-features "cylinders" "model-year" \ --exclude-non-numeric "car-name" \ --affiliation-feature "" \ --hyper-optim \ --hyper-optim-range 20 - Warning:
-
-
Run Example 4 via CLI
-
Non-Logistic Regression
python main.py --data-set 4 \ --linear \ --knn "scikit" \ --training-features "gpa" "gre" \ --target-feature "admit" \ --affiliation-feature "" \ --kfold \ --kfold-qty 10 \ --hyper-optim \ --hyper-optim-range 20 -
Logistic Regression
python main.py --data-set 4 \
--logistic \
--linear \
--knn "scikit" \
--training-features "gpa" "gre" \
--target-feature "admit" \
--affiliation-feature "" \
--hyper-optim \
--hyper-optim-range 20
-
-
Run Example 5 via CLI
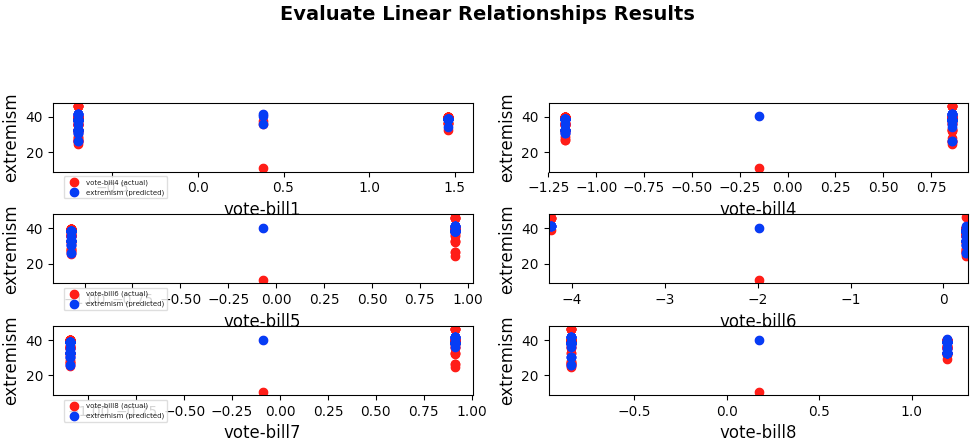
- Note: K-Means Clustering is used and generates a new "extremism" column in the main DataFrame that is subsequently used by the Prediction Algorithms as the Target Column (but does not exist prior). Prior to use of K-Means Clustering an "affiliation_column" property must be added within the dataset key and assigned with the column that is associated with each cluster.
python main.py --data-set 5 \ --linear \ --knn "scikit" \ --training-features "vote-bill1" "vote-bill4" "vote-bill5" "vote-bill6" "vote-bill7" "vote-bill8" \ --target-feature "extremism" \ --kmeans \ --kmeans-qty 2 \ --affiliation-feature "party" \ --kfold \ --kfold-qty 10 \ --hyper-optim \ --hyper-optim-range 20 -
Run Example 6 via CLI
- Note: Ability to override
remove_rangehas not been implemented yet in argparse (i.e. passing argument as dict of the format shown in input_event.py)
python main.py --data-set 6 \ --linear \ --knn "scikit" \ --training-features "yearpublished" "minplaytime" "minage" "total_wanters" "average_weight" \ --target-feature "average_rating" \ --kmeans \ --kmeans-qty 5 \ --exclude-non-numeric "type", "name" \ --exclude-out-of-scope "id" \ --affiliation-feature "yearpublished" \ --kfold \ --kfold-qty 10 \ --hyper-optim \ --hyper-optim-range 20 - Note: Ability to override
-
-
Advanced:
- Read the Implementation Guide in
prediction_config.py. - Configure desired input values into EVENT object within
input_event.py(see example configurations in examples shown below)- Note: Designed in accordance with AWS Lambda Function Programming Model
- Read the Implementation Guide in
- Run all Unittests with:
- Warning: Tests take approx 6 minutes on a recent computer with an SSD harddrive
python main.py --unittest
- KNN Regression achieves better RMSE than Linear Regression but with much higher Hyperparameter k value (up to 20x more) and with more Training columns used.
- Logistic Regression achieves better RMSE than only Linear Regression in the "university_admissions" dataset where the Target column contains Boolean values and where there are only two possible Training Columns. KNN Regression achieves slightly better RMSE than Logistic Regression, but with much higher Hyperparameter k value (20 instead of 1), so would take longer to compute on large datasets.
- Error Metrics reduce in multivariate configurations where more columns are used to Train the KNN model and when rows with NaN values are removed. Adding all columns as features instead of just the best four features actually reduces accuracy.
-
RMSE indicates how inaccurate we expect the predicted price value to be on average (i.e. if RMSE is $127 its means the model inaccurately predicts the price values by $127 on average, which means the model's usefulness must be improved by reducing the RMSE particularly when the average value in the "price" column may be $300)
-
About the MAE to RMSE Ratio
- Comparing MAE to RMSE Ratio highlights if "outliers" exist that cause large but infrequent errors.
- Expect MAE > RMSE (since RMSE takes the square root of the squared error MAE)
- RMSE penalises when large errors more than MAE (i.e. when dataset contains outlier observations that largely deviate from others)
- RMSE is in the denominator of the ratio such that higher RMSE results in smaller Ratio.
- Expect a model to contain large outliers when MAE < RMSE
-
Problem for Dataset 1:
- Problem (abstract) - What's the optimum nightly price (prediction) to rent a living space using existing data on local listings?
- Problem (narrow) - What's the optimum nightly price (prediction) to rent a living space using existing data of on local listings based on their attributes including price, number of bedrooms, room type?
-
Setup used:
- Training columns (features): "accommodates", "bedrooms", "bathrooms", "number_of_reviews"
- Target column: "price"
- K-Folds for Cross Validation: 10
- Hyperparameter k Range: 0 to 20
-
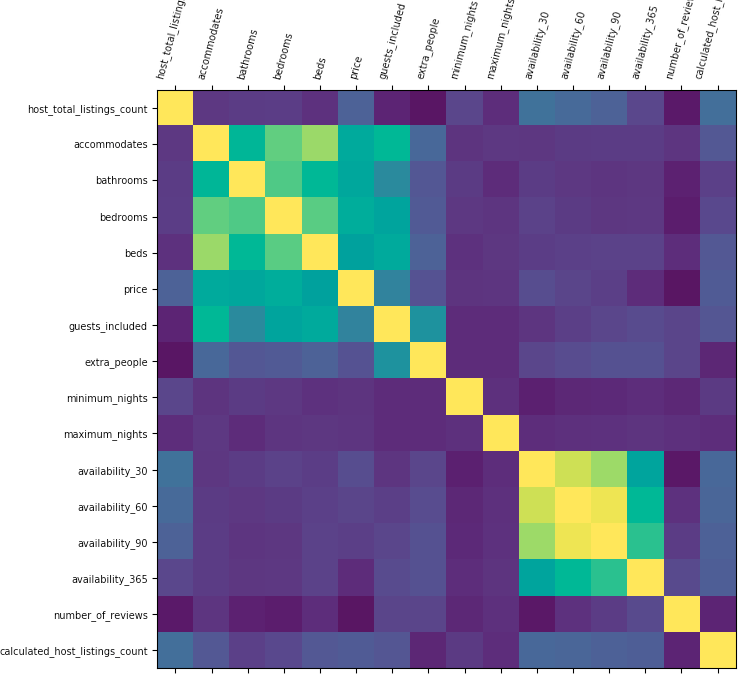
Correlations
-
Find pairwise Correlations between Target Column and other columns to identify columns to remove.
-
Screenshots
-
Correlations
-
-
-
Logistic Regression
- WARNING If you use the Default Target Column we are evaluating in the demo of "price", which
contains continuous float64 values it will not perform Logistic Regression.
Logistic Regression requires int64 values (i.e. Boolean 1's and 0's) to be in the Target Column. Currently the
implementation does not automatically convert the Target Column values from float64 to int64, instead
it throws a ValueError and recommends the user update the
input_event.pyfile and change the value tomodel_workflow_for_logistic_regression_algorithm_toggle": False, alternatively the user could inspect the dataset and choose a different Target Column that contains int64 values. Logistic Regression with a Target Column containing Boolean values is demonstrated in "university_admissions" dataset example.
- WARNING If you use the Default Target Column we are evaluating in the demo of "price", which
contains continuous float64 values it will not perform Logistic Regression.
Logistic Regression requires int64 values (i.e. Boolean 1's and 0's) to be in the Target Column. Currently the
implementation does not automatically convert the Target Column values from float64 to int64, instead
it throws a ValueError and recommends the user update the
-
Linear Regression
-
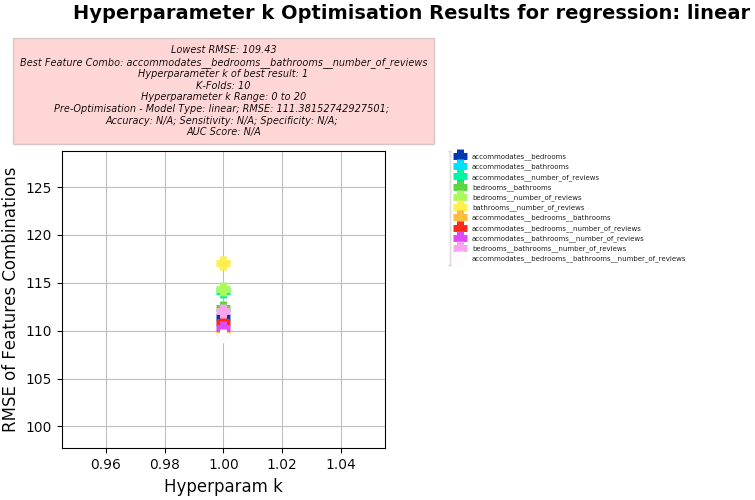
Results:
- Best Feature Combo: "accommodates", "bedrooms", "bathrooms", "number_of_reviews"
- Best RMSE:
- 109.43
- Pre-Optimisation Best RMSE:
- 111.38
- Hyperparameter k of best:
- 1
-
Screenshots:
-
-
KNN Regression
-
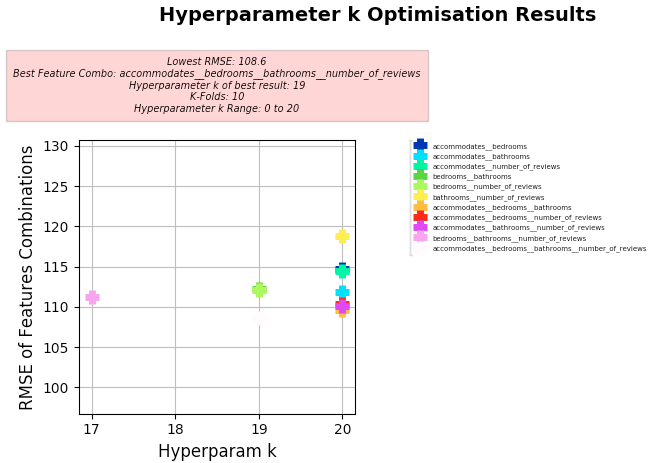
Key Results:
- Best Feature Combo: "accommodates", "bedrooms", "bathrooms", "number_of_reviews"
- Best RMSE:
- 108.6
- Hyperparameter k of best:
- 19
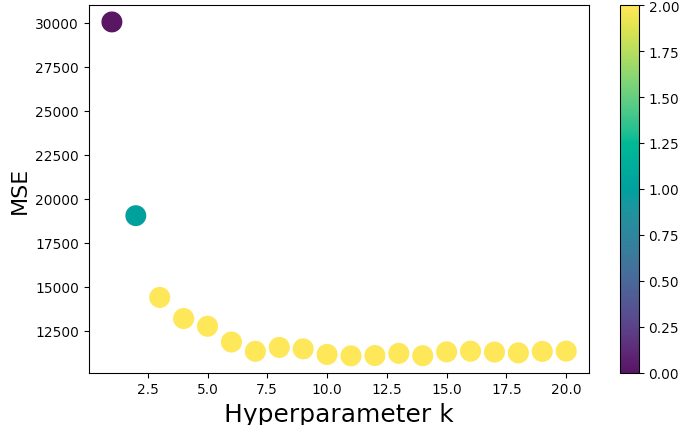
- Note: Using MSE, the best result was MSE 12718.88 with k of 17 using 10 K-Folds
-
Screenshots:
-
Prior Results
-
Univariate (one column) using manual KNN model with NaNs removed, with k=5 nearby neighbors
- Comparison of Results (of "price" vs "predicted_price"):
- Model Trained #1 "accommodates" column:
- MAE: 61.42
- MSE: 15117.62
- RMSE: 122.95
- MAE to RMSE Ratio: 0.50:1
- Model Trained #2 "bedrooms" column:
- MAE: 52.82
- MSE: 13663.12
- RMSE: 116.89
- Note: Expect model to be off by $116 on average for predicted price values
- MAE to RMSE Ratio: 0.45:1
- Key Changes:
- Removal of columns with >20% of its rows being NaN
- Columns with <1% of NaNs having the shared row/observation were removed
- Model Trained #1 "accommodates" column:
- Comparison of Results (of "price" vs "predicted_price"):
-
Multivariate (two columns) using Scikit-Learn KNN model with NaNs removed, with k=5 nearby neighbors
- Comparison of Results (of "price" vs "predicted_price"):
- Model Trained with two features (both "accommodates" and "bedrooms" columns):
- MAE (Two features): 31.20
- MSE (Two features): 13315.05
- RMSE (Two features): 115.39
- MAE to RMSE Ratio (Two features): 0.27:1
- Key Changes:
- Train using two features/columns (multivariate) instead of just one (univariate) with Scikit-Learn library instead of manually computation
- Removal of columns with >20% of its rows being NaN
- Columns with <1% of NaNs having the shared row/observation were removed
- Model Trained with two features (both "accommodates" and "bedrooms" columns):
- Comparison of Results (of "price" vs "predicted_price"):
-
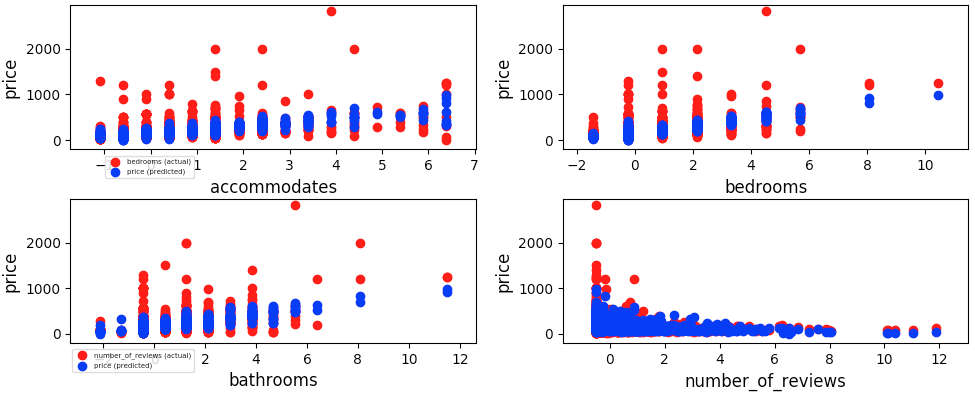
Multivariate (four columns) using Scikit-Learn KNN model with NaNs removed, with k=5 nearby neighbors
-
Comparison of Results (of "price" vs "predicted_price"):
- Model Trained with Four features ("accommodates", "bedrooms", "bathrooms", and "number_of_reviews" columns):
- MAE (Four features): 32.90
- MSE (Four features): 12754.54
- RMSE (Four features): 112.94
- MAE to RMSE Ratio (Four features): 0.29:1
- Model Trained with Four features ("accommodates", "bedrooms", "bathrooms", and "number_of_reviews" columns):
-
Screenshots:
-
-
Multivariate (ALL columns) using Scikit-Learn KNN model with NaNs removed, with k=5 nearby neighbors
- Comparison of Results (of "price" vs "predicted_price"):
- Model Trained with ALL features (excluding those containing "id", "_id", or "-id":
- 'host_total_listings_count', 'accommodates', 'bathrooms', 'bedrooms', 'beds', 'guests_included', 'minimum_nights', 'maximum_nights', 'availability_30', 'availability_60', 'availability_90', 'availability_365', 'number_of_reviews', 'calculated_host_listings_count
- MAE (Multiple features): 30.10
- MSE (Multiple features): 11630.41
- RMSE (Multiple features): 107.84
- MAE to RMSE Ratio (Multiple features): 0.28:1
- Model Trained with ALL features (excluding those containing "id", "_id", or "-id":
- Comparison of Results (of "price" vs "predicted_price"):
-
Hyperparameter Optimisation
kResults- Hyperparameter Range: 1 to 20
-
Features: ["accommodates", "bedrooms", "bathrooms", and "number_of_reviews"]
-
Screenshots:
-
-
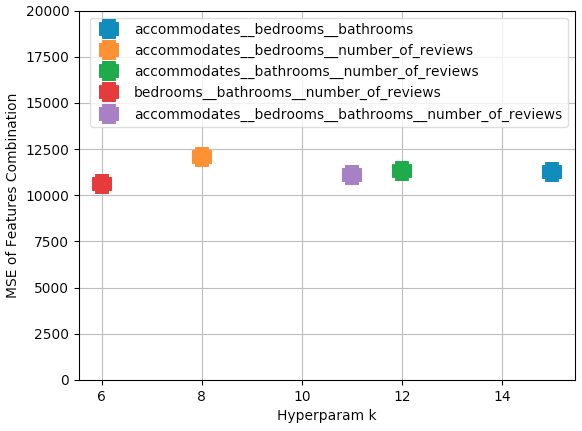
Features: All possible combinations of the features with no repeat combinations were compared and plotted (see below):
-
Best feature combo is 'bedrooms__bathrooms__number_of_reviews' having lowest MSE of 10606.68 using 'k' nearest neighbors of 6 (optimum)
-
Screenshots:
-
-
- Hyperparameter Range: 1 to 20
-
-
-
Problem for Dataset 2:
- Problem (abstract) - How do the properties of a car impact it's price?
- Problem (narrow) - How does the number of number of doors, curb weight, horsepower, city fuel usage, and highway fuel usage affect a car's price?
-
Setup used:
- Training columns (features): "num-of-doors", "curb-weight", "horsepower", "city-mpg", "highway-mpg"
- Target column: "price"
- K-Folds for Cross Validation: 10
- Hyperparameter k Range: 0 to 20
-
Logistic Regression
- WARNING Same warning as Example 1
-
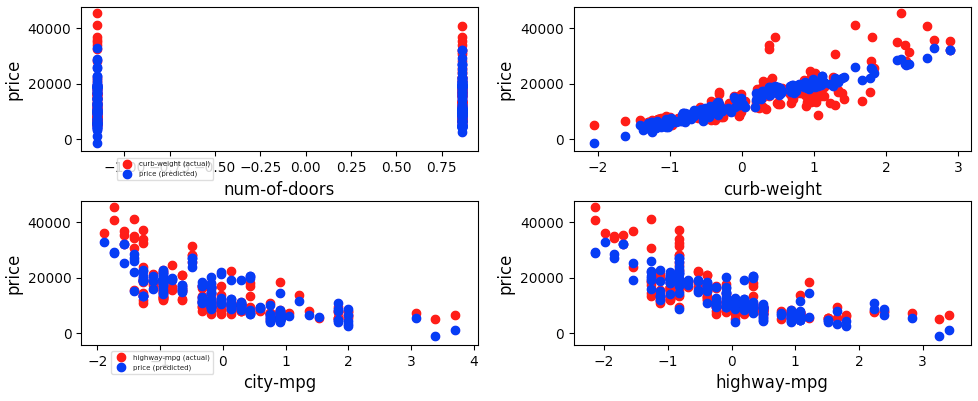
Linear Regression
-
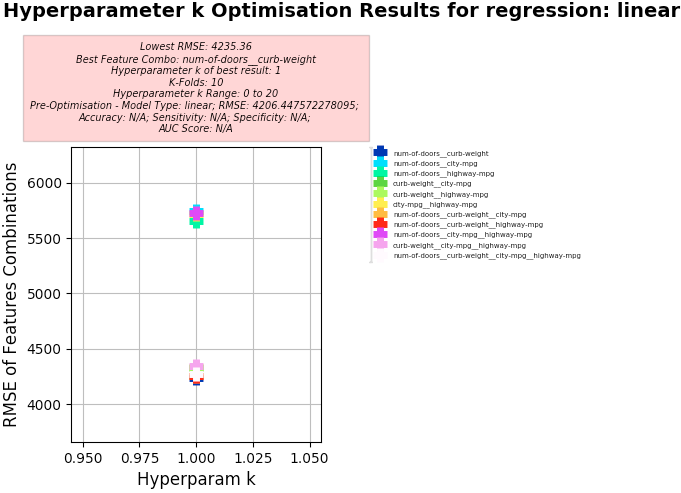
Key Results:
- Best Feature Combo: "num-of-doors", "curb-weight"
- Best RMSE:
- 4235.36
- Pre-Optimisation Best RMSE:
- 4206.44
- Hyperparameter k of best:
- 1
-
Screenshots:
-
Visual evaluation
-
Hyperparameter k Optimisation using Linear Regression
-
-
-
KNN Regression
-
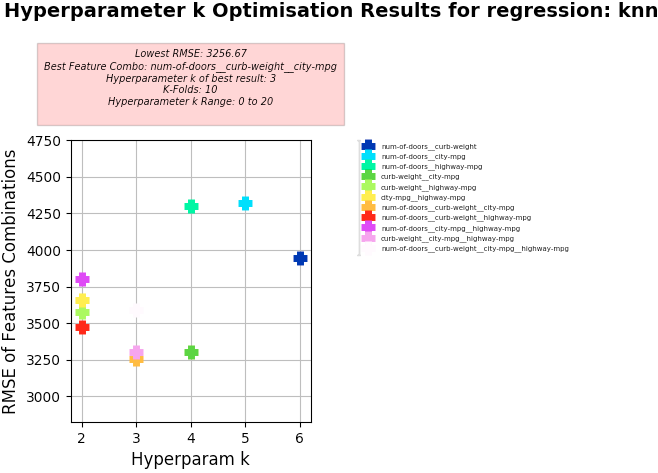
Key Results:
- Best Feature Combo: "num-of-doors", "curb-weight", "city-mpg"
- Best RMSE:
- 3256.67
- Hyperparameter k of best:
- 3
-
Screenshots:
-
Hyperparameter k Optimisation using KNN Regression
-
-
-
Problem 1 for Dataset 3:
- Problem (abstract) - How do the properties of a car impact it's fuel efficiency?
- Problem (narrow) - How does the number of cylinders, displacement, horsepower, weight, acceleration, and model year affect a car's fuel efficiency?
-
Problem 2 for Dataset 3:
- Problem (narrow) - How does the number of cylinders, displacement, horsepower, weight, acceleration, and model year affect
predicting the
originof the vehicle, either North America1, Europe2, or Asia3(Multi-Classification).
- Problem (narrow) - How does the number of cylinders, displacement, horsepower, weight, acceleration, and model year affect
predicting the
-
Setup used:
- Common
- Training columns (features): cylinders,displacement,horsepower,weight,acceleration,model-year,car-name
- K-Folds for Cross Validation: 10
- Hyperparameter k Range: 0 to 20
- Common
-
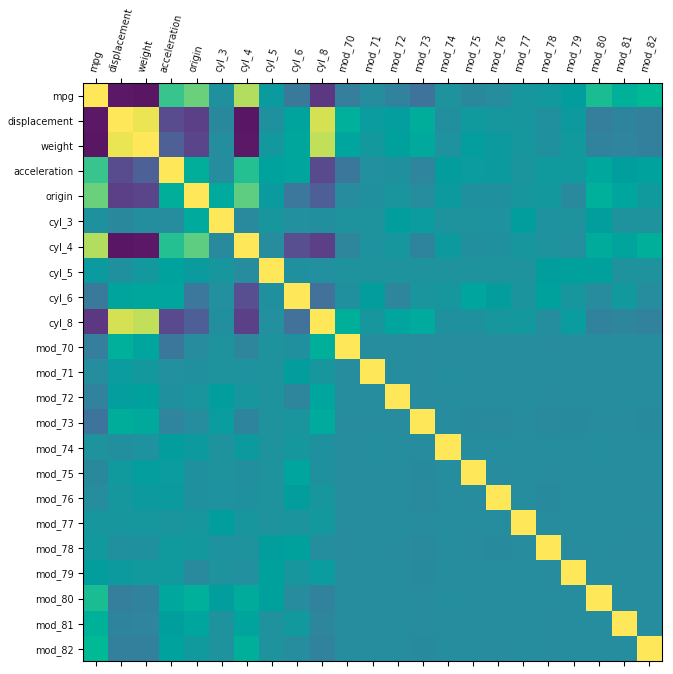
Correlation
-
Screenshots:
-
Multi-Classification Inputs Converted
-
-
-
Logistic Regression
- WARNING Same warning as Example 1 and 2
-
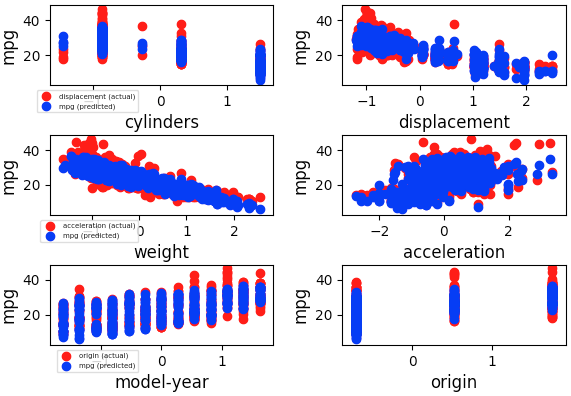
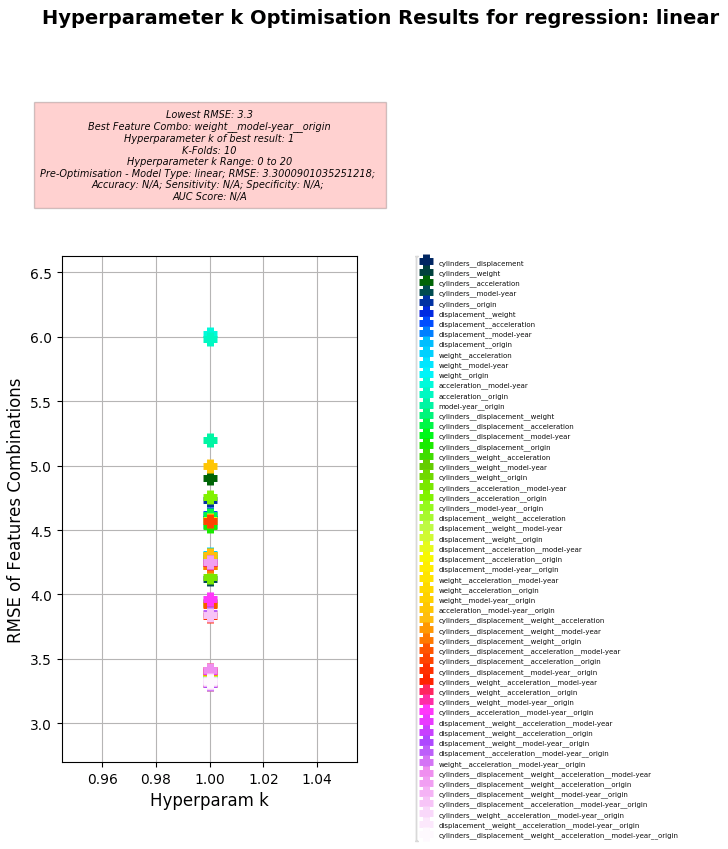
Linear Regression
-
Key Results:
- Best Feature Combo: weight, model-year, origin
- Best RMSE (to gain quantitative understanding of Models error (mismatch between the Model's Predictions and Actual values):
- 3.30 (Note: MAE to RMSE Ratio using Linear Regression: 0.61:1)
- Hyperparameter k of best:
- 1
-
Screenshots:
-
Multi-Classification Inputs Converted
-
Visual evaluation
-
-
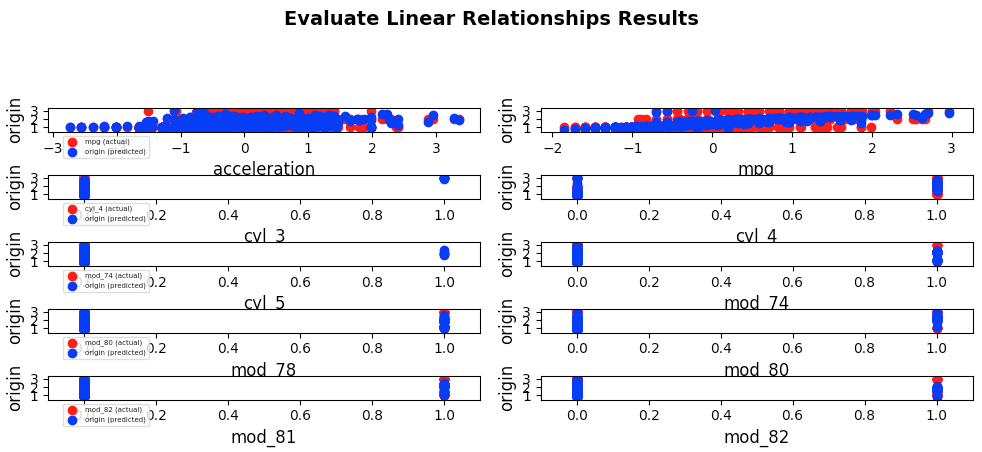
Non-Multi-Classification Inputs Converted
-
Visual evaluation (i.e. evaluate visually the Predicted Target value from training on known features vs Actual Target value to understand Linear Regression Model performance)
-
Hyperparameter k Optimisation using Linear Regression
-
-
-
-
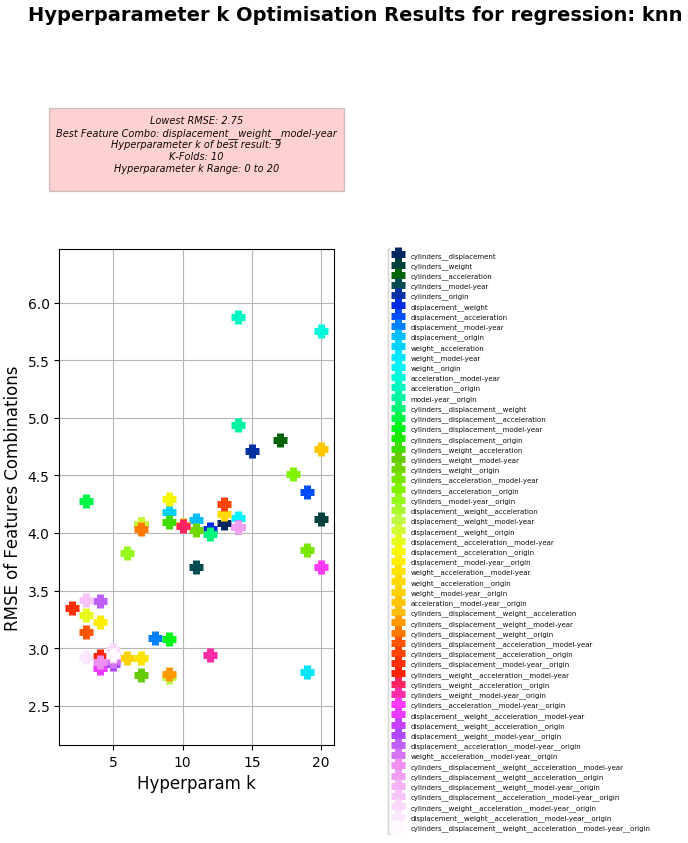
KNN Regression
-
Key Results:
- Best Feature Combo: displacement, weight, model-year
- Best RMSE:
- 2.75
- Hyperparameter k of best:
- 9
-
Screenshots:
-
Hyperparameter k Optimisation using KNN Regression (i.e. plotting RMSE for different combinations of feature columns to find lowest using KNN Regression)
-
-
-
Setup used:
- Training columns (features): gpa, gre
- Target column: admit
- K-Folds for Cross Validation: 10
- Hyperparameter k Range: 0 to 20
-
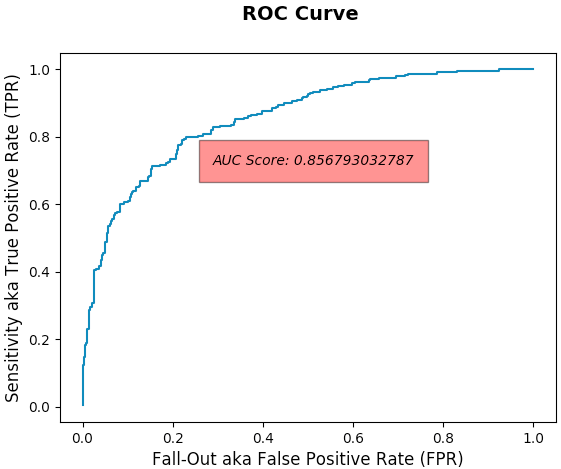
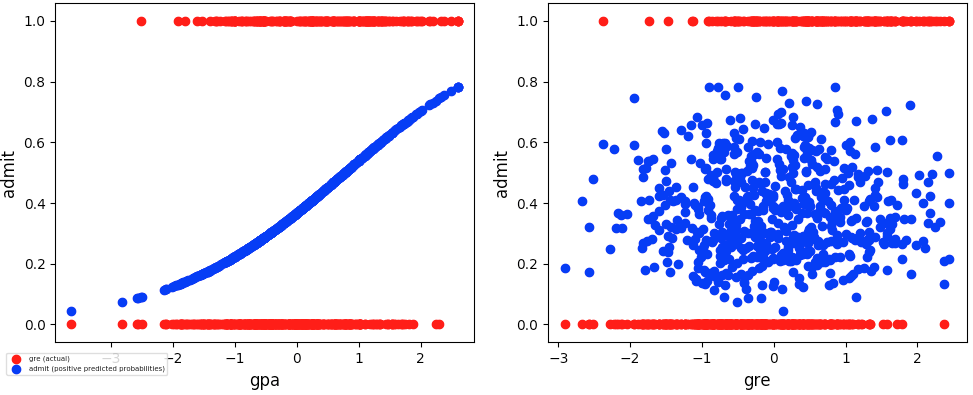
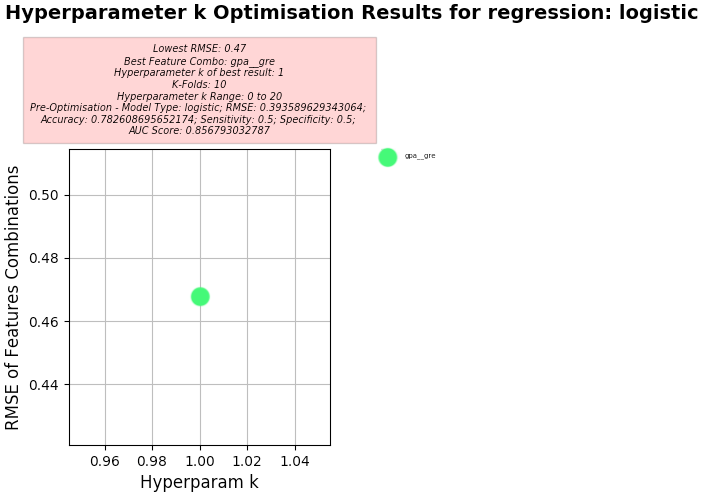
Logistic Regression
-
Key Results:
- Best Feature Combo: gpa, gre
- Best RMSE:
- 0.382 (Note: MAE to RMSE Ratio using Logistic Regression: 0.61:1)
- Hyperparameter k of best:
- 1
- Accuracy of Predictions (Predicted Target value when compared against Actual Target value) using default Discrimination Threshold of 0.5:
- 0.782 (78.2%)
- AUC (Area Under Curve) Score
- 0.857 (85.7%)
- Note: Predicts probability the Classifier will rank a random positive observation higher than a random negative observation. If it's higher than 50% (corresponding to simply randomly guessing) then its a good result but may indicate training more features to predict may be necessary.
- Sensitivity of Predictions (using Binary Classification):
- 0.5
- Specificity of Predictions (using Binary Classification):
- 0.5
-
Screenshots:
-
Receiver Operator Characteristic (ROC) Curve with AUC Score
-
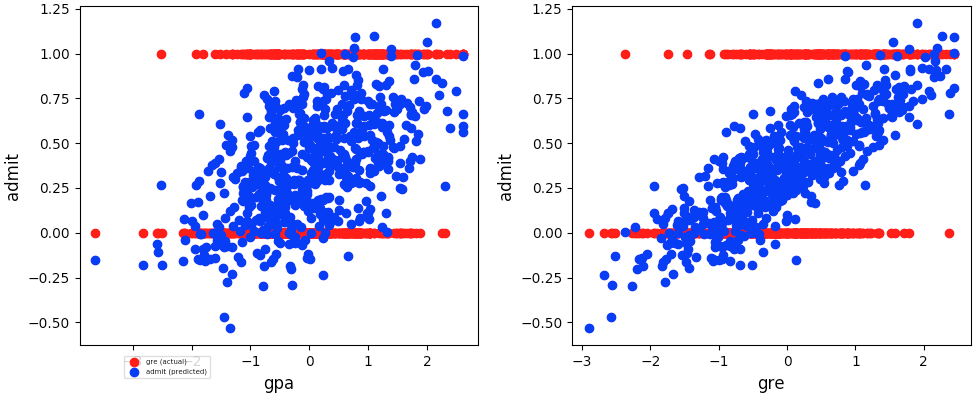
Visual evaluation
-
Hyperparameter k Optimisation using Logistic Regression
-
-
-
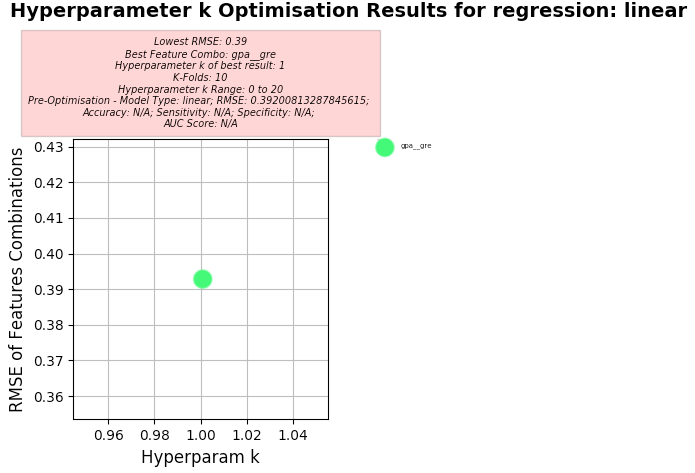
Linear Regression
-
Key Results:
- Best Feature Combo: gpa, gre
- Best RMSE:
- 0.392 (Note: MAE to RMSE Ratio using Linear Regression: 0.80:1)
- Hyperparameter k of best:
- 1
-
Screenshots:
-
Visual evaluation
-
Hyperparameter k Optimisation using Linear Regression
-
-
-
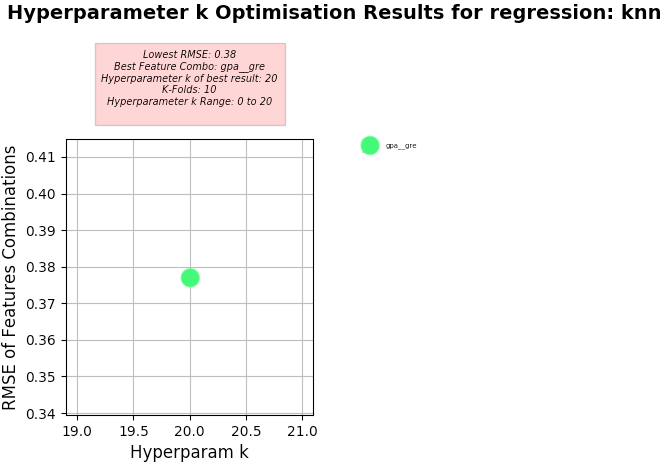
KNN Regression
-
Key Results:
- Best Feature Combo: gpa, gre
- Best RMSE:
- 0.377 with 'k' of 20 (optimum) using 10 K-Folds for Cross Validation
- Hyperparameter k of best:
- 20
-
Screenshots:
-
Hyperparameter k Optimisation using KNN Regression
-
-
-
Problem for Dataset 5:
- Problem (abstract) - What new legislation (decided by roll call votes to pass a bill by Senators) are most likely to cause 'extremist' Senators? (whereby some 'extremist' Senators decide not to vote along party lines in accordance with how their political party votes)
-
Setup used:
- Training columns (features): vote-bill1, vote-bill4, vote-bill5, vote-bill6, vote-bill7, vote-bill8
- Target column: extremism
- Affiliation column: party
- K-Folds for Cross Validation: 10
- Hyperparameter k Range: 0 to 20
-
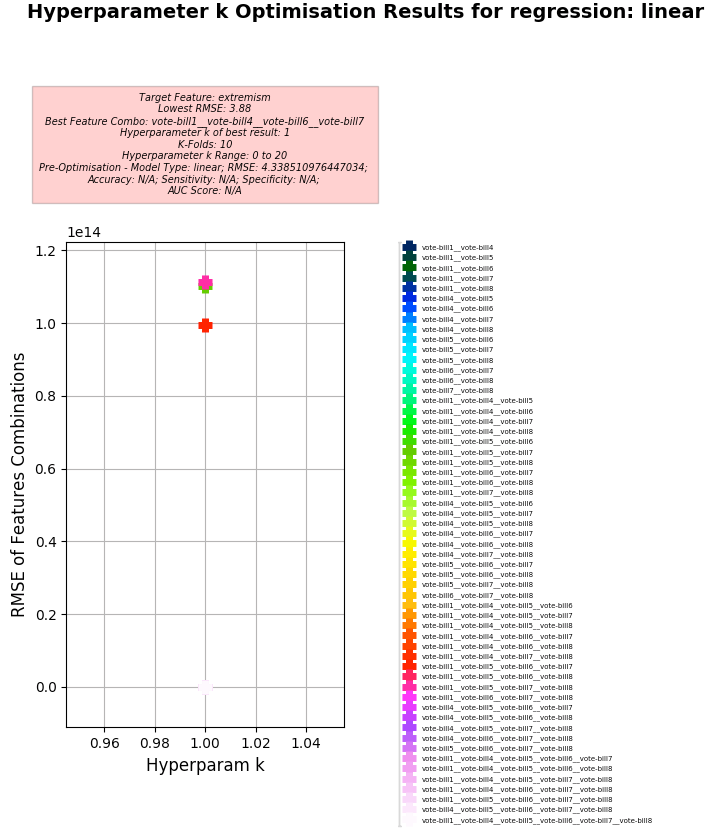
Linear Regression
-
Screenshots:
-
Visual evaluation
-
Hyperparameter k Optimisation using Linear Regression
-
-
-
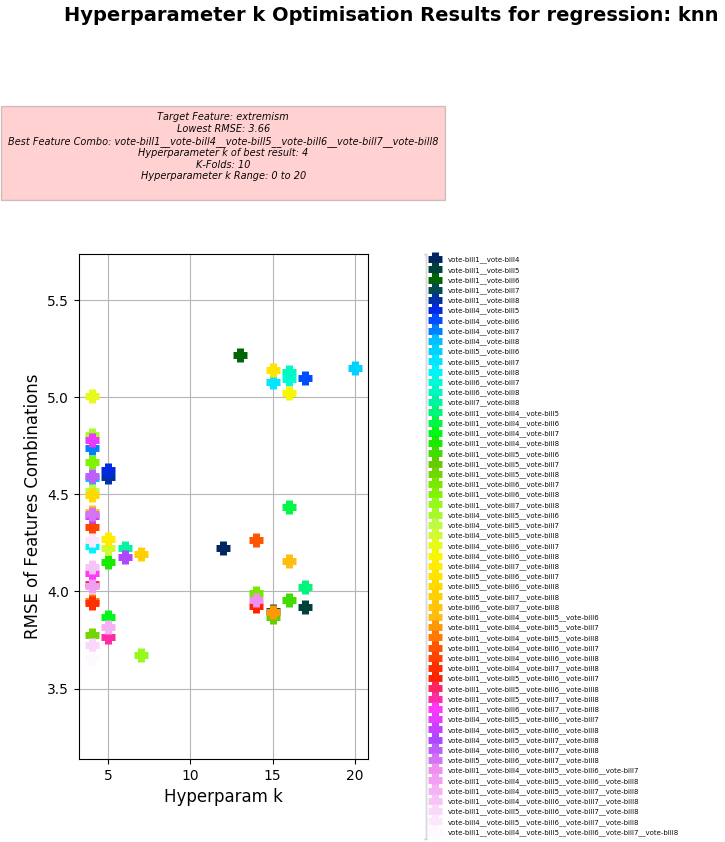
KNN Regression
-
Screenshots:
-
Hyperparameter k Optimisation using KNN Regression
-
-
-
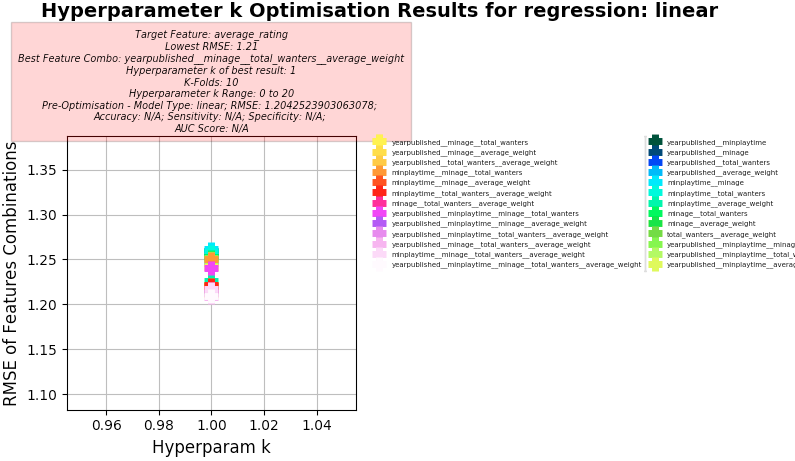
Problem for Dataset 6:
- Problem (abstract) - Given a data set listing 8000 single board games on each row with statistics and associated review scores scraped from BoardGameGeek.
Predict the
average_ratingTarget Column using the other columns - Note that other new custom prediction Target Columns could be generated by combining other columns such as:
- Playing time range: maxplaytime - minplaytime
- Average number of ratings: total_owners / users_rated
- Problem (abstract) - Given a data set listing 8000 single board games on each row with statistics and associated review scores scraped from BoardGameGeek.
Predict the
-
K-Means Clustering
- Implemented
-
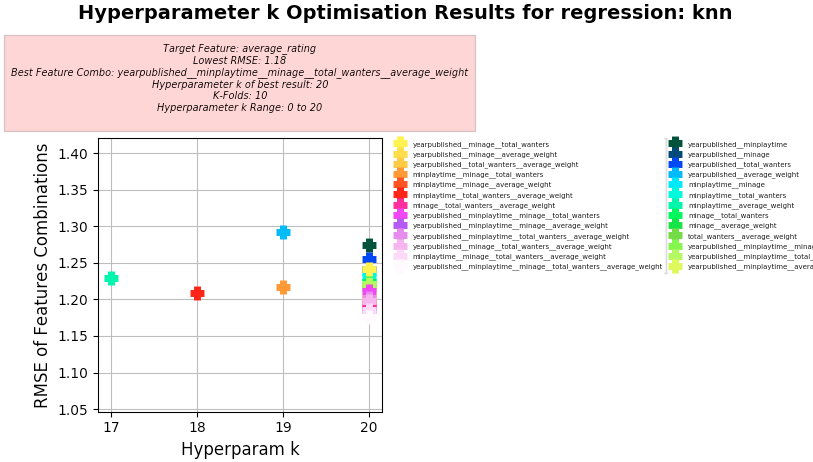
Setup used:
- Training columns (features): "minage", "total_wanters", "average_weight"
- Target column: average_rating
- K-Folds for Cross Validation: 10
- Hyperparameter k Range: 0 to 20
-
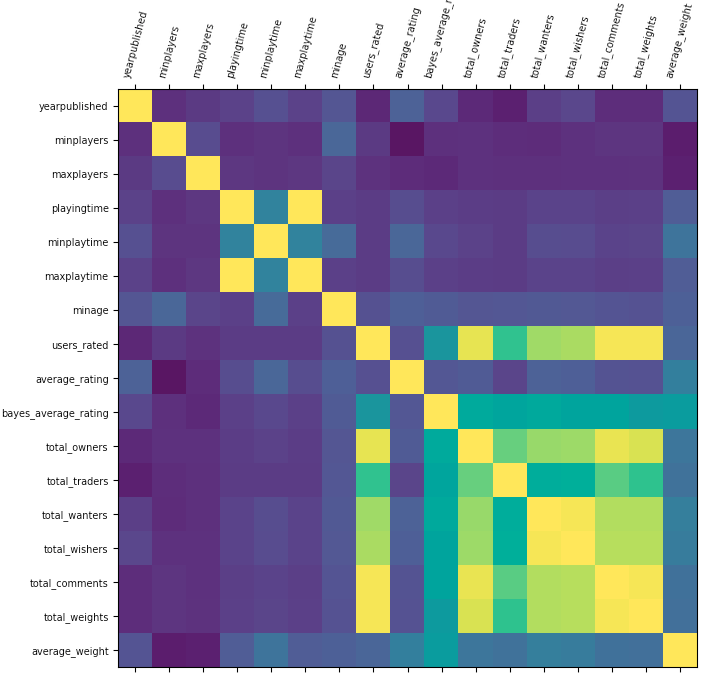
Correlations
-
Find pairwise Correlations between Target Column and other columns to identify columns to remove:
- Identify Columns to remove that do not correlate and add predictive power to the model
- Identify Columns to remove that are derived from the Target Column to avoid overfitting
-
Screenshots
-
Correlations
-
-
-
Linear Regression
-
Screenshots
-
-
KNN Regression
-
Screenshots
-


