Project analysis the gross domestic product (GDP) data for 10 central and eastern European countries. The analysis was prepared based on the World Bank Data, particularly the dataset World Development Indicatiors was utilized. This set contains many different economic development indicators you can choose from. For simplicity, I focused on four of them: GDP per capita ( US$), GDP per capita growth (annual %), GDP growth (annual %), GDP (current US$).
Data cleaning, manipulation and data transformation was done with use of Pandas - easy-to-use data structures and data analysis tools for python. Additionally, there are many visualizations, where some of them were prepared with matplotlib but regression plots and bar plots were created with seaborn library.
This project will introduce the basic Pandas concept like: data frames, data transformations with apply function, reshaping and pivot tables etc.
I choose pandas and seaborn because you can easily pass pandas data frame to seaborn and plot data from interesting columns or rows.
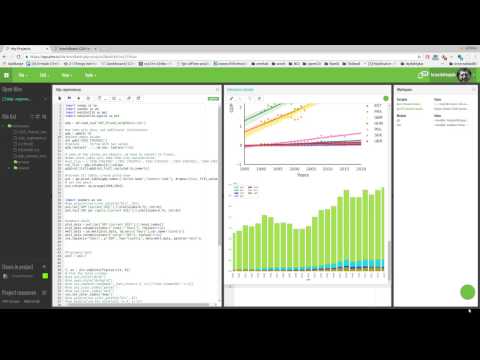
Sample plots:
This short youtube video presents what type of visualization is generated:
In order to be practical and choose the interesting subject. I challenge myself and try to answer the question: How far in economic development eastern Europe countries are relative to developed countries like Germany and France?
This led to analyzing four GDP factors:
- GDP per capita ( US$)
- GDP per capita growth (annual %)
- GDP growth (annual %)
- GDP (current US$)
For further analysis, the 10 countries were chosen:
- Poland
- Germany
- Belarus
- The Czech Republic
- The Slovak Republic
- Hungary
- Estonia
- France
- UK
- Ukraine
This project is composed in such a way to teach you data analysis pipeline. You will start with reading CSV file, clean the data, transform data to more appropriate structure and finally visualize interesting columns or rows from the data frame.
You will learn:
- How to read CVS files into Pandas Data Frame
- How to clean the data, remove missing values, remove unnecessary columns, convert dates etc.
- How to create pivot table in Pandas
- How to create plots based on pandas data frame
- How to create regression plots in seaborn (sns.lmplot)
- How to create bar plot witch stacked columns
The project contains two files, first contains raw CSV data taken from World Bank website. The second file is python script with all the pandas and seaborn code:
- GDP_Eastern_Europe.csv - data file, generated from World Bank Development Indicators
- gdp_pandas_woldbank.py - main file with analysis and plots
- You can download code from github
- You can run the project in your browser


