Giter Club home page Giter Club logo

unitfulrecipes.jl's Introduction

UnitfulRecipes.jl

for plotting data with units seamlessly in Julia

Deprecation

As of Plots.jl v1.34.2, UnitfulRecipes is included in Plots, and is no longer necessary. Instead, loading both Unitful.jl and Plots.jl suffices to plot unitful data.

Archive

UnitfulRecipes.jl makes it easy to plot data with units.

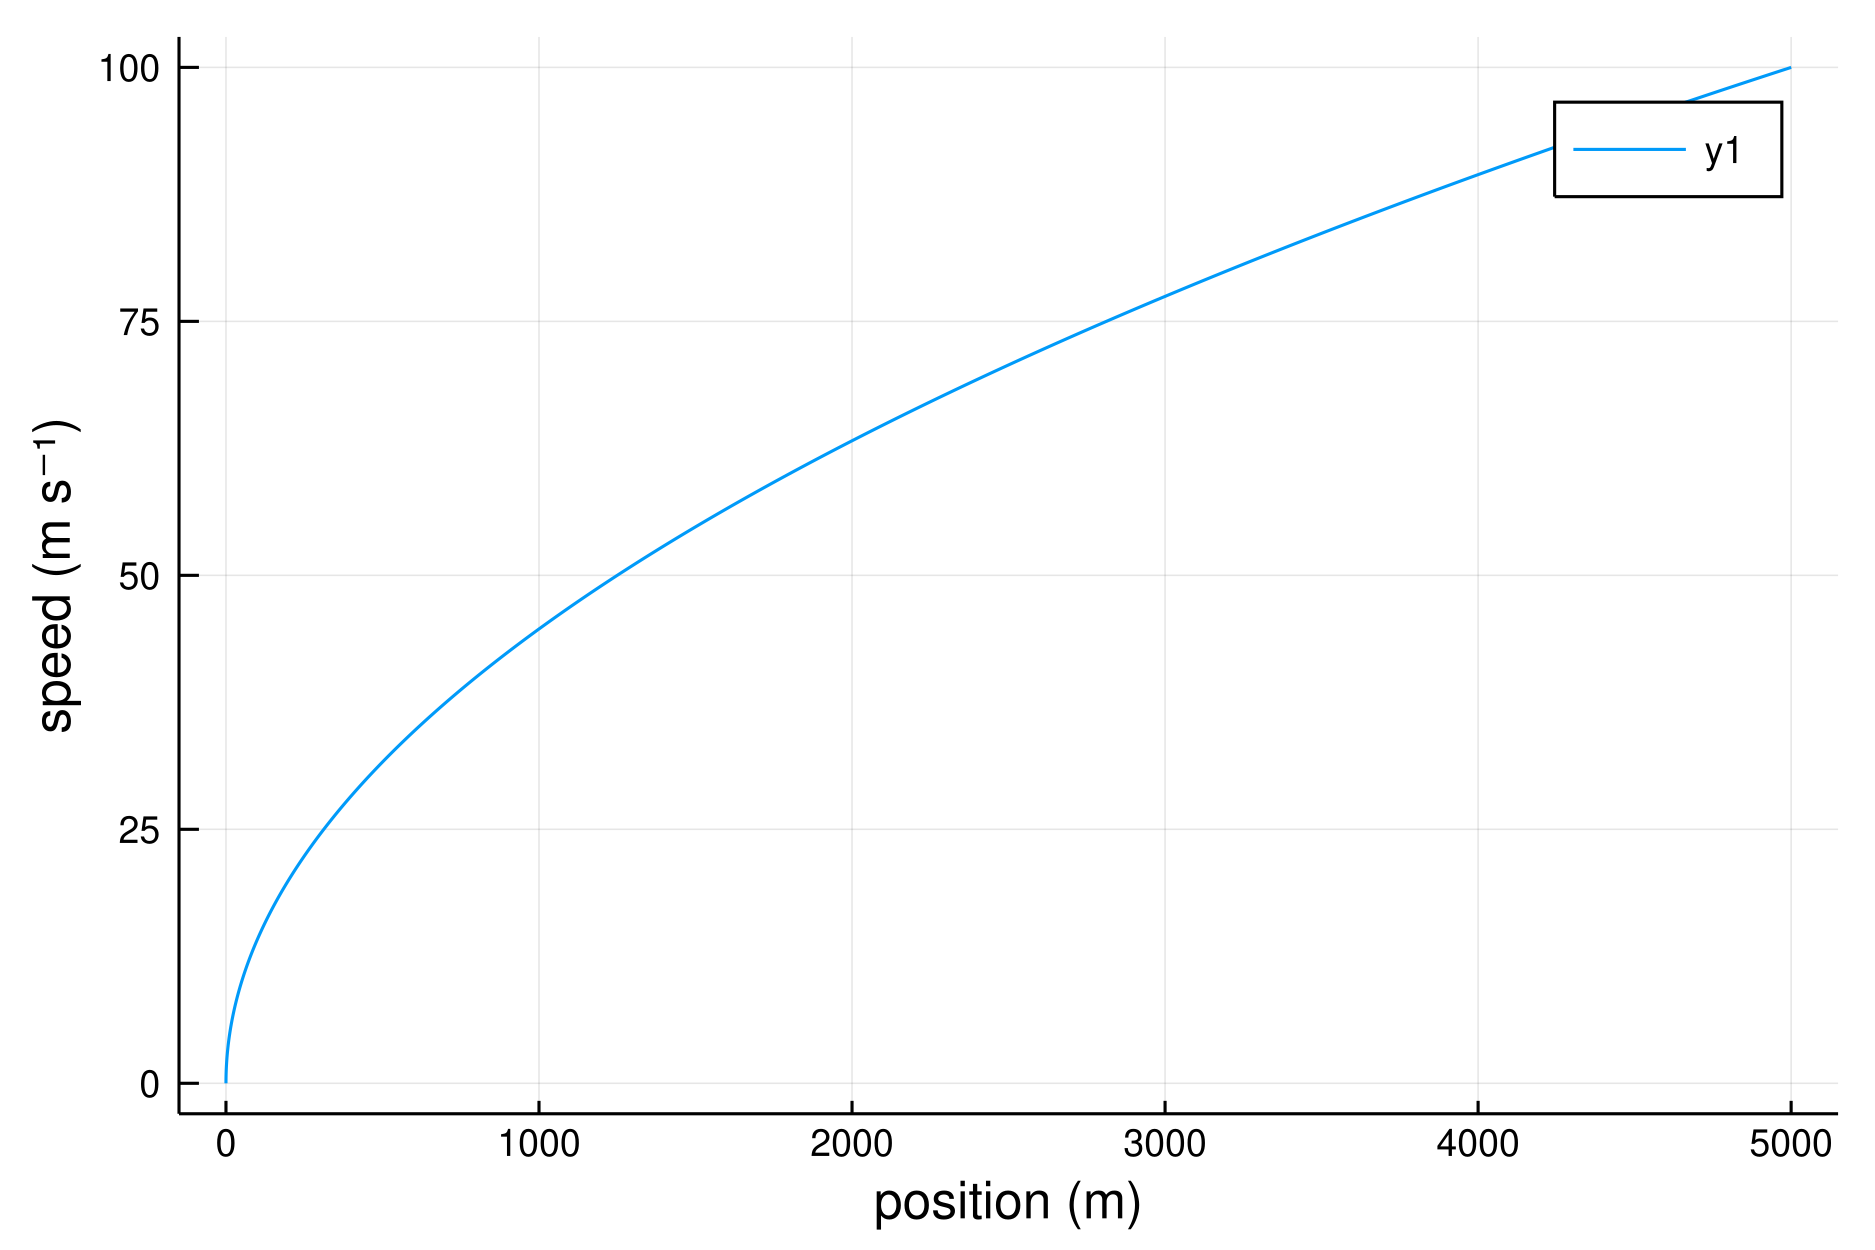
It works by providing recipes for the Plots.jl package that can deal with units from Unitful.jl. For a quick example,

using Unitful, UnitfulRecipes, Plots
const a = 1u"m/s^2"
v(t) = a * t
x(t) = a/2 * t^2
t = (0:0.01:100)*u"s"
plot(x.(t), v.(t), xlabel="position", ylabel="speed")

should give something like

UnitfulRecipeExample

Head over to the documentation for more examples!

Acknowledgements

Inspired by UnitfulPlots.jl.

unitfulrecipes.jl's People

Contributors

barche avatar briochemc avatar c42f avatar dandeepphase avatar dilumaluthge avatar github-actions[bot] avatar gustaphe avatar jefffessler avatar juliatagbot avatar jw3126 avatar rafaqz avatar

Stargazers

 avatar  avatar  avatar  avatar  avatar  avatar  avatar  avatar  avatar  avatar  avatar  avatar  avatar  avatar  avatar  avatar  avatar  avatar  avatar  avatar  avatar  avatar  avatar  avatar  avatar  avatar  avatar  avatar  avatar  avatar  avatar  avatar  avatar  avatar  avatar  avatar  avatar

Watchers

 avatar  avatar  avatar  avatar  avatar

unitfulrecipes.jl's Issues

Move all the CI stuff from Travis to Github actions?

This is just a suggestion.

I suggest this because Plots currently fails to build in Travis Windows CI (which fails the whole CI) and this would also allow us to have OS-specific badges of tests like I just did for DualMatrixTools.jl.

We could more or less copy-paste the workflows from that repo, but you would have to add a few things in the repo's settings:

  • add the CODECOV_TOKEN in the repo's secret tokens (find it in your codecov)
  • add the private DOCUMENTER_KEY to the secrets and the public documenter key to the "deploy keys" (keys to be generated using DocumenterTools as per Documenter's documentation)

histogram wrong labelled axis

using Unitful, UnitfulRecipes, Plots
x = randn(100)*u"m"
histogram(x)

gives

test

but the unit should be on the x-axis. I guess it's because in the recipe plot(x) assigns the label to the y-axis automatically.

Crash on annotate

Using annotate! with Unitful coordinates fails on GR, InspectDR, PGFPlotsX and UnicodePlots. On PlotlyJS no crash, but annotation ends up on top left corner of plot.

using Plots, PGFPlotsX, Plotly, PlotlyJS, InspectDR, UnicodePlots
using Unitful, UnitfulRecipes
gr() # or other backends
Plots.plot([0,1]u"s", [0,1]u"m")
Plots.annotate!([0.25]u"s", [0.5]u"m", text("annotation"))

Without units no crashes on all backends, but it is assumed that units are the same as in plot() call, i.e. here annotation will be at (0.25s,0.5m)

Plots.plot([0,1]u"s", [0,1]u"m")
Plots.annotate!([0.25], [0.5], text("annotation"))

GR stacktrace

ERROR: MethodError: no method matching wctondc(::Quantity{Float64, ๐“, Unitful.FreeUnits{(s,), ๐“, nothing}}, ::Quantity{Float64, ๐‹, Unitful.FreeUnits{(m,), ๐‹, nothing}})
Stacktrace:
[1] gr_display(sp::Plots.Subplot{Plots.GRBackend}, w::Measures.AbsoluteLength, h::Measures.AbsoluteLength, viewport_canvas::Vector{Float64}) 
    @ Plots ~/.local/share/julia/packages/Plots/FCUr0/src/backends/gr.jl:1050
[2] gr_display(plt::Plots.Plot{Plots.GRBackend}, fmt::String)
    @ Plots ~/.local/share/julia/packages/Plots/FCUr0/src/backends/gr.jl:699
[3] gr_display
    @ ~/.local/share/julia/packages/Plots/FCUr0/src/backends/gr.jl:665 [inlined]
[4] _display(plt::Plots.Plot{Plots.GRBackend}) 
    @ Plots ~/.local/share/julia/packages/Plots/FCUr0/src/backends/gr.jl:2250
[5] display(#unused#::Plots.PlotsDisplay, plt::Plots.Plot{Plots.GRBackend})
    @ Plots ~/.local/share/julia/packages/Plots/FCUr0/src/output.jl:164
[6] display(x::Any)
    @ Base.Multimedia ./multimedia.jl:328
[7] #invokelatest#2
    @ ./essentials.jl:729 [inlined]
[8] invokelatest
    @ ./essentials.jl:726 [inlined]
[9] print_response(errio::IO, response::Any, show_value::Bool, have_color::Bool, specialdisplay::Union{Nothing, AbstractDisplay})
    @ REPL ~/soft/julia-1.8.1/share/julia/stdlib/v1.8/REPL/src/REPL.jl:296
[10] (::REPL.var"#45#46"{REPL.LineEditREPL, Pair{Any, Bool}, Bool, Bool})(io::Any)
    @ REPL ~/soft/julia-1.8.1/share/julia/stdlib/v1.8/REPL/src/REPL.jl:278
[11] with_repl_linfo(f::Any, repl::REPL.LineEditREPL)
    @ REPL ~/soft/julia-1.8.1/share/julia/stdlib/v1.8/REPL/src/REPL.jl:521
[12] print_response(repl::REPL.AbstractREPL, response::Any, show_value::Bool, have_color::Bool)
    @ REPL ~/soft/julia-1.8.1/share/julia/stdlib/v1.8/REPL/src/REPL.jl:276
[13] (::REPL.var"#do_respond#66"{Bool, Bool, REPL.var"#77#87"{REPL.LineEditREPL, REPL.REPLHistoryProvider}, REPL.LineEditREPL, REPL.LineEdit.Prompt})(s::REPL.LineEdit.MIState, buf::Any, ok::Bool)
    @ REPL ~/soft/julia-1.8.1/share/julia/stdlib/v1.8/REPL/src/REPL.jl:857
[14] #invokelatest#2
    @ ./essentials.jl:729 [inlined]
[15] invokelatest
    @ ./essentials.jl:726 [inlined]
[16] run_interface(terminal::REPL.Terminals.TextTerminal, m::REPL.LineEdit.ModalInterface, s::REPL.LineEdit.MIState)
    @ REPL.LineEdit ~/soft/julia-1.8.1/share/julia/stdlib/v1.8/REPL/src/LineEdit.jl:2510
[17] run_frontend(repl::REPL.LineEditREPL, backend::REPL.REPLBackendRef)
    @ REPL ~/soft/julia-1.8.1/share/julia/stdlib/v1.8/REPL/src/REPL.jl:1248
[18] (::REPL.var"#49#54"{REPL.LineEditREPL, REPL.REPLBackendRef})()
    @ REPL ./task.jl:484

Julia v.1.8.1
Plots v.1.33.0
Unitful v.1.12.0
UnitfulRecipes v.1.6.0

Use traits to dispatch

I think we could have a bit of cleaner way to dispatch on unitful arrays by using traits instead of just dispatch. I had been thinking about this for a while and an answer on slack motivated me to think about this a bit more. This issue is just to start a discussion and keep track of this slack message from Mason Protter (because slack deletes everything):

struct Foo         end
struct Contains{T} end
struct Not{T}      end 
f(args...) = f(check_for_foo(args), args...)
check_for_foo(::T) where {T <: Tuple} = Foo โˆˆ T.parameters ? Contains{Foo}() : Not{Contains{Foo}}()
f(::Contains{Foo}, args...)      = "Foo in $(args)"
f(::Not{Contains{Foo}}, args...) = "Foo not in $(args)"

and then

julia> f(1, 2, 3)
"Foo not in (1, 2, 3)"
julia> f(1, Foo(), 4)
"Foo in (1, Foo(), 4)"

This requires some boiler-plate to set up, but it's at least O(1) methods instead of O(2^N)

Recipe request for Plots with ribbon keyword

It would be useful to add a recipe for plotting ribbons.
They provide very nice way of displaying propagation errors during simulations using MCM.jl, for instance.

using Unitful, UnitfulRecipes, Plots
x = 1:10
plot(x, -x.^2 .* 1u"m", ribbon=5)       # OK
plot(x, -x.^2 .* 1u"m", ribbon=1u"m")   # ERROR

1.0 release

@briochemc I think this package is pretty stable and we can do an 1.0 release. What do you think?

Recipe request for logarithmic units

plot([2u"dB", 3u"dB"]) doesn't work for me. Quick tests like this suggest that logarithmic units aren't working, for either axis. Is it possible/easy to add a recipe for these?

Units from 3rd axis applied to 4th plot

I have a surface that is drawn in 3D space (length x, y, and z) with a 4th axis, the colorbar, which could be unitless, time, pressure, or some other dimension. The issue is that the colorbar title keeps the units from the 3rd axis (m). If I try to color based on anything other than a unitless number or a length, I get an error. If I could rename the colorbar_title = "Real Title ($real_units)" I would just strip out those units myself, but the other unit stays in so the title would be: "Real Title (kPa) (m)".

begin
    X = [1u"m", 1u"m"; 1u"m", 1u"m"]
    Y = [1u"m", 1u"m"; 1u"m", 1u"m"]
    Z = [1u"m", 1u"m"; 1u"m", 1u"m"]
    C = rand(2,  2)
    surface!(X, Y, Z, surfacecolor=C, color=:turbo, colorbar=true, colorbar_title="this should change (kPa)")
end

image

I considered rolling my own for this, but I have other elements like the ball being brought into the plot using UnitfulRecipes so I would either have to enforce that everything comes in using the correct units or handle it elegantly or not use UnitfulRecipes for any of it and roll my own for the whole thing.

I've only just started making recipes of my own so when I open the code base it's a little beyond me. I think two potential solutions would be:

  1. Allow a user to turn off the automatic units application to a specific axis
  2. Have the colorbar pick up the units of the series its plotting

Please let me know if I've missed an easy solution or I'd be happy to contribute a solution with a little direction. Thanks!

Support Unitful xticks and yticks?

Thanks for this great package. Currently it supports Unitful xlim very nicely, but Unitful xticks leads to an error. This caught me because I often use xticks=[x[1],x[end]] to streamline plots and it fails if x has units. My workaround is xticks=[x[1],x[end]] / oneunit(x[1]) which is fine for now but I wanted to report the issue because it seems like it would be nicely consistent to support having the ticks be specified in the same units as the corresponding axis.

using Unitful, UnitfulRecipes, Plots 
x = 1u"mm" * (1:30)
scatter(x, 2x) # works as expected
scatter(x, 2x; xlim=(10u"mm", 20u"mm")) # works as expected!
scatter(x, 2x; xlim=(1u"cm", 2u"cm")) # works as expected - yay!
scatter(x, 2x; xticks=[1u"cm", 2u"cm"]) # error message

ERROR: DimensionError: 0.13 and 1.0 cm are not dimensionally compatible.

Is it neccessary that UnitfulStrings outlive the recipe?

I am asking because the pgfplots backend does some processing on labels etc. depending on whether its a LaTeXString or not.
But since UnitfulString{LaTeXString, ...} is not a LaTeXString, it goes the wrong path.

I could add extra handling for this, but in general I'd prefer if recipes didn't change the type of inputs.

unitful yerr seems to break

great package! Unfortunately, I couldn't get this to work with a unitful yerr. I'm getting an error message of "incompatible units" if I try to put a unitful yerr on a unitful value. The error message actually reports the y value without units, and the yerr with units.
For example:

momenta = [p*1u"GeV/c" for p in 1.0:0.1:10]
masses = [139.57039u"MeV/c^2"]
piMass = ones(length(momenta))*masses[1]
piErr=[10.882833439073304u"MeV/c^2" for p in momenta]
yerr=piErr
plot(momenta, [piMass], yerr=yerr, label=["pion"])

gives me:

DimensionError: 139.57039 and 10.882833439073304 MeV c^-2 are not dimensionally compatible.

Stacktrace:
  [1] -(x::Quantity{Float64, NoDims, Unitful.FreeUnits{(), NoDims, nothing}}, y::Quantity{Float64, ๐Œ, Unitful.FreeUnits{(c^-2, MeV), ๐Œ, nothing}})
    @ Unitful ~/.julia/packages/Unitful/JwSBO/src/quantities.jl:137
  [2] -(x::Float64, y::Quantity{Float64, ๐Œ, Unitful.FreeUnits{(c^-2, MeV), ๐Œ, nothing}})
    @ Base ./promotion.jl:323
  [3] error_coords(errorbar::Vector{Quantity{Float64, ๐Œ, Unitful.FreeUnits{(c^-2, MeV), ๐Œ, nothing}}}, errordata::Vector{Float64}, otherdata::Vector{Float64})
    @ Plots ~/.julia/packages/Plots/SjqWU/src/recipes.jl:1121
  [4] macro expansion
    @ ~/.julia/packages/Plots/SjqWU/src/recipes.jl:1159 [inlined]
  [5] apply_recipe(plotattributes::AbstractDict{Symbol, Any}, #unused#::Type{Val{:yerror}}, x::Any, y::Any, z::Any)
    @ Plots ~/.julia/packages/RecipesBase/92zOw/src/RecipesBase.jl:282
  [6] _process_seriesrecipe(plt::Any, plotattributes::Any)
    @ RecipesPipeline ~/.julia/packages/RecipesPipeline/VEk89/src/series_recipe.jl:50
  [7] _process_seriesrecipes!(plt::Any, kw_list::Any)
    @ RecipesPipeline ~/.julia/packages/RecipesPipeline/VEk89/src/series_recipe.jl:27
  [8] recipe_pipeline!(plt::Any, plotattributes::Any, args::Any)
    @ RecipesPipeline ~/.julia/packages/RecipesPipeline/VEk89/src/RecipesPipeline.jl:97
  [9] _plot!(plt::Plots.Plot, plotattributes::Any, args::Any)
    @ Plots ~/.julia/packages/Plots/SjqWU/src/plot.jl:172
 [10] #plot#129
    @ ~/.julia/packages/Plots/SjqWU/src/plot.jl:58 [inlined]
 [11] top-level scope
    @ In[31]:11
 [12] eval
    @ ./boot.jl:360 [inlined]
 [13] include_string(mapexpr::typeof(REPL.softscope), mod::Module, code::String, filename::String)
    @ Base ./loading.jl:1090

Compatibility when using two user recipes together

Hi,

I have encountered a problem when trying to use UnitfulRecipes together with my plotting scripts. I have a user-defined struct that contains data read from some files. Without using UnitfulRecipes, I have implemented a user recipe for my own type as follows:

@recipe function f(data::Data, var::AbstractString;
   plotrange=[-Inf,Inf,-Inf,Inf], plotinterval=0.1)

   ndim = data.head.ndim

   if !startswith(data.head.headline, "normalized")
      hasunits = true
      unitw = getunit(data, var)
   end

   if ndim == 2
      x, y, w = getdata(data, var, plotrange, plotinterval)
      unitx = getunit(data, data.head.variables[1])
      unity = getunit(data, data.head.variables[2])

      #@. x *= unitx
      #@. y *= unity
      @. w *= unitw

      @series begin
         seriestype --> :contourf  # use := if you want to force it
         x, y, w'
      end
   end
end

In the above function snippet, Data is the name of my struct, and with this I can plot like plot(data, "Ux") or contourf(data, "Ux"). However, with units involved in the function, right at the line @series, Julia complained about

ERROR: DimensionError:  and km s^-1 are not dimensionally compatible.
Stacktrace:
 [1] #s56#154 at /home/myuser/.julia/packages/Unitful/1t88N/src/conversion.jl:12 [inlined]
 [2] #s56#154(::Any, ::Any, ::Any) at ./none:0
 [3] (::Core.GeneratedFunctionStub)(::Any, ::Vararg{Any,N} where N) at ./boot.jl:527
 [4] uconvert(::Unitful.FreeUnits{(),NoDims,nothing}, ::Unitful.Quantity{Float32,๐‹ ๐“^-1,Unitful.FreeUnits{(km, s^-1),๐‹ ๐“^-1,nothing}}) at /home/myuser/.julia/packages/Unitful/1t88N/src/conversion.jl:78
 [5] convert(::Type{Float32}, ::Unitful.Quantity{Float32,๐‹ ๐“^-1,Unitful.FreeUnits{(km, s^-1),๐‹ ๐“^-1,nothing}}) at /home/hongyang/.julia/packages/Unitful/1t88N/src/conversion.jl:145
 [6] setindex! at ./array.jl:849 [inlined]
 [7] setindex! at ./multidimensional.jl:559 [inlined]
 [8] macro expansion at ./broadcast.jl:932 [inlined]
 [9] macro expansion at ./simdloop.jl:77 [inlined]
 [10] copyto! at ./broadcast.jl:931 [inlined]
 [11] copyto! at ./broadcast.jl:886 [inlined]
 [12] materialize! at ./broadcast.jl:848 [inlined]
 [13] materialize!(::Array{Float32,2}, ::Base.Broadcast.Broadcasted{Base.Broadcast.DefaultArrayStyle{2},Nothing,typeof(*),Tuple{Array{Float32,2},Base.RefValue{Unitful.FreeUnits{(km, s^-1),๐‹ ๐“^-1,nothing}}}}) at ./broadcast.jl:845
 [14] macro expansion at /home/local/myuser/SWMF/VisAnaJulia/src/visual_plots.jl:47 [inlined]
 [15] apply_recipe(::AbstractDict{Symbol,Any}, ::Data, ::AbstractString) at /home/hongyang/.julia/packages/RecipesBase/92zOw/src/RecipesBase.jl:282
 [16] _process_userrecipes!(::Any, ::Any, ::Any) at /home/myuser/.julia/packages/RecipesPipeline/uPBKQ/src/user_recipe.jl:36
 [17] recipe_pipeline!(::Any, ::Any, ::Any) at /home/myuser/.julia/packages/RecipesPipeline/uPBKQ/src/RecipesPipeline.jl:70
 [18] _plot!(::Plots.Plot, ::Any, ::Any) at /home/myuser/.julia/packages/Plots/vsE7b/src/plot.jl:172
 [19] #plot#129 at /home/myuser/.julia/packages/Plots/vsE7b/src/plot.jl:58 [inlined]
 [20] plot(::Any, ::Any) at /home/myuser/.julia/packages/Plots/vsE7b/src/plot.jl:52
 [21] top-level scope at REPL[5]:1

Does it mean that I cannot have two user recipes being used togther? What might be the possible solutions?

vline does not work properly

using Plots
using UnitfulRecipes
using Unitful: m, s

vline(randn(10)*s) # works
vline(randn(10)*s, yunit=m) # fails

plot(randn(10)*s, randn(10)*m)
vline!(randn(10)*s) # fails
DimensionError: m and s are not dimensionally compatible.

Stacktrace:
 [1] #s56#154 at /home/jan/.julia/packages/Unitful/KE9TK/src/conversion.jl:12 [inlined]
 [2] #s56#154(::Any, ::Any, ::Any) at ./none:0
 [3] (::Core.GeneratedFunctionStub)(::Any, ::Vararg{Any,N} where N) at ./boot.jl:527
 [4] uconvert(::Unitful.FreeUnits{(m,),๐‹,nothing}, ::Unitful.Quantity{Float64,๐“,Unitful.FreeUnits{(s,),๐“,nothing}}) at /home/jan/.julia/packages/Unitful/KE9TK/src/conversion.jl:77
 [5] ustrip at /home/jan/.julia/packages/Unitful/KE9TK/src/utils.jl:28 [inlined]
 [6] _broadcast_getindex_evalf at ./broadcast.jl:648 [inlined]
 [7] _broadcast_getindex at ./broadcast.jl:621 [inlined]
 [8] getindex at ./broadcast.jl:575 [inlined]
 [9] copy at ./broadcast.jl:876 [inlined]
 [10] materialize(::Base.Broadcast.Broadcasted{Base.Broadcast.DefaultArrayStyle{1},Nothing,typeof(Unitful.ustrip),Tuple{Base.RefValue{Unitful.FreeUnits{(m,),๐‹,nothing}},Array{Unitful.Quantity{Float64,๐“,Unitful.FreeUnits{(s,),๐“,nothing}},1}}}) at ./broadcast.jl:837
 [11] fixaxis!(::Dict{Symbol,Any}, ::Array{Unitful.Quantity{Float64,๐“,Unitful.FreeUnits{(s,),๐“,nothing}},1}, ::Symbol) at /home/jan/.julia/dev/UnitfulRecipes/src/UnitfulRecipes.jl:39
 [12] macro expansion at /home/jan/.julia/dev/UnitfulRecipes/src/UnitfulRecipes.jl:13 [inlined]
 [13] apply_recipe(::Dict{Symbol,Any}, ::Type{Array{Unitful.Quantity{Float64,๐“,Unitful.FreeUnits{(s,),๐“,nothing}},1}}, ::Array{Unitful.Quantity{Float64,๐“,Unitful.FreeUnits{(s,),๐“,nothing}},1}) at /home/jan/.julia/packages/RecipesBase/jcXIg/src/RecipesBase.jl:281
 [14] _apply_type_recipe(::Dict{Symbol,Any}, ::Array{Unitful.Quantity{Float64,๐“,Unitful.FreeUnits{(s,),๐“,nothing}},1}, ::Symbol) at /home/jan/.julia/packages/RecipesPipeline/wolJ9/src/type_recipe.jl:30
 [15] macro expansion at /home/jan/.julia/packages/RecipesPipeline/wolJ9/src/user_recipe.jl:144 [inlined]
 [16] apply_recipe(::Dict{Symbol,Any}, ::Array{Unitful.Quantity{Float64,๐“,Unitful.FreeUnits{(s,),๐“,nothing}},1}) at /home/jan/.julia/packages/RecipesBase/jcXIg/src/RecipesBase.jl:281
 [17] _process_userrecipes!(::Plots.Plot{Plots.GRBackend}, ::Dict{Symbol,Any}, ::Tuple{Array{Unitful.Quantity{Float64,๐“,Unitful.FreeUnits{(s,),๐“,nothing}},1}}) at /home/jan/.julia/packages/RecipesPipeline/wolJ9/src/user_recipe.jl:35
 [18] recipe_pipeline!(::Plots.Plot{Plots.GRBackend}, ::Dict{Symbol,Any}, ::Tuple{Array{Unitful.Quantity{Float64,๐“,Unitful.FreeUnits{(s,),๐“,nothing}},1}}) at /home/jan/.julia/packages/RecipesPipeline/wolJ9/src/RecipesPipeline.jl:68
 [19] _plot!(::Plots.Plot{Plots.GRBackend}, ::Dict{Symbol,Any}, ::Tuple{Array{Unitful.Quantity{Float64,๐“,Unitful.FreeUnits{(s,),๐“,nothing}},1}}) at /home/jan/.julia/packages/Plots/Xnzc7/src/plot.jl:167
 [20] plot(::Array{Unitful.Quantity{Float64,๐“,Unitful.FreeUnits{(s,),๐“,nothing}},1}; kw::Base.Iterators.Pairs{Symbol,Any,Tuple{Symbol,Symbol},NamedTuple{(:yunit, :seriestype),Tuple{Unitful.FreeUnits{(m,),๐‹,nothing},Symbol}}}) at /home/jan/.julia/packages/Plots/Xnzc7/src/plot.jl:57
 [21] #vline#380 at /home/jan/.julia/packages/RecipesBase/jcXIg/src/RecipesBase.jl:402 [inlined]
 [22] top-level scope at In[7]:6

use `Unitful.ustrip`

The definition at

function stripunit(x, u)

function stripunit(x, u)
    uconvert.(NoUnits, x/u)
end

seems to be the same as what Unitful.ustrip accomplishes. I had the same kind of helper in my code because I couldn't find ustrip, so I'm bringing it up just in case!

Shape() fails on conversion

The Shape() function gives the ERROR: DimensionError: and m are not dimensionally compatible.

using Unitful, Plots, UnitfulRecipes
Shape([(1u"m",1u"m"),(2u"m",2u"m"),(1u"m",2u"m")])

TagBot trigger issue

This issue is used to trigger TagBot; feel free to unsubscribe.

If you haven't already, you should update your TagBot.yml to include issue comment triggers.
Please see this post on Discourse for instructions and more details.

If you'd like for me to do this for you, comment TagBot fix on this issue.
I'll open a PR within a few hours, please be patient!

The `aspect_ratio` controls the digit spacing, ignoring the units

The following MWE makes a 2inch by 2inch square, using a mix of inches units and mm units for the two axes.

using Unitful: mm, inch
using UnitfulRecipes
using Plots

x = LinRange(-4,4,201) * 10mm
y = LinRange(-20,20,203) * inch

z = @. (abs(x) < 1inch) * (abs(y) < 1inch)'

ar = [1, :auto, :equal, :none]
pl = Array{Any}(undef, 4)
for (i, aspect_ratio) in enumerate(ar)
    pl[i] = heatmap(x, y, z'; aspect_ratio, title="$aspect_ratio", 
        colorbar=:none, alpha=0.5, 
        xlabel="x", ylabel="y", ytick=(-1:1)*20inch)
end
plot(pl...)

However, all four options for aspect_ratio, i.e., [1, :auto, :equal, :none] produce a rectangle rather than a square, because 1 and equal make the spacing of the digits equal, rather than the physical units. (Note the grid lines make squares for 1 and equal.)

Here is the resulting plot using UR v1.5.3 and Plots v1.13.1:

Screen Shot 2022-06-28 at 9 24 05 PM

In the long run, it might be preferable to have some option (perhaps equal) for aspect_ratio that makes the actual distances match (when the units are compatible). I have no idea whether it can be done here in UR or would require downstream changes in Plots.

In the short run, this issue at least will document the behavior. It would be easy to at least make the current heatmap example more informative by having axes with units:

https://jw3126.github.io/UnitfulRecipes.jl/stable/examples/2_Plots/#Heatmap,-categorical-axes,-and-aspect_ratio

KeyError: key :letter not found

Plots appears broken when units are used.

using Unitful, UnitfulRecipes, Plots
const a = 1u"m/s^2"
v(t) = a * t
x(t) = a/2 * t^2
t = (0:0.01:100)*u"s"
plot(x.(t), v.(t), xlabel="position", ylabel="speed")

KeyError: key :letter not found
Stacktrace:
 [1] getindex at .\dict.jl:477 [inlined]
 [2] macro expansion at C:\Users\james\.julia\packages\UnitfulRecipes\5RFXj\src\UnitfulRecipes.jl:12 [inlined]
 [3] apply_recipe(::Dict{Symbol,Any}, ::Type{Array{Quantity{Float64,๏ฟฝ,Unitful.FreeUnits{(m,),๏ฟฝ,nothing}},1}}, ::Array{Quantity{Float64,๏ฟฝ,Unitful.FreeUnits{(m,),๏ฟฝ,nothing}},1}) at C:\Users\james\.julia\packages\RecipesBase\G4s6f\src\RecipesBase.jl:279
 [4] _apply_type_recipe(::Dict{Symbol,Any}, ::Array{Quantity{Float64,๏ฟฝ,Unitful.FreeUnits{(m,),๏ฟฝ,nothing}},1}, ::Symbol) at C:\Users\james\.julia\packages\Plots\cc8wh\src\series.jl:186
 [5] macro expansion at C:\Users\james\.julia\packages\Plots\cc8wh\src\series.jl:268 [inlined]
 [6] apply_recipe(::Dict{Symbol,Any}, ::Array{Quantity{Float64,๏ฟฝ,Unitful.FreeUnits{(m,),๏ฟฝ,nothing}},1}, ::Array{Quantity{Float64,๏ฟฝ*๏ฟฝ^-1,Unitful.FreeUnits{(m, s^-1),๏ฟฝ*๏ฟฝ^-1,nothing}},1}) at C:\Users\james\.julia\packages\RecipesBase\G4s6f\src\RecipesBase.jl:279
 [7] _process_userrecipes(::Plots.Plot{Plots.GRBackend}, ::Dict{Symbol,Any}, ::Tuple{Array{Quantity{Float64,๏ฟฝ,Unitful.FreeUnits{(m,),๏ฟฝ,nothing}},1},Array{Quantity{Float64,๏ฟฝ*๏ฟฝ^-1,Unitful.FreeUnits{(m, s^-1),๏ฟฝ*๏ฟฝ^-1,nothing}},1}}) at C:\Users\james\.julia\packages\Plots\cc8wh\src\pipeline.jl:85
 [8] _plot!(::Plots.Plot{Plots.GRBackend}, ::Dict{Symbol,Any}, ::Tuple{Array{Quantity{Float64,๏ฟฝ,Unitful.FreeUnits{(m,),๏ฟฝ,nothing}},1},Array{Quantity{Float64,๏ฟฝ*๏ฟฝ^-1,Unitful.FreeUnits{(m, s^-1),๏ฟฝ*๏ฟฝ^-1,nothing}},1}}) at C:\Users\james\.julia\packages\Plots\cc8wh\src\plot.jl:178
 [9] plot(::Array{Quantity{Float64,๏ฟฝ,Unitful.FreeUnits{(m,),๏ฟฝ,nothing}},1}, ::Vararg{Any,N} where N; kw::Base.Iterators.Pairs{Symbol,String,Tuple{Symbol,Symbol},NamedTuple{(:xlabel, :ylabel),Tuple{String,String}}}) at C:\Users\james\.julia\packages\Plots\cc8wh\src\plot.jl:57

put units in label instead of tick labels

Currently, this MWE

using Unitful, UnitfulRecipes, Plots
x = rand(10)*u"m"
y = rand(10)*u"s"
plot(x,y)

gives

Screen Shot 2020-01-17 at 4 40 56 PM

IMHO, it's better to show units in the axis label rather than at every tick. My current solution is either

plot(ustrip(x), ustrip(y), xlabel=string(unit(eltype(x))), ylabel=string(unit(eltype(y))))

which gives

Screen Shot 2020-01-17 at 4 43 11 PM

or if I have a name for axis labels already, something like

plot(ustrip(x), ustrip(y), xlabel="x ($(unit(eltype(x))))", ylabel="y ($(string(unit(eltype(y)))))")

which gives

Screen Shot 2020-01-17 at 4 43 38 PM

Is that at all doable with recipes? If yes I would love this to be implemented instead of the current behavior!

Recipe for parametric with units?

Hi @jw3126, I expected both examples below to yield the same result:

# Example 1
ฮปs = (100:3000)u"nm"
plot(ฮปs, I_blackbody.(ฮปs), label=5000u"K")
ylims!((0, 5e-41))
# Example 2
plot(I_blackbody, 100u"nm", 3000u"nm", label=5000u"K")
ylims!((0, 5e-41))

The first one works as expected (even though it lacks the natural LaTeX string in the y-axis, as I'm using pyplot()):

graph

The second example, on the other hand, throws an error:

MethodError: no method matching adapted_grid(::Base.var"#64#65"{Base.var"#64#65"{RecipesPipeline.var"#11#12"{Symbol},typeof(Main.workspace3803.I_blackbody)},RecipesPipeline.var"#13#14"{Symbol}}, ::Tuple{Unitful.Quantity{Float64,๐‹,Unitful.FreeUnits{(nm,),๐‹,nothing}},Unitful.Quantity{Float64,๐‹,Unitful.FreeUnits{(nm,),๐‹,nothing}}})

Closest candidates are:

adapted_grid(::Any, !Matched::Tuple{Real,Real}; max_recursions) at /home/schneider/.julia/packages/PlotUtils/qd3Sm/src/adapted_grid.jl:15

    _scaled_adapted_grid(::Function, ::Symbol, ::Symbol, ::Unitful.Quantity{Int64,๐‹,Unitful.FreeUnits{(nm,),๐‹,nothing}}, ::Unitful.Quantity{Int64,๐‹,Unitful.FreeUnits{(nm,),๐‹,nothing}})@user_recipe.jl:307
    macro expansion@user_recipe.jl:286[inlined]
    apply_recipe(::AbstractDict{Symbol,Any}, ::Function, ::Number, ::Number)@RecipesBase.jl:282
    _process_userrecipes!(::Plots.Plot{Plots.PyPlotBackend}, ::Dict{Symbol,Any}, ::Tuple{typeof(Main.workspace3803.I_blackbody),Unitful.Quantity{Int64,๐‹,Unitful.FreeUnits{(nm,),๐‹,nothing}},Unitful.Quantity{Int64,๐‹,Unitful.FreeUnits{(nm,),๐‹,nothing}}})@user_recipe.jl:35
    recipe_pipeline!(::Plots.Plot{Plots.PyPlotBackend}, ::Dict{Symbol,Any}, ::Tuple{typeof(Main.workspace3803.I_blackbody),Unitful.Quantity{Int64,๐‹,Unitful.FreeUnits{(nm,),๐‹,nothing}},Unitful.Quantity{Int64,๐‹,Unitful.FreeUnits{(nm,),๐‹,nothing}}})@RecipesPipeline.jl:69
    _plot!(::Plots.Plot{Plots.PyPlotBackend}, ::Dict{Symbol,Any}, ::Tuple{typeof(Main.workspace3803.I_blackbody),Unitful.Quantity{Int64,๐‹,Unitful.FreeUnits{(nm,),๐‹,nothing}},Unitful.Quantity{Int64,๐‹,Unitful.FreeUnits{(nm,),๐‹,nothing}}})@plot.jl:167
    #plot#129(::Base.Iterators.Pairs{Symbol,Unitful.Quantity{Int64,๐šฏ,Unitful.FreeUnits{(K,),๐šฏ,nothing}},Tuple{Symbol},NamedTuple{(:label,),Tuple{Unitful.Quantity{Int64,๐šฏ,Unitful.FreeUnits{(K,),๐šฏ,nothing}}}}}, ::typeof(RecipesBase.plot), ::Function, ::Vararg{Any,N} where N)@plot.jl:57
    top-level scope@Local: 4

Comparing this with the parametric example in the docs, I suspect this is due to the units of the start- and endpoints of the x-axis range (3000u"nm", etc.). Is this expected?

Error with `plot!(xticks)`

This is kind of a continuation of #55. Currently xticks works fine as part of a plot call with other stuff (thanks to #56), but not in isolation with plot!. Here is a MWE:

using Unitful: mm
using UnitfulRecipes
using Plots: plot, plot!, gui
xticks = [0mm, 1mm]
plot([0mm, 2mm], [0mm, 3mm], xticks = xticks) # works
plot!(xticks = xticks) # fails


Error showing value of type Plots.Plot{Plots.GRBackend}:
ERROR: DimensionError: -0.06 and 0.0 mm are not dimensionally compatible.
Stacktrace:
  [1] _lt
    @ ~/.julia/packages/Unitful/ApCuY/src/quantities.jl:272 [inlined]
  [2] <(x::Unitful.Quantity{Float64, NoDims, Unitful.FreeUnits{(), NoDims, nothing}}, y::Unitful.Quantity{Float64, ๐‹, Unitful.FreeUnits{(mm,), ๐‹, nothing}})
    @ Unitful ~/.julia/packages/Unitful/ApCuY/src/quantities.jl:262
  [3] <(x::Float64, y::Unitful.Quantity{Int64, ๐‹, Unitful.FreeUnits{(mm,), ๐‹, nothing}})
    @ Unitful ~/.julia/packages/Unitful/ApCuY/src/quantities.jl:264
  [4] <=(x::Float64, y::Unitful.Quantity{Int64, ๐‹, Unitful.FreeUnits{(mm,), ๐‹, nothing}})
    @ Base ./operators.jl:405
  [5] (::Plots.var"#93#95"{Float64, Float64})(t::Unitful.Quantity{Int64, ๐‹, Unitful.FreeUnits{(mm,), ๐‹, nothing}})
    @ Plots ~/.julia/packages/Plots/530RA/src/axes.jl:191

Perhaps the bug could be in Plots somewhere. But I am reporting it here initially because it works fine without units. Current workaround is to always specify xticks as part of plotting other stuff, instead of afterwards.

Tuple vs Vector behavior

When constructing lists from iterators, tuple and vectors yield different levels of wrapped data, which then gets differently ustripped when plotting. I personally find this tricky in Plots because I'm always putting tuples where vectors belong and vice versa.

using Plots
using Unitful, Unitful.DefaultSymbols, UnitfulRecipes
plot(cos,(0:180)ยฐ,label="Tuple")
plot!(cos,[0:180]ยฐ,label="Vector")

The vector comprehension ends up [(0:180)ยฐ] which then gets stripped to 0:180, whereas the Tuple version forms (0:180)ยฐ which uses degree math. So, the Tuple goes through half a rotation, and the Vector goes through 180 rotations.

No units on colorbar for 1-argument version of heatmap

using Unitful, UnitfulRecipes, Plots
using Unitful: m, s

x = m * (1:5)
y = s * (1:4)
z = x * y'

heatmap(x, y, z) # units on colorbar as expected
heatmap(z) # runs, but no units on colorbar

I'll try to address this in the same PR as for #57 but if you prefer them separated I can do that.

Square backets

Is there any reference to why normal brackets () are used to denote the units on the plot axes? I am used to the convension of square backets [], and the only think I found from quick googling is that one should denote e.g. time as time / s, which seems worse to me. Could there potentially be a flag or optional argument one can use to change the default?

Vector{Any} doesn't plot

Vector{Any} errors out when stripping units

using Unitful, Plots, UnitfulRecipes  
x=(1:10)u"m"
y=[]  
for n in x  
    push!(y,n^2)  
end  
plot(x,y)

ERROR: DimensionError: Inf and 1.0 m^2 are not dimensionally compatible.

I tried initialize the empty vector as Vector{Quantity}() but that didn't help. I don't know how to initialize it to include the types for the fields.

Units in colorbar clim

using Unitful, UnitfulRecipes, Plots
using Unitful: m, s

x = m * (1:5)
y = s * (1:4)
z = x * y'

heatmap(x, y, z, clim=(0,20)) # fine
heatmap(x, y, z, clim=extrema(z)) # error

# ERROR: DimensionError:  and m s are not dimensionally compatible.

I'll submit a PR.

New Recipes to support StatsPlots.jl

Hello!

It would be nice to be able to use UnitfulRecipes.jl with the functions (e.g. groupedbar() and kde()) from StatsPlots.jl.

Given that StatsPlots.jl is very closely related to Plots.jl (according to its own documentation), I wonder if this is something that is not too tricky to do?

If this has been posted to the wrong place (perhaps it belongs to StatsPlots instead?) then please let me know!

Many thanks!
J


Minimum working example, based on this example from StatsPlots.jl documentation

  • Assumes that StatsPlots, Unitful and UnitfulRecipes are installed using Package Manager
using StatsPlots

gr()

# Basic example without using Unitful.jl or UnitfulRecipes.jl
x = randn(1024); y = randn(1024);
marginalkde(x, x+y)

using Unitful

x_u = x .* u"m"; y1_u= y .* u"m"

using UnitfulRecipes

marginalkde(x_u, x_u+y_u) # This errors

Error message

  • Please note: it seems that the same error message is produced regardless of whether or not using UnitfulRecipes has already been executed in the REPL
julia> marginalkde(x_u, x_u+y_u)
ERROR: MethodError: no method matching kde(::Tuple{Vector{Quantity{Float64, ๐‹, Unitful.FreeUnits{(m,), ๐‹, nothing}}}, Vector{Quantity{Float64, ๐‹, Unitful.FreeUnits{(m,), ๐‹, nothing}}}})
Closest candidates are:
  kde(::AbstractVector{T} where T<:Real; bandwidth, kernel, npoints, boundary, weights) at ~/.julia/packages/KernelDensity/bNBAQ/src/univariate.jl:169
  kde(::AbstractVector{T} where T<:Real, ::Distributions.UnivariateDistribution; boundary, npoints, weights) at ~/.julia/packages/KernelDensity/bNBAQ/src/univariate.jl:155
  kde(::AbstractVector{T} where T<:Real, ::R; bandwidth, kernel, weights) where R<:AbstractRange at ~/.julia/packages/KernelDensity/bNBAQ/src/univariate.jl:162
  ...
Stacktrace:
  [1] macro expansion
    @ ~/.julia/packages/StatsPlots/LlHWB/src/marginalkde.jl:24 [inlined]
  [2] apply_recipe(plotattributes::AbstractDict{Symbol, Any}, kc::StatsPlots.MarginalKDE)
    @ StatsPlots ~/.julia/packages/RecipesBase/qpxEX/src/RecipesBase.jl:289
  [3] _process_userrecipes!(plt::Any, plotattributes::Any, args::Any)
    @ RecipesPipeline ~/.julia/packages/RecipesPipeline/OXGmH/src/user_recipe.jl:36
  [4] recipe_pipeline!(plt::Any, plotattributes::Any, args::Any)
    @ RecipesPipeline ~/.julia/packages/RecipesPipeline/OXGmH/src/RecipesPipeline.jl:70
  [5] _plot!(plt::Plots.Plot, plotattributes::Any, args::Any)
    @ Plots ~/.julia/packages/Plots/lW9ll/src/plot.jl:209
  [6] plot(args::Any; kw::Base.Pairs{Symbol, V, Tuple{Vararg{Symbol, N}}, NamedTuple{names, T}} where {V, N, names, T<:Tuple{Vararg{Any, N}}})
    @ Plots ~/.julia/packages/Plots/lW9ll/src/plot.jl:91
  [7] plot
    @ ~/.julia/packages/Plots/lW9ll/src/plot.jl:82 [inlined]
  [8] marginalkde(::Vector{Quantity{Float64, ๐‹, Unitful.FreeUnits{(m,), ๐‹, nothing}}}, ::Vararg{Vector{Quantity{Float64, ๐‹, Unitful.FreeUnits{(m,), ๐‹, nothing}}}}; kw::Base.Pairs{Symbol, Union{}, Tuple{}, NamedTuple{(), Tuple{}}})
    @ StatsPlots ~/.julia/packages/RecipesBase/qpxEX/src/RecipesBase.jl:364
  [9] marginalkde(::Vector{Quantity{Float64, ๐‹, Unitful.FreeUnits{(m,), ๐‹, nothing}}}, ::Vararg{Vector{Quantity{Float64, ๐‹, Unitful.FreeUnits{(m,), ๐‹, nothing}}}})
    @ StatsPlots ~/.julia/packages/RecipesBase/qpxEX/src/RecipesBase.jl:364
 [10] top-level scope
    @ REPL[13]:1

julia> versioninfo()
Julia Version 1.8.0
Commit 5544a0fab76 (2022-08-17 13:38 UTC)
Platform Info:
  OS: macOS (x86_64-apple-darwin21.4.0)
  CPU: 4 ร— Intel(R) Core(TM) i5-5250U CPU @ 1.60GHz
  WORD_SIZE: 64
  LIBM: libopenlibm
  LLVM: libLLVM-13.0.1 (ORCJIT, broadwell)
  Threads: 1 on 2 virtual cores
Environment:
  JULIA_EDITOR = code
  JULIA_NUM_THREADS = 

(@v1.8) pkg> st # manually edited to only show relevant packages
Status `~/.julia/environments/v1.8/Project.toml`
  [f3b207a7] StatsPlots v0.15.1
  [1986cc42] Unitful v1.11.0
  [42071c24] UnitfulRecipes v1.5.3

AxisArray images?

I'd like to implement a recipe for images stored as an AxisArray with unitful axes. Should I add it here, or are you trying to keep this package as lightweight as possible?

axis labels for `plot!`

If I start a figure with plot with some basic stuff like the title
and then use plot! to add data, the units do not appear. MWE:

using UnitfulRecipes
using Unitful: m
using Plots

x = (1:5)m
y = x.^2

p1 = plot(x, y, label="")
plot!(title = "this order works")

p2 = plot(title="no axis units here :(")
plot!(x, y, label="")

plot(p1, p2)

Screen Shot 2021-07-18 at 9 21 18 PM

I realize that in this MWE I could reverse the order and plot the data first then add the title,
but often I am looping over several datasets and adding each using plot!
so it can be convenient to start with the title or other stuff.
I am unsure if this issue is specific to UR and fixable,
or if it is a more general limitation of Recipes that I must find some other way to work around?

`vline` and `hline` not supporting both `xunit` and `yunit`

using Plots, Unitful, UnitfulRecipes

vline([2u"m"], xunit = u"ft") #works
vline([2u"m"], xunit = u"ft", yunit = u"ft") #LoadError: KeyError: key :unit not found
hline([2u"m"], yunit = u"ft") #works
hline([2u"m"], xunit = u"ft", yunit = u"ft") #LoadError: KeyError: key :unit not found

The calls where vline has a yunit and hline has a xunit produces

ERROR: LoadError: KeyError: key :unit not found
Stacktrace:
  [1] getindex(h::Dict{Symbol, Any}, key::Symbol)
    @ Base ./dict.jl:482
  [2] default(k::Symbol)
    @ Plots ~/.julia/packages/Plots/XuV6v/src/args.jl:740
  [3] warn_on_unsupported_args(pkg::Plots.GRBackend, plotattributes::RecipesPipeline.DefaultsDict)
    @ Plots ~/.julia/packages/Plots/XuV6v/src/args.jl:1215
  [4] _add_the_series(plt::Plots.Plot{Plots.GRBackend}, sp::Plots.Subplot{Plots.GRBackend}, plotattributes::RecipesPipeline.DefaultsDict)
    @ Plots ~/.julia/packages/Plots/XuV6v/src/pipeline.jl:359
  [5] add_series!(plt::Plots.Plot{Plots.GRBackend}, plotattributes::RecipesPipeline.DefaultsDict)
    @ Plots ~/.julia/packages/Plots/XuV6v/src/pipeline.jl:302
  [6] _process_seriesrecipe(plt::Any, plotattributes::Any)
    @ RecipesPipeline ~/.julia/packages/RecipesPipeline/CirY4/src/series_recipe.jl:46
  [7] _process_seriesrecipe(plt::Any, plotattributes::Any)
    @ RecipesPipeline ~/.julia/packages/RecipesPipeline/CirY4/src/series_recipe.jl:60
  [8] _process_seriesrecipes!(plt::Any, kw_list::Any)
    @ RecipesPipeline ~/.julia/packages/RecipesPipeline/CirY4/src/series_recipe.jl:27
  [9] recipe_pipeline!(plt::Any, plotattributes::Any, args::Any)
    @ RecipesPipeline ~/.julia/packages/RecipesPipeline/CirY4/src/RecipesPipeline.jl:97
 [10] _plot!(plt::Plots.Plot, plotattributes::Any, args::Any)
    @ Plots ~/.julia/packages/Plots/XuV6v/src/plot.jl:172
 [11] #plot#154
    @ ~/.julia/packages/Plots/XuV6v/src/plot.jl:58 [inlined]
 [12] vline(args::Any; kw::Any)
    @ Plots ~/.julia/packages/RecipesBase/92zOw/src/RecipesBase.jl:403
 [13] top-level scope
    @ ~/Library/Application Support/Code/User/globalStorage/buenon.scratchpads/scratchpads/34cdd249d862f9176704eaed2c12df8d/scratch1.jl:4
in expression starting at /Users/gerlacar/Library/Application Support/Code/User/globalStorage/buenon.scratchpads/scratchpads/34cdd249d862f9176704eaed2c12df8d/scratch1.jl:4

I realize that it doesn't really make sense to spec yunit for vline and xunit for hline , but this issue creeps up using vline and hline series types in a user recipe, e.g.

@userplot MyCoolPlot
@recipe function f(mcp::MyCoolPlot)
    x,y = mcp.args
    label := nothing
    @series begin
        seriestype := :vline
        seriescolor := :black
        linestyle := :dash
        x
    end
    @series begin
        seriestype := :hline
        seriescolor := :black
        linestyle := :dash
        y
    end
    seriestype --> :scatter
    x,y
end

mycoolplot(20*rand(3)*u"m", 20*rand(3)*u"m") # works
mycoolplot(20*rand(3)*u"m", 20*rand(3)*u"m", xunit = u"ft") # same issue as above

Recommend Projects

  • React photo React

    A declarative, efficient, and flexible JavaScript library for building user interfaces.

  • Vue.js photo Vue.js

    ๐Ÿ–– Vue.js is a progressive, incrementally-adoptable JavaScript framework for building UI on the web.

  • Typescript photo Typescript

    TypeScript is a superset of JavaScript that compiles to clean JavaScript output.

  • TensorFlow photo TensorFlow

    An Open Source Machine Learning Framework for Everyone

  • Django photo Django

    The Web framework for perfectionists with deadlines.

  • D3 photo D3

    Bring data to life with SVG, Canvas and HTML. ๐Ÿ“Š๐Ÿ“ˆ๐ŸŽ‰

Recommend Topics

  • javascript

    JavaScript (JS) is a lightweight interpreted programming language with first-class functions.

  • web

    Some thing interesting about web. New door for the world.

  • server

    A server is a program made to process requests and deliver data to clients.

  • Machine learning

    Machine learning is a way of modeling and interpreting data that allows a piece of software to respond intelligently.

  • Game

    Some thing interesting about game, make everyone happy.

Recommend Org

  • Facebook photo Facebook

    We are working to build community through open source technology. NB: members must have two-factor auth.

  • Microsoft photo Microsoft

    Open source projects and samples from Microsoft.

  • Google photo Google

    Google โค๏ธ Open Source for everyone.

  • D3 photo D3

    Data-Driven Documents codes.