joferkington / mplstereonet Goto Github PK
View Code? Open in Web Editor NEWStereonets for matplotlib
License: MIT License
Stereonets for matplotlib
License: MIT License


Hi,
I have a question that may be very simple but I can't figure it out.
I have quite a few density_contourf plots. Based on the default density estimation method used 'exponential_kamb' I would like to plot the plane to the most dense pole of my dataset. I could also add a text label with the dominant strike/dip set.
Is there any way to extract the strike/dip from the density estimation? Am I missing a function that can do this?
Thanks,
Mike
Can you add a blurb + link to https://github.com/matplotlib/matplotlib/blob/master/doc/mpl_toolkits/index.rst ?
Hello @joferkington,
np.float has been deprecated in favor of np.float64, see https://numpy.org/doc/stable/release/1.20.0-notes.html#using-the-aliases-of-builtin-types-like-np-int-is-deprecated.
Hi,
There seems to be some issues with grid in 0.6-dev.
mplstereonet-0.5

mplstereonet-0.6-dev

If you know where the issue might be, and can point me in the right direction, I don'd mind looking into it myself.
When I pip install, the kinematic_analysis library isn't provided.
Using anaconada with pyton 3 on Linux. Installed mplstereonet 0.5 with pip. Can't get a polar overlay.
import matplotlib.pyplot as plt
import mplstereonet
fig = plt.figure()
ax = fig.add_subplot(111, projection='stereonet')
ax.grid(kind='polar')
fig.show()
AttributeError Traceback (most recent call last)
in ()
4 fig = plt.figure()
5 ax = fig.add_subplot(111, projection='stereonet')
----> 6 ax.grid(kind='polar')
7 fig.show()
/home/wack/bin/anaconda3/lib/python3.4/site-packages/matplotlib/axes/_base.py in grid(self, b, which, axis, **kwargs)
2424
2425 if axis == 'x' or axis == 'both':
-> 2426 self.xaxis.grid(b, which=which, **kwargs)
2427 if axis == 'y' or axis == 'both':
2428 self.yaxis.grid(b, which=which, **kwargs)
/home/wack/bin/anaconda3/lib/python3.4/site-packages/matplotlib/axis.py in grid(self, b, which, **kwargs)
1370 tick.gridOn = self._gridOnMajor
1371 if len(kwargs):
-> 1372 tick.gridline.update(kwargs)
1373 self._major_tick_kw['gridOn'] = self._gridOnMajor
1374 self.stale = True
/home/wack/bin/anaconda3/lib/python3.4/site-packages/matplotlib/artist.py in update(self, props)
854 func = getattr(self, 'set_' + k, None)
855 if func is None or not six.callable(func):
--> 856 raise AttributeError('Unknown property %s' % k)
857 func(v)
858 changed = True
AttributeError: Unknown property kind
I have been trying to plot a list of poles, each pole with an individual color also stored in a list. If I run this as a scatter plot (see code below), the plot executes normally. (Matplotlib 3.1.1)
fig = plt.figure(figsize=(3,3), dpi=300)
ax1 = fig.add_subplot(111)
ax1.scatter([1,2,3],[4,5,6],color=['red','green','blue'])
plt.show()
However, if I try the same thing with 'pole':
fig = plt.figure(figsize=(3,3), dpi=300)
ax1 = fig.add_subplot(111, projection='stereonet')
ax1.pole([1,2,3],[4,5,6],color=['red','green','blue'])
plt.show()
I get the following error message:
TypeError Traceback (most recent call last)
~/anaconda2/envs/SNS-Analysis-py36/lib/python3.6/site-packages/matplotlib/colors.py in to_rgba(c, alpha)
173 try:
--> 174 rgba = _colors_full_map.cache[c, alpha]
175 except (KeyError, TypeError): # Not in cache, or unhashable.
TypeError: unhashable type: 'list'
During handling of the above exception, another exception occurred:
ValueError Traceback (most recent call last)
~/anaconda2/envs/SNS-Analysis-py36/lib/python3.6/site-packages/IPython/core/formatters.py in call(self, obj)
339 pass
340 else:
--> 341 return printer(obj)
342 # Finally look for special method names
343 method = get_real_method(obj, self.print_method)
~/anaconda2/envs/SNS-Analysis-py36/lib/python3.6/site-packages/IPython/core/pylabtools.py in (fig)
242
243 if 'png' in formats:
--> 244 png_formatter.for_type(Figure, lambda fig: print_figure(fig, 'png', **kwargs))
245 if 'retina' in formats or 'png2x' in formats:
246 png_formatter.for_type(Figure, lambda fig: retina_figure(fig, **kwargs))
~/anaconda2/envs/SNS-Analysis-py36/lib/python3.6/site-packages/IPython/core/pylabtools.py in print_figure(fig, fmt, bbox_inches, **kwargs)
126
127 bytes_io = BytesIO()
--> 128 fig.canvas.print_figure(bytes_io, **kw)
129 data = bytes_io.getvalue()
130 if fmt == 'svg':
~/anaconda2/envs/SNS-Analysis-py36/lib/python3.6/site-packages/matplotlib/backend_bases.py in print_figure(self, filename, dpi, facecolor, edgecolor, orientation, format, bbox_inches, **kwargs)
2047 orientation=orientation,
2048 dryrun=True,
-> 2049 **kwargs)
2050 renderer = self.figure._cachedRenderer
2051 bbox_artists = kwargs.pop("bbox_extra_artists", None)
~/anaconda2/envs/SNS-Analysis-py36/lib/python3.6/site-packages/matplotlib/backends/backend_agg.py in print_png(self, filename_or_obj, *args, **kwargs)
508
509 """
--> 510 FigureCanvasAgg.draw(self)
511 renderer = self.get_renderer()
512
~/anaconda2/envs/SNS-Analysis-py36/lib/python3.6/site-packages/matplotlib/backends/backend_agg.py in draw(self)
400 toolbar = self.toolbar
401 try:
--> 402 self.figure.draw(self.renderer)
403 # A GUI class may be need to update a window using this draw, so
404 # don't forget to call the superclass.
~/anaconda2/envs/SNS-Analysis-py36/lib/python3.6/site-packages/matplotlib/artist.py in draw_wrapper(artist, renderer, *args, **kwargs)
48 renderer.start_filter()
49
---> 50 return draw(artist, renderer, *args, **kwargs)
51 finally:
52 if artist.get_agg_filter() is not None:
~/anaconda2/envs/SNS-Analysis-py36/lib/python3.6/site-packages/matplotlib/figure.py in draw(self, renderer)
1647
1648 mimage._draw_list_compositing_images(
-> 1649 renderer, self, artists, self.suppressComposite)
1650
1651 renderer.close_group('figure')
~/anaconda2/envs/SNS-Analysis-py36/lib/python3.6/site-packages/matplotlib/image.py in _draw_list_compositing_images(renderer, parent, artists, suppress_composite)
136 if not_composite or not has_images:
137 for a in artists:
--> 138 a.draw(renderer)
139 else:
140 # Composite any adjacent images together
~/anaconda2/envs/SNS-Analysis-py36/lib/python3.6/site-packages/matplotlib/artist.py in draw_wrapper(artist, renderer, *args, **kwargs)
48 renderer.start_filter()
49
---> 50 return draw(artist, renderer, *args, **kwargs)
51 finally:
52 if artist.get_agg_filter() is not None:
~/anaconda2/envs/SNS-Analysis-py36/lib/python3.6/site-packages/matplotlib/axes/_base.py in draw(self, renderer, inframe)
2626 renderer.stop_rasterizing()
2627
-> 2628 mimage._draw_list_compositing_images(renderer, self, artists)
2629
2630 renderer.close_group('axes')
~/anaconda2/envs/SNS-Analysis-py36/lib/python3.6/site-packages/matplotlib/image.py in _draw_list_compositing_images(renderer, parent, artists, suppress_composite)
136 if not_composite or not has_images:
137 for a in artists:
--> 138 a.draw(renderer)
139 else:
140 # Composite any adjacent images together
~/anaconda2/envs/SNS-Analysis-py36/lib/python3.6/site-packages/matplotlib/artist.py in draw_wrapper(artist, renderer, *args, **kwargs)
48 renderer.start_filter()
49
---> 50 return draw(artist, renderer, *args, **kwargs)
51 finally:
52 if artist.get_agg_filter() is not None:
~/anaconda2/envs/SNS-Analysis-py36/lib/python3.6/site-packages/matplotlib/lines.py in draw(self, renderer)
779
780 ec_rgba = mcolors.to_rgba(
--> 781 self.get_markeredgecolor(), self._alpha)
782 fc_rgba = mcolors.to_rgba(
783 self._get_markerfacecolor(), self._alpha)
~/anaconda2/envs/SNS-Analysis-py36/lib/python3.6/site-packages/matplotlib/colors.py in to_rgba(c, alpha)
174 rgba = _colors_full_map.cache[c, alpha]
175 except (KeyError, TypeError): # Not in cache, or unhashable.
--> 176 rgba = _to_rgba_no_colorcycle(c, alpha)
177 try:
178 _colors_full_map.cache[c, alpha] = rgba
~/anaconda2/envs/SNS-Analysis-py36/lib/python3.6/site-packages/matplotlib/colors.py in _to_rgba_no_colorcycle(c, alpha)
225 # float)andnp.array(...).astype(float)` all convert "0.5" to 0.5.
226 # Test dimensionality to reject single floats.
--> 227 raise ValueError("Invalid RGBA argument: {!r}".format(orig_c))
228 # Return a tuple to prevent the cached value from being modified.
229 c = tuple(c.astype(float))
ValueError: Invalid RGBA argument: ['red', 'green', 'blue']
Putting things in for loop works, but for 5000+ points, it's incredibly slow. Any suggestions?
I think it should be .sum() not .mean() on this line:
https://github.com/joferkington/mplstereonet/blob/master/mplstereonet/contouring.py#L18
According to the documentation, you want to make the weights sum to 1.
Only Fisher stats are available in stereonet_math.py, and these are not ideal to calculate the mean value of a series of planes or lines.
A new function (bingham_stats) that would provide the orientation of the three axes and the Bingham best fit plane would be beneficial. I need to calculate these for a project, so I hope to be able to propose a solution to this issue within the next two months.
I was updating some stereonet subplots in Jupyter (that used to look fine) and after running the cell the degrees around the stereonets did not plot correctly as they used to. Instead of plotting around the edge of the stereonets, they plotted all around the frame of the four subplots. I then tried on a single stereonet and it was better, but the degrees were positioned quite far away from the edge of the stereonet and I could not adjust that position.
Would be nice if one could do a pcolormesh on the ’’stereonet" Axes, right now array data doesn't seem to get projected correctly.

import numpy as np
import matplotlib.pyplot as plt
import mplstereonet

strikes = np.linspace(0, 360, 130, endpoint=True)
dips = np.linspace(0, 90, 100, endpoint=True)

mesh_strikes, mesh_dips = np.meshgrid(strikes, dips)

data = np.sin(np.radians(strikes * 4.0))[:, np.newaxis] * dips

fig = plt.figure(figsize=(10, 3))
ax_cart = fig.add_subplot(141)
ax_polar = fig.add_subplot(142, projection='polar')
ax_stereo = fig.add_subplot(143, projection='stereonet')
ax_stereo2 = fig.add_subplot(144, projection='stereonet')

mesh_strikes_radians = np.radians(mesh_strikes)

for ax, mesh_x, title in zip(
        (ax_cart, ax_polar, ax_stereo, ax_stereo2),
        (mesh_strikes, mesh_strikes_radians, mesh_strikes, mesh_strikes_radians),
        ('Carthesian', 'Polar', 'Stereo (degrees)', 'Stereo (radians)')):
    ax.pcolormesh(mesh_x, mesh_dips, data.T)
    ax.set_title(title)

plt.subplots_adjust(wspace=0.5, left=0.05, right=0.95)
plt.show()Hi everyone,
so basically I am trying to use ginput https://matplotlib.org/stable/api/_as_gen/matplotlib.pyplot.ginput.html, to interactively select points on the plots, that's because it seems the most practical, as I tried event handling and picking of matplotlib but these are more complex (not really, but ginput is handier) and anyway they don't give any different results. The problem is the system doesn't print data, but axes values instead, so for example if I pick azimuth=45°/dip=70° the output is [1.10190524, 0.720939] that I assume are the x, y coordinates of the axes. So even if I try to convert them, the results are more and more biased as I move away from the center of the axes, which I assume is due to the stretching of the plot getting towards the edge, even if I am not sure since I am not to deep into this kind of math/transformation-related problems.
Is there a way to transform these values so to have the right orientation values (e.g. azimuth and dip) in output?
Thanks a lot for the patience in reading this and thanks in advance to anyone who's going to answer
Stew
Hi,
When adding a colorbar, the annotations around the grid try to encompass the grid and the colorbar leading to something strange. Am I missing something ?
Thanks.
Phil

When running the examples in Ubuntu 16.04 and Python 3.5.2, I found the following error in parse_angelier_data.py
$ python parse_angelier_data.py Traceback (most recent call last): File "parse_angelier_data.py", line 66, in <module> main() File "parse_angelier_data.py", line 29, in main ax.rake(strike, dip, rake, 'ro') File "/home/jlb/.virtualenvs/open3d/lib/python3.5/site-packages/mplstereonet/stereonet_axes.py", line 319, in rake lon, lat = stereonet_math.rake(strike, dip, rake_angle) File "/home/jlb/.virtualenvs/open3d/lib/python3.5/site-packages/mplstereonet/stereonet_math.py", line 226, in rake lon, lat = _rotate(lon, lat, strike) File "/home/jlb/.virtualenvs/open3d/lib/python3.5/site-packages/mplstereonet/stereonet_math.py", line 78, in _rotate lon, lat = map(np.radians, [lon, lat]) AttributeError: 'float' object has no attribute 'radians'
This prevented the execution of all examples with angelier data.
Digging a little, I found that there is a case in the load function when parsing the rake value that returns a vector instead of an integer. In my case, the problem was solved by inserting:
rake = rake[0]
In line 58
I don't know if this is the right way to fix it though.
I tried using the 'weights = ' option in the density_contourf function to apply Terzaghi Weighting
cax = ax0.density_contourf(strikes, dips, measurement='poles',cmap='inferno',weights = Weights)
And got the following error:
Truth value of a Series is ambiguous. Use a.empty, a.bool(), a.item(), a.any() or a.all()
The code works fine when weights is omitted or =None.
Looks like the following line in def_count_point was the problem, and it fails because weights is an arraylike:
   if weights in (None, False):
        weights = 1
I kludged together the following fix to get the code to work
    try:
        if weights in (None, False):
            weights = 1
    # Normalize the weights
    except:
        weights = np.asarray(weights, dtype=np.float)
        weights /= weights.mean()
But I can't code at all - I'm sure you can find a much better solution.
Thank you so much for this fantastic library.
Hi!
Anyone who can help me to find a solution for identify a peak of families in mplstereonet, mplstereonet.kmean find a random center of peaks and the most of the time it is wrong to identify the peak. I want to aim to get a automatic identification of families of structures with dip and dip direction.

Hi @joferkington, I just tried the code of basic usage in Google Colab 2 weeks ago and it succeeded, but when I re-try to plot in Google Colab again, I spot an error that I couldn't solve. It's related to code: ax = fig.add_subplot(111, projection='stereonet'). The error is as follows:
---------------------------------------------------------------------------
TypeError                                 Traceback (most recent call last)
<ipython-input-13-5f249805830b> in <module>()
      3
      4 fig = plt.figure()
----> 5 ax = fig.add_subplot(111, projection='stereonet')
      6
      7 strike, dip = 315, 30

11 frames
/usr/local/lib/python3.6/dist-packages/mplstereonet/stereonet_transforms.py in transform_non_affine(self, ll)
     69     _inverse_type = 'BaseInvertedTransform'
     70     def transform_non_affine(self, ll):
---> 71         longitude = ll[:, 0:1]
     72         latitude  = ll[:, 1:2]
     73         clong = self._center_longitude

TypeError: tuple indices must be integers or slices, not tuple
I also attached my Colab notebook to you, link here. Is there something wrong or missing in my codes? Looking forward for your help :)
Hi Joe,
The find_fisher_stats, fisher_stats, and mean_vector functions don't seem to be calculating Fisher k (kappa) or the mean vector of a group of poles correctly where the group of poles includes orientations which cross a dip=90°.
For example, the Fisher K and mean vector for this group of poles is correct. Calculated mean dip is 50°, Fisher K is 50.
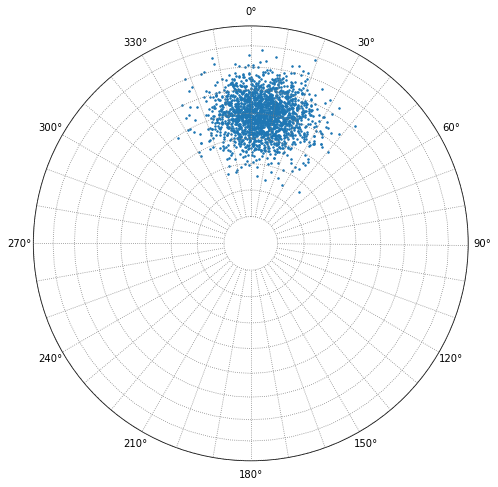
But, for this example the distribution has an actual Fisher k value of 25 and a mean dip of 85°, but the calculated kappa is 1.6 and the calculated mean dip is 62°.
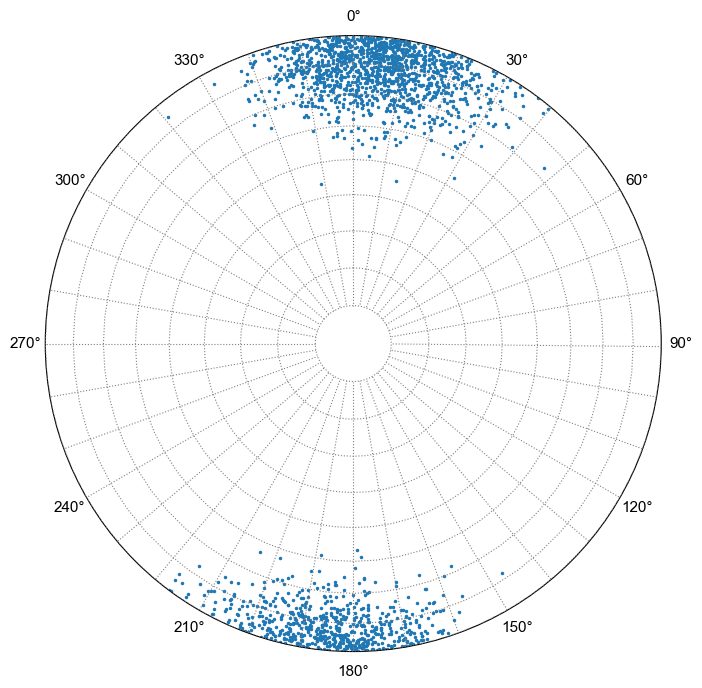
I think the issue is the lines of code where you take the mean of the vectors.
xyz = np.vstack(xyz).T
mean_vec = xyz.mean(axis=0)
When the largest eigenvalue flips direction, just taking the mean gives you a bad result.
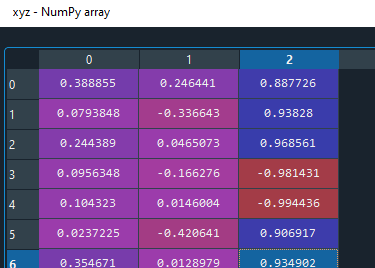
As a hack/workaround, I think you can do something like flip the normals so they all point in the same direction:
le = np.argmax(np.max(np.abs(xyz), axis=0)) # largest eigenvalue is the one we should normalize the others by
cond = xyz[:,le]<0
xyz = np.where(cond[:,None],xyz*-1,xyz)
But I bet you can come up with a better solution. This library is awesome, thanks for all your work on it!
There are two related issues:
(1) I just realize test_examples.py seems to be not comparing the golden files with the example outputs. For example, if you replace basic_01.png with a different picure but with the same name, it will still pass the tests. I believe there's a typo in the similar_images() function, in line 40 of test_examples.py:
new_image = orig_image.convert('RGB')
should be
new_image = new_image.convert('RGB')
(2) However after correcting this, now I can't pass the test for most existing examples. I tried the first two existing examples, and my image outputs are virtually the same as the golden files - except some minor difference in pixels around the texts, which is only visible when I subtract the two images. Also, some existing examples can actaully pass the test by setting a larger tolerance in similar_images(), like 1.0e-2. But not all examples.
I wonder if my problem in (2) can be replicated? Thanks
When plotting series of two poles using ax.pole, the resulting plot includes a number of additional points joining the two expected points.
I reproduced the issue in the following code:
fig = plt.figure(figsize=(7,7))
ax = fig.add_subplot(111, projection='stereonet')
strike = [200, 250]
dip = [50, 60]
ax.pole(strike, dip, 'go', markersize=10)
ax.grid()
plt.show()
The following figure was created:

To be noted: the same issue does not occur when using ax.line
I looked into stereonet_axes.pole and stereonet_math.pole and did not find the reason for this behaviour.
There is an error related to numpy that has removed the attribute 'float'. Probably just substituting for np.float64 suffice.
/usr/local/lib/python3.8/dist-packages/mplstereonet/stereonet_axes.py in plane(self, strike, dip, *args, **kwargs)
423 segments = kwargs.pop('segments', 100)
424 center = self._center_latitude, self._center_longitude
--> 425 lon, lat = stereonet_math.plane(strike, dip, segments, center)
426 return self.plot(lon, lat, *args, **kwargs)
427
/usr/local/lib/python3.8/dist-packages/mplstereonet/stereonet_math.py in plane(strike, dip, segments, center)
158 lon0, lat0 = center
159 strikes, dips = np.atleast_1d(strike, dip)
--> 160 lons = np.zeros((segments, strikes.size), dtype=np.float)
161 lats = lons.copy()
162 for i, (strike, dip) in enumerate(zip(strikes, dips)):
/usr/local/lib/python3.8/dist-packages/numpy/init.py in getattr(attr)
282 return Tester
283
--> 284 raise AttributeError("module {!r} has no attribute "
285 "{!r}".format(name, attr))
286
AttributeError: module 'numpy' has no attribute 'float'
thanks,
mauro
I noticed this issue when trying to plot with a polar grid overlay.
import matplotlib.pyplot as plt
import mplstereonet

fig, ax = mplstereonet.subplots()
strikes = [230,344,20,192,260,333,244,264,190,328,327,118,66,220,95,334,270]
dips = [65,83,45,45,50,84,48,84,45,85,70,40,63,72,60,65,72]
cax = ax.density_contourf(strikes, dips, measurement='poles')

ax.pole(strikes, dips)
ax.grid(kind='polar')
fig.colorbar(cax)

plt.show()


I have been using your polar grid stereonet feature and it works perfectly, however I have a black grid overlay on top of the stereonet which draws four lines from the center of the stereonet at 0, 90, 180 and 270 degrees. Because of this, the appearance of the non-linear lines become clear. Right now I would like to report that one of the polar grid lines do not display properly.
Let's take your polar overlay example for demonstration, located at your github repository
When executing the program, I have drawn two lines that represent the x and y axis going through the center point. Here is a drawing of it,

From the image we can see the straight line is slight above the dotted line.
From what I can see so far, all other lines are fine.
I will begin to solve this problem now and if I solve it, a pull request will be made.
Is it possible that the R-Values are all too low or that there are different ways of estimating it? Concerning this line:
Calculating np.linalg.norm() of the mean vector seems to already be the R-Value, as it is a number smaller but close to 1. Dividing by the shape would only seem necessary if the vector were much larger than 1. Using 10 vectors, the additional factor yields a r-value that is 1/10th of what I get when calculating it by hand or another program:
Using the following linears:
dip = [37, 45, 41, 43, 39, 43, 45, 40, 37, 39]
azimuth = [88, 89, 70, 77, 89, 85, 78, 70, 75, 77]
np.linalg.norm(mean_vec) gives 0.9944 and divided by the shape (=10) yields 0.09944.
欢迎加入深度学习双目视觉,群聊号码:1018698420
When I run the basic example from the README, I get this output:
I've used mplstereonet in the past and really like it, but haven't been able to get it working yet on my new mac. Right now I'm using a virtualenv with this setup setup:
(sci)jhamon@garnet $ yolk -l
Python          - 2.7.2        - active development (/System/Library/Frameworks/Python.framework/Versions/2.7/lib/python2.7/lib-dynload)
matplotlib      - 1.2.0        - active
mplstereonet    - 0.2          - active
numpy           - 1.6.2        - active
pip             - 1.2.1        - active
setuptools      - 0.6c11       - active
wsgiref         - 0.1.2        - active development (/System/Library/Frameworks/Python.framework/Versions/2.7/lib/python2.7)
yolk            - 0.4.3        - active

(sci)jhamon@garnet $ python -V
Python 2.7.2
Any thoughts?
Hey @joferkington,
I was going to create some stereoplots with mplstereonet but when trying to run the example I got the following error: TypeError: tuple indices must be integers or slices, not tuple. Is that a known issue? I attached an image of the code, also with the current versions of matplotlib and mplstereonet. It seems to be related to matplotlib I guess.
Thanks for your help.

In contouring.py I believe
line 39
totals[i] = (density.sum() - 0.5) / scale
should be
totals[i] = density.sum() / scale
https://github.com/vollmerf/spherecontour/blob/main/ERRATA.md
Regards
Everytime I plot stereograms, when plotting grid, default grid lines are spaced for every 30 degrees (like below):

Any suggestion on how to make it spaced every 10 degrees?
While running analysis.kmeans(), I got the following error:
TypeError: ufunc 'isfinite' not supported for the input types, and the inputs could not be safely coerced to any supported types according to the casting rule ''safe''
I believe this is due to the fact that the variable centers is a zip object (at least in Python 3), rather than a list or Numpy array.
Replacing this line will do the trick:
centers = np.column_stack((center_lon, center_lat));A declarative, efficient, and flexible JavaScript library for building user interfaces.
🖖 Vue.js is a progressive, incrementally-adoptable JavaScript framework for building UI on the web.
TypeScript is a superset of JavaScript that compiles to clean JavaScript output.
An Open Source Machine Learning Framework for Everyone
The Web framework for perfectionists with deadlines.
A PHP framework for web artisans
Bring data to life with SVG, Canvas and HTML. 📊📈🎉
JavaScript (JS) is a lightweight interpreted programming language with first-class functions.
Some thing interesting about web. New door for the world.
A server is a program made to process requests and deliver data to clients.
Machine learning is a way of modeling and interpreting data that allows a piece of software to respond intelligently.
Some thing interesting about visualization, use data art
Some thing interesting about game, make everyone happy.
We are working to build community through open source technology. NB: members must have two-factor auth.
Open source projects and samples from Microsoft.
Google ❤️ Open Source for everyone.
Alibaba Open Source for everyone
Data-Driven Documents codes.
China tencent open source team.
