ExoplanetPy is a python package for modelling the transit light curves of systems with multiple exoplanets orbiting around their host stars.
To obtain transit curves, set up the Keplerian orbital elements for each planet in the system.

The Planet() class handles each planet's orbital elements, and the System() class can be used to plot the final transit curves.
The following orbital elements are set up:
- e: eccentricity
- a: semi-major axis
- omega: argument of periapsis (ω)
- Omega: longitude of ascending node (Ω)
- i: orbital inclination
- r_p: planet:star radius
Each Planet() can have different initial true anomaly (ν) values, varied by the first_periastron time argument.
Installation is recommended via pip for Python 3.
pip install exoplanetpyThe package can then be imported using:
import ExoplanetPyAccess the modules using the following statements.
from ExoplanetPy import Planet
from ExoplanetPy import SystemDefine a single Planet() and input as planet_list argument in System().
Limb darkening models are chosen in the plot() method.
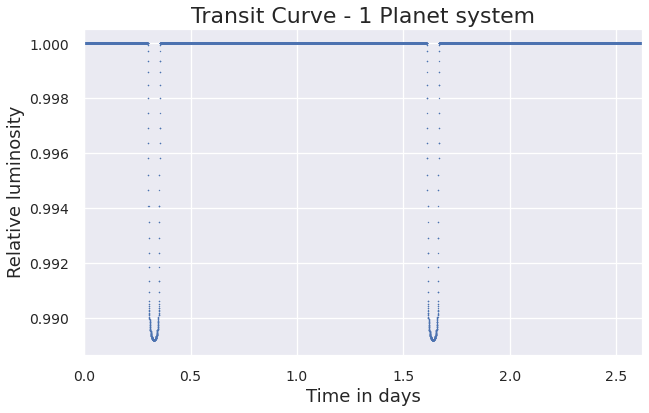
p1 = Planet(e=0.0, a=8, omega=0, Omega=0, i=89.9, r_p=0.1, first_periastron=0.0)
sys = System(star_prop={'Mass': 4}, planet_list=[p1], sort=True)
sys.plot(model='Quadratic', normalise=True)
Additional Planet() objects are inputted as planet_list argument in System().
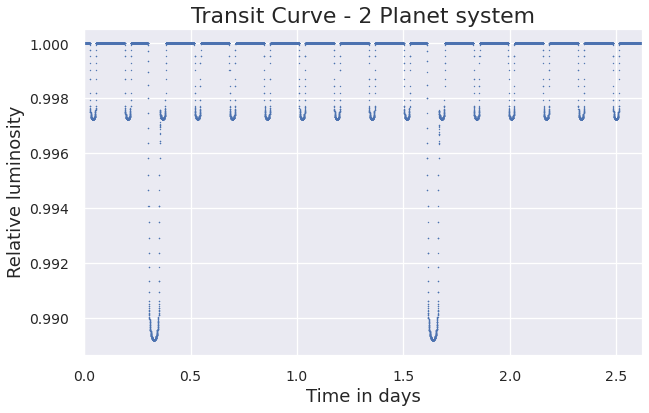
p1 = Planet(e=0.0, a=8, omega=0, Omega=0, i=89.9, r_p=0.1, first_periastron=0.0)
p2 = Planet(e=0.0, a=2, omega=0, Omega=0, i=89.9, r_p=0.05, first_periastron=0.0)
sys = System(star_prop={'Mass': 4}, planet_list=[p1,p2], sort=True)
sys.plot(model='Quadratic', normalise=True)Take the following planetary system:
p1 = Planet(e=0.0, a=8, omega=0, Omega=0, i=89, r_p=0.1, first_periastron=0.03)
p2 = Planet(e=0.0, a=4, omega=0, Omega=0, i=89, r_p=0.07, first_periastron=0.52)
p3 = Planet(e=0.0, a=2, omega=0, Omega=0, i=87, r_p=0.05, first_periastron=0.0)
sys = System(star_prop={'Mass': 4}, planet_list=[p1, p3, p2], sort=True)
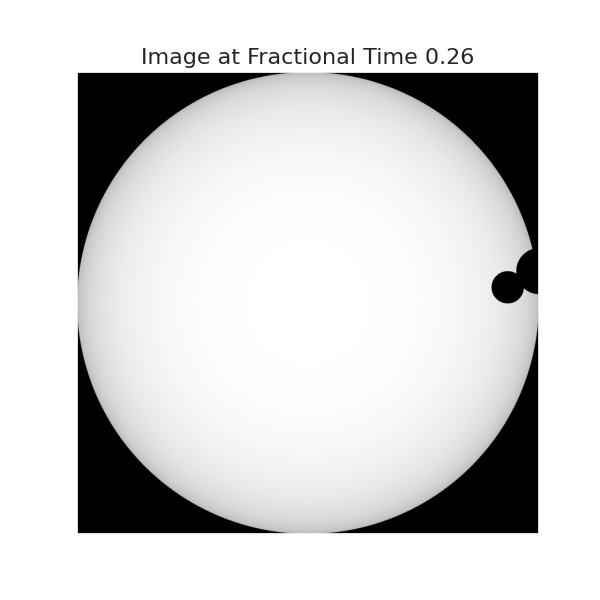
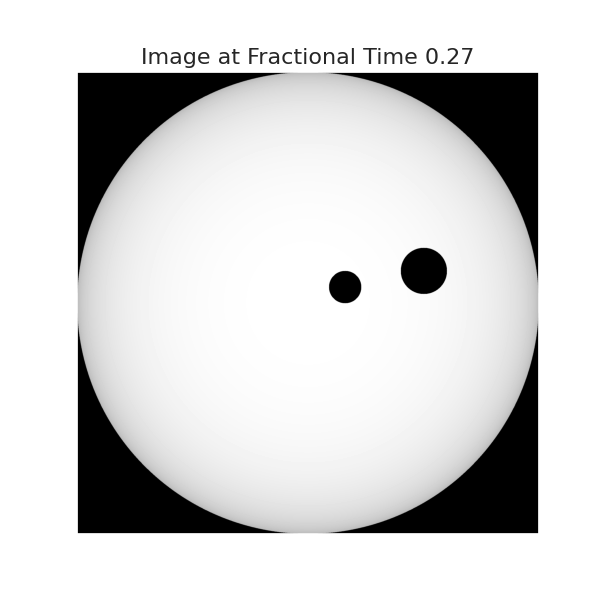
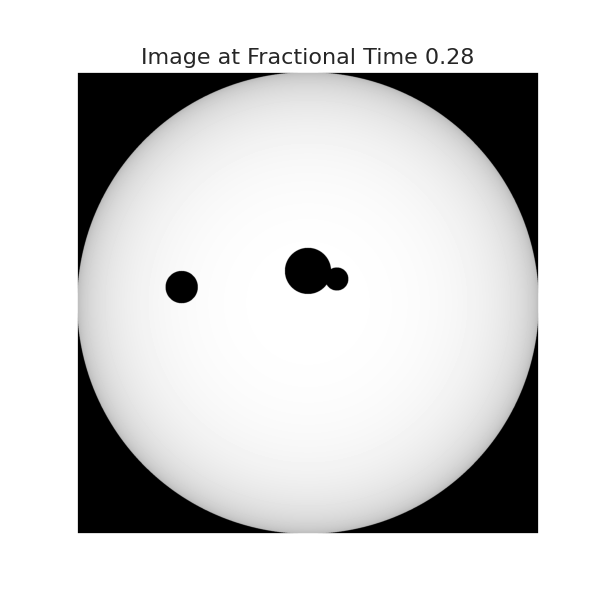
The visualize() method allows the user to obtain visual images of the actual transit.
sys.visualize(time=0.26, model='Quadratic')Changing the fractional time parameter allows the user to obtain images at any point during transit.
sys.visualize(time=0.27, model='Quadratic')Similarly, for time = 0.28:
sys.visualize(time=0.28, model='Quadratic')ExoplanetPy has the following dependencies:
- NumPy
- SciPy
- Matplotlib (produce plots)
- Seaborn (stylize plots)
MIT License
© 2020 ExoplanetPy

