Giter Club home page Giter Club logo

graphview's Introduction

Chart and Graph Library for Android

Project maintainer wanted! For time reasons I can not continue to maintain GraphView. Contact me if you are interested and serious about this project. [email protected]

What is GraphView

GraphView is a library for Android to programmatically create flexible and nice-looking diagrams. It is easy to understand, to integrate and to customize.

Supported graph types:

  • Line Graphs
  • Bar Graphs
  • Point Graphs
  • or implement your own custom types.

Top Features

  • Line Chart, Bar Chart, Points
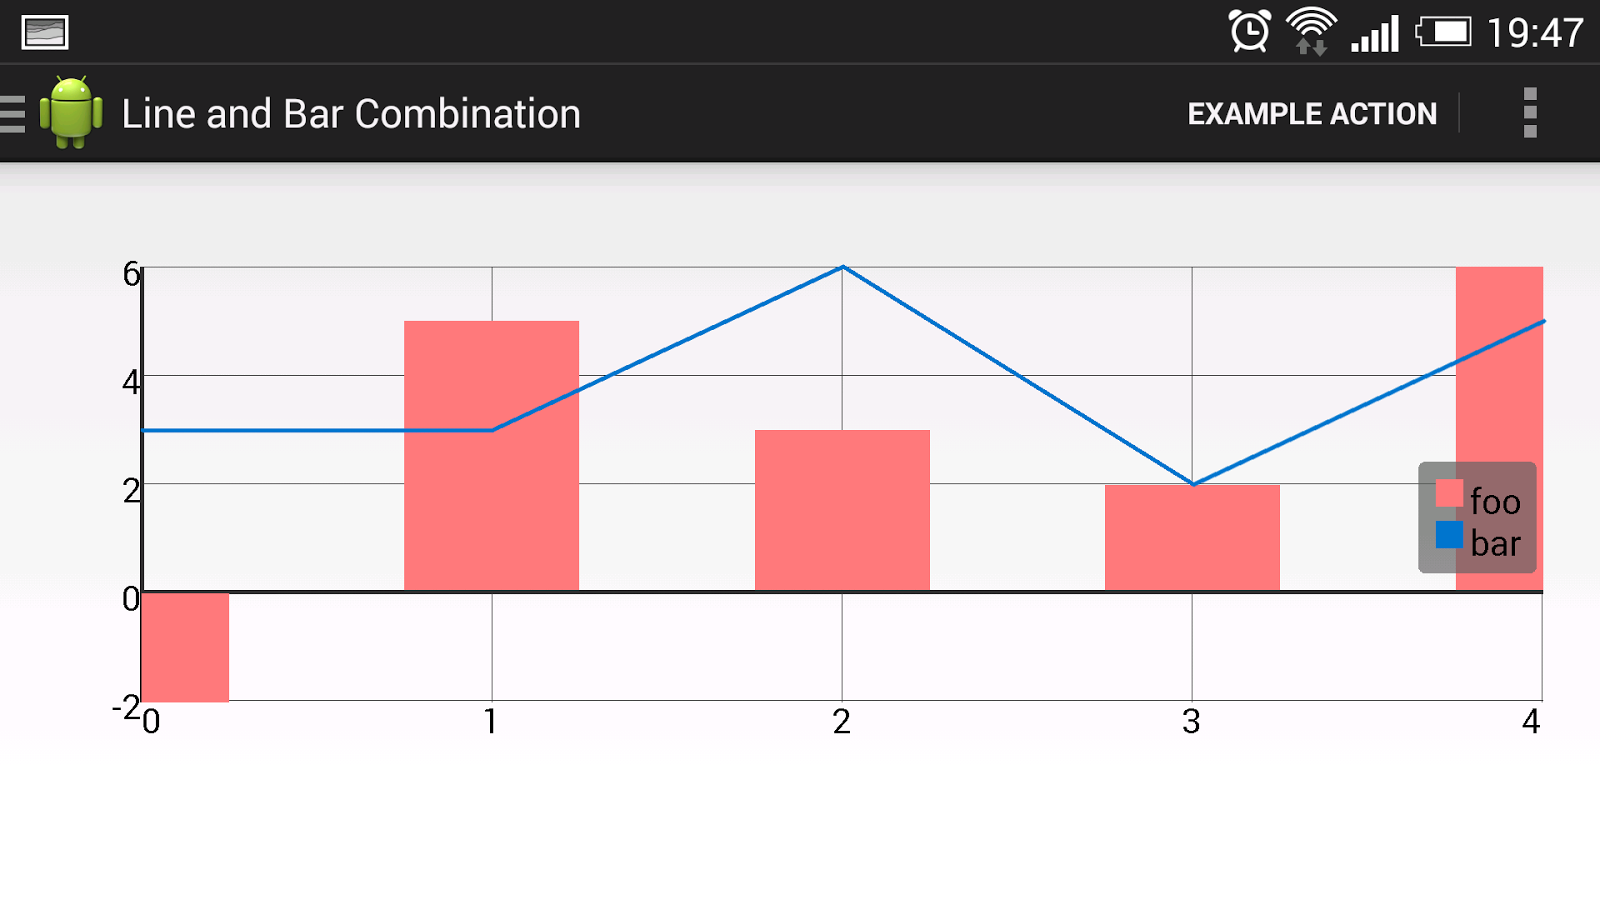
  • Combination of different graph types
  • Scrolling vertical and horizontal . You can scroll with a finger touch move gesture.
  • Scaling / Zooming vertical and horizontal . With two-fingers touch scale gesture (Multi-touch), the viewport can be changed.
  • Realtime Graph (Live change of data)
  • Second scale axis
  • Draw multiple series of data . Let the diagram show more that one series in a graph. You can set a color and a description for every series.
  • Show legend . A legend can be displayed inline the chart. You can set the width and the vertical align (top, middle, bottom).
  • Custom labels . The labels for the x- and y-axis are generated automatically. But you can set your own labels, Strings are possible.
  • Handle incomplete data . It's possible to give the data in different frequency.
  • Viewport . You can limit the viewport so that only a part of the data will be displayed.
  • Manual Y axis limits
  • And much more... Check out the project page and/or the demo app

How to use

  1. Add gradle dependency:
implementation 'com.jjoe64:graphview:4.2.2'
  1. Add view to layout:
<com.jjoe64.graphview.GraphView
        android:layout_width="match_parent"
        android:layout_height="200dip"
        android:id="@+id/graph" />
  1. Add some data:
GraphView graph = (GraphView) findViewById(R.id.graph);
LineGraphSeries<DataPoint> series = new LineGraphSeries<DataPoint>(new DataPoint[] {
          new DataPoint(0, 1),
          new DataPoint(1, 5),
          new DataPoint(2, 3),
          new DataPoint(3, 2),
          new DataPoint(4, 6)
});
graph.addSeries(series);

Download Demo project at Google Play Store


Showcase GraphView Demo App

More examples and documentation

Get started at project wiki homepage

To show you how to integrate the library into an existing project see the GraphView-Demos project! See GraphView-Demos for examples. https://github.com/jjoe64/GraphView-Demos
View GraphView wiki page https://github.com/jjoe64/GraphView/wiki

graphview's People

Contributors

alsafer avatar amuhebwa avatar b4nnertail avatar blizzard4591 avatar cincodenada avatar ddrboxman avatar dektar avatar eziosoft avatar frhun avatar ggounot avatar gnichola avatar gscuster avatar gsurrel avatar ionut-damian avatar janseeger avatar jjoe64 avatar jwhong avatar kamaltmo avatar lauszus avatar lenamuit avatar marcdahlem avatar marcoincalcaterra avatar mfgmfg avatar moallemi avatar pm-coffee avatar pontomedon avatar rorold avatar shubhamshuklaer avatar tdevinda avatar updateing avatar

Stargazers

 avatar  avatar  avatar  avatar  avatar  avatar  avatar  avatar  avatar  avatar  avatar  avatar  avatar  avatar  avatar  avatar  avatar  avatar  avatar  avatar  avatar  avatar  avatar  avatar  avatar  avatar  avatar  avatar  avatar  avatar  avatar  avatar  avatar  avatar  avatar  avatar  avatar  avatar  avatar  avatar  avatar  avatar  avatar  avatar  avatar  avatar  avatar  avatar  avatar  avatar  avatar  avatar  avatar  avatar  avatar  avatar  avatar  avatar  avatar  avatar  avatar  avatar  avatar  avatar  avatar  avatar  avatar  avatar  avatar  avatar  avatar  avatar  avatar  avatar  avatar  avatar  avatar  avatar  avatar  avatar  avatar  avatar  avatar  avatar  avatar  avatar  avatar  avatar  avatar  avatar  avatar  avatar  avatar  avatar  avatar  avatar  avatar  avatar  avatar  avatar

Watchers

 avatar  avatar  avatar  avatar  avatar  avatar  avatar  avatar  avatar  avatar  avatar  avatar  avatar  avatar  avatar  avatar  avatar  avatar  avatar  avatar  avatar  avatar  avatar  avatar  avatar  avatar  avatar  avatar  avatar  avatar  avatar  avatar  avatar  avatar  avatar  avatar  avatar  avatar  avatar  avatar  avatar  avatar  avatar  avatar  avatar  avatar  avatar  avatar  avatar  avatar  avatar  avatar  avatar  avatar  avatar  avatar  avatar  avatar  avatar  avatar  avatar  avatar  avatar  avatar  avatar  avatar  avatar  avatar  avatar  avatar  avatar  avatar  avatar  avatar  avatar  avatar  avatar  avatar  avatar  avatar  avatar  avatar  avatar  avatar  avatar  avatar  avatar  avatar  avatar  avatar  avatar  avatar  avatar  avatar  avatar  avatar  avatar  avatar  avatar  avatar

graphview's Issues

Real time graph on Android API 16 no scrolling to end, no drawing of the graph

Hi,

like I wrote you on google+ was the graphview not updating when adding data in realtime.
The android version used was 4.1.1 on a Samsung Galaxy S3 LTE.

I tested it now with the emulator on the versions 2.3.3 (API 10), 4.0.3 (API 15) and 4.2 (API 17): On this APIs is the graph updated like expected.

Only when running a emulater with API 16 (4.1.2) or the phone (4.1.1) is the graph not drawn.

The strange thing is, that it is updating the labels on the y axis (but not on the x), and thereby not drawing the graph. It updates the graph as soon as one clicks on it.

Attached are pictures that show the graph before (output) and after clicking (expected output).

\BR
Marc
output
output_expected

Feature Request: onClick handler for nodes/ bars?

GraphView looks great; the only thing I think may be missing for my use case would be a click handler, e.g. so I can tap a point on a line chart and get a pop-up with more details. I know detecting tap is tricky when you're handling onTouchEvent, but I thought I'd put a request in.

I'll probably try (another o/s android chart lib) first, and if I don't like it I may come back and fork GraphView and try to add the feature.

Thanks!

When piching to zoom is released, viewport changes (jumps a bit to the left/right).

Like the topic states, when piching to zoom is released, viewport moves a bit to the right or left. When dealing with a large set of values, and zoomed in too much, that could be disturbing.

Video of the problem:
https://www.youtube.com/watch?v=OfdQdeiEAU0

A user named @Lauszus posted a possible source of problem since one of commits:
#71 (comment)

I Quote:"I believe I had the same problem with the viewport jumping around after this commit: ba7ed0f, so I'm actually using an older version for my app right now"

hardware acceleration

Hi

The library is useful but it only works if hardware acceleration is turned off (on 4.0+). However that also makes it quite slow for what we are trying to do.

Is it possible for you to add hardware acceleration support so it works when GPU acceleration is turned on?

Best regards,
PA

Patch: Method to remove all series

Hello, I did not find any method to remove all series, kind of to reset the chart, so I wrote one. It is trivial, but very useful:

public void removeAllSeries()
{
  for (int i = 0; i < graphSeries.size(); i++)
    graphSeries.remove(i);
}

in GraphView.java

Android 4 not scaling

I had a problem in Android 4 it wasn't smooth scaling. It would only update the screen once I lift my fingers.

A quick fix was in GraphView.java.
Comment out "scaleDetector.isInProgress()" like so:

if (scalable && scaleDetector != null) {
scaleDetector.onTouchEvent(event);
handled = false;//scaleDetector.isInProgress();
}

It now scales and zooms at the same time but that's only a plus for me :)

Wrong naming of horizontal/vertial lines/labels

Hi,

are you sure that line 81-88 in GraphView create the vertical lines and 90-103 the horizontal lines? Seems to be other way round...

Therefore the methods which load the labels and the variables horlabels and verlabels are swapped.

Line disapears when scrolling on Y=0

Hi, first of all thanks for the great library!
Am having a problem when scrolling over a series that has a subserie that has Y=0 values. When all the values visible on the viewport are Y=0 line disapears. Scrolling back/forward (where Y > 0) line gets drawn again. Haven't been able to fix it myself :/
Maybe this is releted to #29
Thanks for the help!

todo: zoom out limit

if you zoom out too wide, the graph jumps from the left to the right corner and vise versa. And sometimes to graph isn't visible anymore...

Crash if an empty array is passed in

I can handle the empty check myself, but it might be a good case to check for.

The error happens on this line in GraphView

            highest = values[values.length-1].valueX;

Stack trace:

java.lang.ArrayIndexOutOfBoundsException: length=0; index=-1
E/AndroidRuntime(31521): at com.jjoe64.graphview.GraphView.getMaxX(GraphView.java:469)
E/AndroidRuntime(31521): at com.jjoe64.graphview.GraphView$GraphViewContentView.onDraw(GraphView.java:67)
E/AndroidRuntime(31521): at android.view.View.draw(View.java:13458)
E/AndroidRuntime(31521): at android.view.View.draw(View.java:13342)
E/AndroidRuntime(31521): at android.view.ViewGroup.drawChild(ViewGroup.java:2929)
E/AndroidRuntime(31521): at android.view.ViewGroup.dispatchDraw(ViewGroup.java:2799)
E/AndroidRuntime(31521): at android.view.View.draw(View.java:13340)
E/AndroidRuntime(31521): at android.view.ViewGroup.drawChild(ViewGroup.java:2929)
E/AndroidRuntime(31521): at android.view.ViewGroup.dispatchDraw(ViewGroup.java:2799)
E/AndroidRuntime(31521): at android.view.View.draw(View.java:13340)
E/AndroidRuntime(31521): at android.view.ViewGroup.drawChild(ViewGroup.java:2929)
E/AndroidRuntime(31521): at android.view.ViewGroup.dispatchDraw(ViewGroup.java:2799)
E/AndroidRuntime(31521): at android.view.View.draw(View.java:13340)
E/AndroidRuntime(31521): at android.view.ViewGroup.drawChild(ViewGroup.java:2929)
E/AndroidRuntime(31521): at android.view.ViewGroup.dispatchDraw(ViewGroup.java:2799)
E/AndroidRuntime(31521): at android.view.View.draw(View.java:13340)
E/AndroidRuntime(31521): at android.view.ViewGroup.drawChild(ViewGroup.java:2929)
E/AndroidRuntime(31521): at android.view.ViewGroup.dispatchDraw(ViewGroup.java:2799)
E/AndroidRuntime(31521): at android.view.View.draw(View.java:13461)
E/AndroidRuntime(31521): at android.widget.FrameLayout.draw(FrameLayout.java:467)
E/AndroidRuntime(31521): at com.android.internal.policy.impl.PhoneWindow$DecorView.draw(PhoneWindow.java:2183)
E/AndroidRuntime(31521): at android.view.ViewRootImpl.drawSoftware(ViewRootImpl.java:2256)
E/AndroidRuntime(31521): at android.view.ViewRootImpl.draw(ViewRootImpl.java:2151)
E/AndroidRuntime(31521): at android.view.ViewRootImpl.performDraw(ViewRootImpl.java:2019)
E/AndroidRuntime(31521): at android.view.ViewRootImpl.performTraversals(ViewRootImpl.java:1830)
E/AndroidRuntime(31521): at android.view.ViewRootImpl.doTraversal(ViewRootImpl.java:998)
E/AndroidRuntime(31521): at android.view.ViewRootImpl$TraversalRunnable.run(ViewRootImpl.java:4212)
E/AndroidRuntime(31521): at android.view.Choreographer$CallbackRecord.run(Choreographer.java:725)
E/AndroidRuntime(31521): at android.view.Choreographer.doCallbacks(Choreographer.java:555)
E/AndroidRuntime(31521): at android.view.Choreographer.doFrame(Choreographer.java:525)
E/AndroidRuntime(31521): at android.view.Choreographer$FrameDisplayEventReceiver.run(Choreographer.java:711)
E/AndroidRuntime(31521): at android.os.Handler.handleCallback(Handler.java:615)
E/AndroidRuntime(31521): at android.os.Handler.dispatchMessage(Handler.java:92)
E/AndroidRuntime(31521): at android.os.Looper.loop(Looper.java:137)
E/AndroidRuntime(31521): at android.app.ActivityThread.main(ActivityThread.java:4745)
E/AndroidRuntime(31521): at java.lang.reflect.Method.invokeNative(Native Method)
E/AndroidRuntime(31521): at java.lang.reflect.Method.invoke(Method.java:511)
E/AndroidRuntime(31521): at com.android.internal.os.ZygoteInit$MethodAndArgsCaller.run(ZygoteInit.java:786)
E/AndroidRuntime(31521): at com.android.internal.os.ZygoteInit.main(ZygoteInit.java:553)
E/AndroidRuntime(31521): at dalvik.system.NativeStart.main(Native Method)

getMinX(), getMaxX(), getMinY() and getMaxY() should not be private

Hi!

Great library, really easy to use and very nice code!

I wanted to fix min and max Y, but manual method was not good enough. In my case, I wanted maxY to be at least 20, but more if the values are higher than that. Overriding getMaxY() fixed a problem for me, but I had to change function modifier from private to protected.

Any chance you could change that in core?

Add a setTextColor()

there is a method graphView.setBackgroundColor();
but no graphView.setTextColor(Color.BLACK) so there are no labels if the background is white.

BarGraphView

Hello. I have some issues with BarGraphView; (vertical lines count and barwidth)

There are quick fixes:

//BarGraphView.java
//float colwidth = (graphwidth - (2 * border)) / values.length;
float colwidth = graphwidth / values.length;

//GraphView.java
// horizontal labels + lines
int hors = horlabels.length;
for (int i = 0; i <= horlabels.length; i++) {
paint.setColor(Color.DKGRAY);
float x = ((graphwidth / hors) * i) + horstart;
canvas.drawLine(x, height - border, x, border, paint);
paint.setTextAlign(Align.CENTER);
if (i < horlabels.length) {
paint.setColor(Color.WHITE);
canvas.drawText(horlabels[i], x + (graphwidth / hors) / 2, height - 4, paint);
}
}

Values on the top of bar Graph

public class MyBarGraphView extends GraphView {
public MyBarGraphView(Context context, String title) {
super(context, title);
}

@Override
public void drawSeries(Canvas canvas, GraphViewData[] values, float graphwidth, float graphheight,
        float border, double minX, double minY, double diffX, double diffY,
        float horstart) {
    float colwidth = (graphwidth - (2 * border)) / values.length;

    // draw data
    for (int i = 0; i < values.length; i++) {
        float valY = (float) (values[i].valueY - minY);
        float ratY = (float) (valY / diffY);
        float y = graphheight * ratY;

        canvas.drawRect((i * colwidth) + horstart, (border - y) + graphheight, ((i * colwidth) + horstart) + (colwidth - 1), graphheight + border - 1, paint);

        int tmpColor = paint.getColor();
        // -----Set values on top of graph---------
        paint.setTextAlign(Align.LEFT);
        paint.setColor(Color.rgb(255, 255, 255));
        float margin = -4;
        if (y+12>=graphheight) margin=12;
        canvas.drawText(String.valueOf(values[i].valueY), (i * colwidth) + horstart+3, (border - y) + graphheight+margin, paint);
        paint.setColor(tmpColor);
    }
}

}

Here I am outputing values of bars with white color. "margin" is variable for cases when bar fills all bar height - than I need to output text inside of a bar, not on the top.

Antialiasing, maybe?

Is there any chance to make the charts more.... soft? The lines are heavily pixelated, and it just looks..... cheap :S
If they were more high-res, or antialiased - that would make this library the bomb! :)

helper contructors to simply create graphs with string labels

So that the developer could use it like that:

// x value as string
new GraphViewData("monday", 44), new GraphViewData("tuesday", 32), new GraphViewData("wednesday", 44)

// or y value as string
new GraphViewData(44, "monday"), new GraphViewData(32, "tuesday"), new GraphViewData(44, "wednesday")

No Line displayed

Hi,

First of all: Thank's for this useful code!

I have issues with LineGraphView when all the y values are the same, like this:

iSerie = new GraphViewData[] {
new GraphViewData(1, 1400000)
, new GraphViewData(2, 1400000)
, new GraphViewData(3, 1400000)
, new GraphViewData(4, 1400000) };

In this case: no line are showed :(

The area under a LineGraph is not filled in a proper way

If I'm filling the area under a line graph with a different color than the hardcoded one - especially bright ones - the area isn't drawn proper. I think the algorithm for drawSeries(...) in LineGraphView needs to be recoded.

screenshot

I want use dates in X variable. How can I do it?

instead of representing data of the form (1, 3) (2.8) (3.43), I want to paint the form data (21/12/12, 3), (22/12/12, 8) (12/23/12, 43). I tried to use the date format of milliseconds elapsed since 1970, but when I zoom or when I change the viewport does not work well. Any suggestions or an example? Thank you very much. greetings

Tiny Bar in BarChartGraph

SC20121224-002146
Hi everyone!

I've a problem about Bar in BarChartGraph. I push a 33-elements array but char are smaller of the entire graph, in the graph remain a no used space.

I attached an image.

This is the XML code:

 <?xml version="1.0" encoding="utf-8"?>
   <ScrollView xmlns:android="http://schemas.android.com/apk/res/android"
android:layout_width="fill_parent"
android:layout_height="fill_parent">

         <LinearLayout xmlns:android="http://schemas.android.com/apk/res/android"
    android:layout_width="fill_parent"
    android:layout_height="fill_parent"
    android:orientation="vertical">

    <TextView android:layout_width="wrap_content" 
        android:layout_height="wrap_content" 
        android:id="@+id/txtX" 
        android:text="X: 0" 
        android:textSize="15sp"></TextView>

    <TextView
        android:id="@+id/txtZ"
        android:layout_width="wrap_content"
        android:layout_height="wrap_content"
        android:layout_marginTop="39dp"
        android:text="Z: 0"
        android:textSize="15sp" />
    [....]

    <EditText
        android:id="@+id/et1"
        android:layout_width="match_parent"
        android:layout_height="wrap_content"
        android:layout_marginTop="39dp"
        android:ems="10"
        android:inputType="textMultiLine"
        android:focusable="false">
    </EditText>

    <LinearLayout xmlns:android="http://schemas.android.com/apk/res/android"
        android:layout_width="wrap_content"
        android:layout_height="250dp"
        android:id="@+id/graph1" />

</LinearLayout> 

And this the code about graph in the main class:

GraphViewData[] data;
GraphView graphView;

 // Inizializzazioni utili per il grafico  
    data = new GraphViewData[(N/2)+1];  // N=64

    graphView = new BarGraphView(this, "example") {  //Prova a mettere primad di questo setHorizontalabe
        @Override
        protected String formatLabel(double value, boolean isValueX) {
            if (isValueX) {
                return Double.toString(value);
            } else return super.formatLabel(value, isValueX); // let the y-value be normal-formatted
           }
        };

  LinearLayout layout = (LinearLayout) findViewById(R.id.graph1);   
  layout.addView(graphView);

    for (int i=0; i<(N/2)+1; i++)
       data[i] = new GraphViewData(i, new_sig[i]);

 graphView.setBackgroundColor(Color.BLACK);

 graphView.addSeries(new GraphViewSeries(data));

 graphView.invalidate();
 graphView.redrawAll();

Thank's a lot for your support!

vertical bar width is too big in big images

I'm trying to get graph with big width (~1500 px) to put em then in horizontal scroll view, and what I see that y-bar width is become so huge that graph become ugly and deformed.

It will be cool also have possibility to disable x,y bars (not only labels, but also space reserved for them).

Configurable text size for axis labels

add public void setTextSize(float value) to GraphView to then use as

paint.setTextSize(textSize);

then client projects can use

res/values/dimensions.xml

14sp

getResources().getDimension(R.dimen.ChartTextSize)

append does no refresh

The android version used was 4.1.1 on a Samsung Galaxy S3 LTE.

I tested it now with the emulator on the versions 2.3.3 (API 10), 4.0.3 (API 15) and 4.2 (API 17): On this APIs is the graph updated like expected.

Only when running a emulater with API 16 (4.1.2) or the phone (4.1.1) is the graph not drawn.

The strange thing is, that it is updating the labels on the y axis (but not on the x), and thereby not drawing the graph. It updates the graph as soon as one clicks on it.

Vertical labels not showing

Problem: Y axis labels aren't showing.

What I found:
Using the debugger, I see that in the following code, numLabels = 0 because graphheight/GraphViewConfig.HORIZONTAL_LABEL_HEIGHT = 71/80, or less than 1. If I hack the library and set GraphViewConfig.HORIZONTAL_LABEL_HEIGHT (which is set to 80 in the library code) to something smaller than 71, the y-axis labels show.

synchronized private String[] generateVerlabels(float graphheight) {
    int numLabels = (int) (graphheight/GraphViewConfig.HORIZONTAL_LABEL_HEIGHT);
    String[] labels = new String[numLabels+1];
    double min = getMinY();
    double max = getMaxY();
    if (max == min) {
        // if min/max is the same, fake it so that we can render a line
        max = max*1.05d;
        min = min*0.95d;
    }

    for (int i=0; i<=numLabels; i++) {
        labels[numLabels-i] = formatLabel(min + ((max-min)*i/numLabels), false);
    }
    return labels;
}

Recommend Projects

  • React photo React

    A declarative, efficient, and flexible JavaScript library for building user interfaces.

  • Vue.js photo Vue.js

    ๐Ÿ–– Vue.js is a progressive, incrementally-adoptable JavaScript framework for building UI on the web.

  • Typescript photo Typescript

    TypeScript is a superset of JavaScript that compiles to clean JavaScript output.

  • TensorFlow photo TensorFlow

    An Open Source Machine Learning Framework for Everyone

  • Django photo Django

    The Web framework for perfectionists with deadlines.

  • D3 photo D3

    Bring data to life with SVG, Canvas and HTML. ๐Ÿ“Š๐Ÿ“ˆ๐ŸŽ‰

Recommend Topics

  • javascript

    JavaScript (JS) is a lightweight interpreted programming language with first-class functions.

  • web

    Some thing interesting about web. New door for the world.

  • server

    A server is a program made to process requests and deliver data to clients.

  • Machine learning

    Machine learning is a way of modeling and interpreting data that allows a piece of software to respond intelligently.

  • Game

    Some thing interesting about game, make everyone happy.

Recommend Org

  • Facebook photo Facebook

    We are working to build community through open source technology. NB: members must have two-factor auth.

  • Microsoft photo Microsoft

    Open source projects and samples from Microsoft.

  • Google photo Google

    Google โค๏ธ Open Source for everyone.

  • D3 photo D3

    Data-Driven Documents codes.