ipyvizzu - Build animated charts in Jupyter Notebook and similar environments with a simple Python syntax
Documentation · Examples · Code reference · Repository
ipyvizzu is an animated charting tool for Jupyter,
Google Colab,
Databricks,
Kaggle and Deepnote
notebooks among other platforms. ipyvizzu enables data scientists and analysts
to utilize animation for storytelling with data using Python. It's built on
the open-source JavaScript/C++ charting library
Vizzu.
There is a new extension of ipyvizzu,
ipyvizzu-story with which the
animated charts can be presented right from the notebooks. Since
ipyvizzu-story's syntax is a bit different to ipyvizzu's, we suggest you to
start from the ipyvizzu-story repo
if you're interested in using animated charts to present your findings live or
to share your presentation as an HTML file.
Similarly to Vizzu, ipyvizzu utilizes a generic dataviz engine that
generates many types of charts and seamlessly animates between them. It is
designed for building animated data stories as it enables showing different
perspectives of the data that the viewers can easily follow.
Main features:
- Designed with animation in focus;
- Defaults based on data visualization guidelines;
- Works with
Pandasdataframe, while alsoJSONand inline data input is available; - Auto scrolling feature to keep the actual chart in position while executing multiple cells.
pip install ipyvizzuVisit Installation chapter for more options and details.
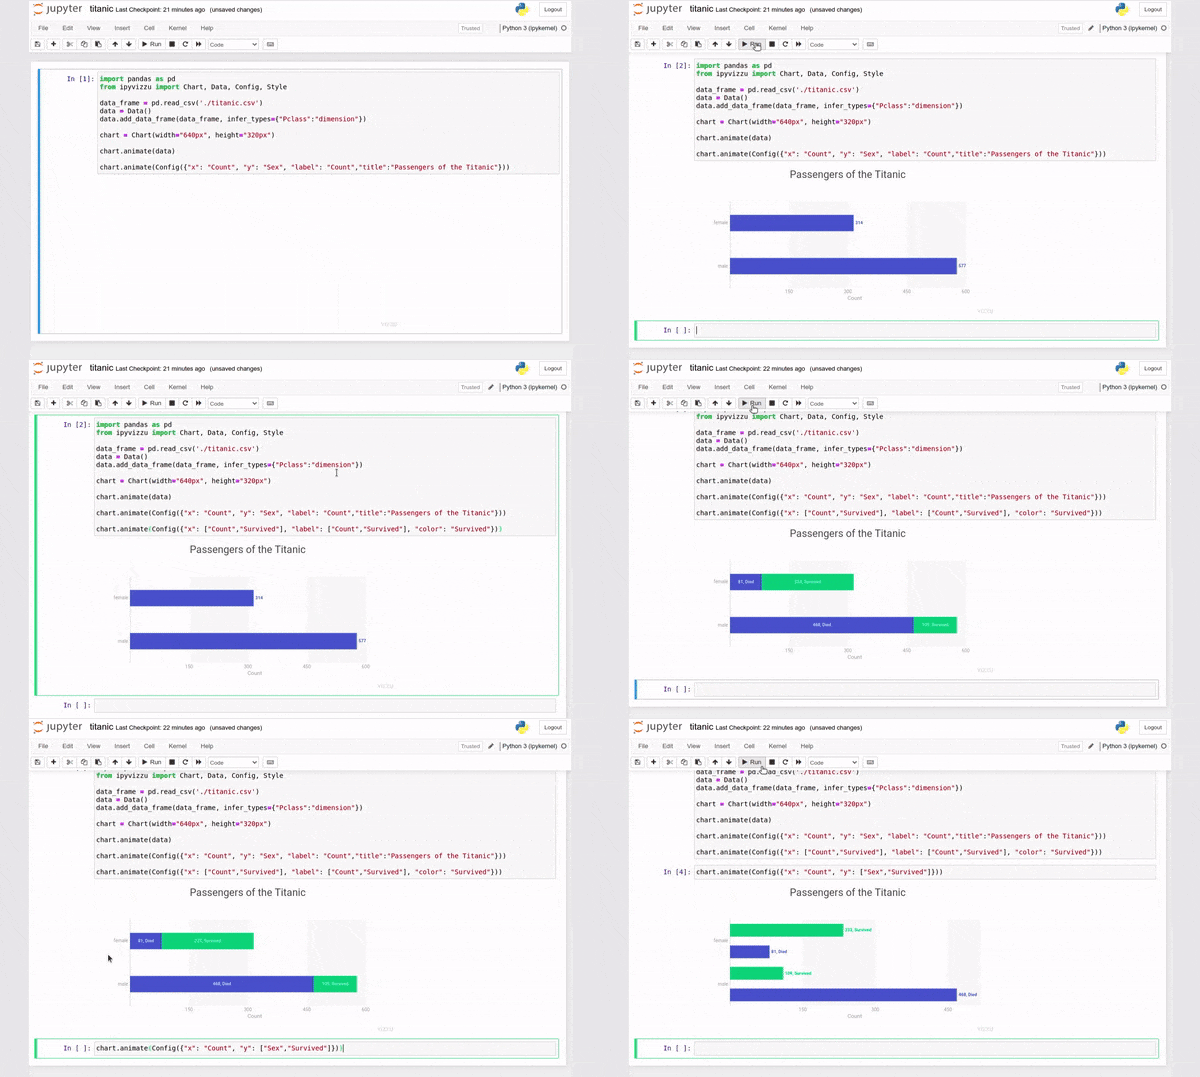
You can create the animation below with the following code snippet.
import pandas as pd
from ipyvizzu import Chart, Data, Config

data_frame = pd.read_csv(
    "https://ipyvizzu.vizzuhq.com/latest/showcases/titanic/titanic.csv"
)
data = Data()
data.add_data_frame(data_frame)

chart = Chart(width="640px", height="360px")

chart.animate(data)

chart.animate(
    Config(
        {
            "x": "Count",
            "y": "Sex",
            "label": "Count",
            "title": "Passengers of the Titanic",
        }
    )
)
chart.animate(
    Config(
        {
            "x": ["Count", "Survived"],
            "label": ["Count", "Survived"],
            "color": "Survived",
        }
    )
)
chart.animate(Config({"x": "Count", "y": ["Sex", "Survived"]}))Visit our Documentation site for more
details and a step-by-step tutorial into ipyvizzu or check out our
Example gallery.
ipyvizzu can be used in a wide variety of environments, visit
Environments chapter for
more details.
- Notebooks
- App platforms
- BI tools
- IDEs
- ipyvizzu-story adds presentation controls to present data stories live or to share them as an interactive HTML file.
We welcome contributions to the project, visit our contributing guide for further info.
- Join our Slack if you have any questions or comments: vizzu-community.slack.com
- Drop us a line at [email protected]
- Follow us on Twitter: VizzuHQ
Copyright © 2022-2023 Vizzu Inc.
Released under the Apache 2.0 License.


