Stock volatility visualization was developed as part of course work (CSE578). The visualization idea is based on Su Te Lei's work and implementation is done using the D3.js library.
http://www.public.asu.edu/~gthopugu/stock_volatility_viz/index.html
The main purpose of this spider visualization is to provide market investors a way to perform sector level volatility analysis by visual exploration.
For this project, historical financial stock market data for two stock market exchanges NYSE and NASDAQ was used. Each exchange has ten sectors
- Basic Materials , Consumer Goods
- Energy , Financials
- Healthcare , Industrial Goods
- Real Estate , Services
- Technology , Utilities.
Stock market data for ten companies trading under each of these sectors were used for the time period of April 4th , 2016 – March 31st , 2017.
Each trading day is represented by a ring and each point represents data of a stock for that day. All points belonging to same stock are joined by a line path indicating its performance progress. The fluctuations of the line path represent the stock’s volatility. The basic idea is to distribute available stocks among 360° of the circle based on their respective performances. The performances, angles of each stock on each day are computed as shown in the following image.
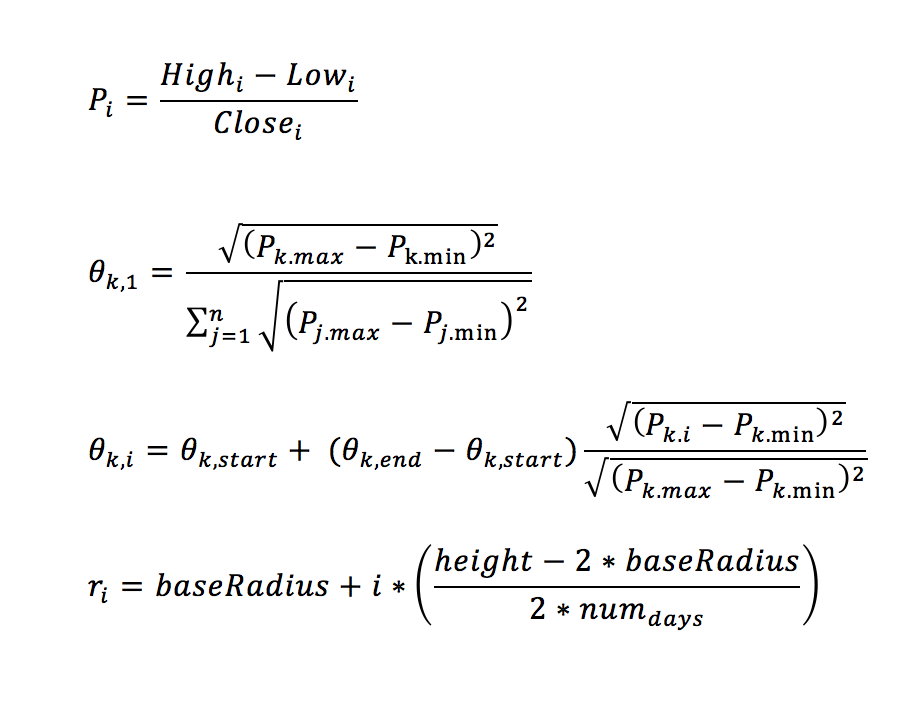
P_i is the performance of stock on ith day. theta_k,1 is the absolute angle of kth stock on day 1 (of selected date range). theta_k,start and theta_k,end are starting and ending angles computed relative to other stocks being visualized within this ring. theta_k,i is the angle of stock k on day i. r_i is the radius of each ring.
- When the user hovers over a point, a tooltip is displayed showing relevant details of trade on a specific day of the specific stock that this point belongs to.
- The entire line path is also highlighted, clearly distinguishing other line paths from the one the user is interested in.
- The users can filter stocks based on minimum performances, change the date ranges being analyzed and switch between sectors.
This visualization uses the following libraries:
- [D3.js] - More power to you!
- [Twitter Bootstrap] - Building beautiful things made easy!
- [jQuery] - Wohoo!
- [daterangepicker] - Works very well as advertised!
- [moment.js] - because JS 'Date'ing is complicated!
The entire logic of the visualization is in the front-end and so, it can be served from any http server you have. For instance, if you have python installed, do the following:
Clone this repository to your local machine,
$ cd stock_volatility_viz
$ python -m SimpleHTTPServer
Fire up your favourite browser (I hope it is not < IE11, please!?) and navigate to http://127.0.0.1:8000 or http://localhost:8000
MIT


