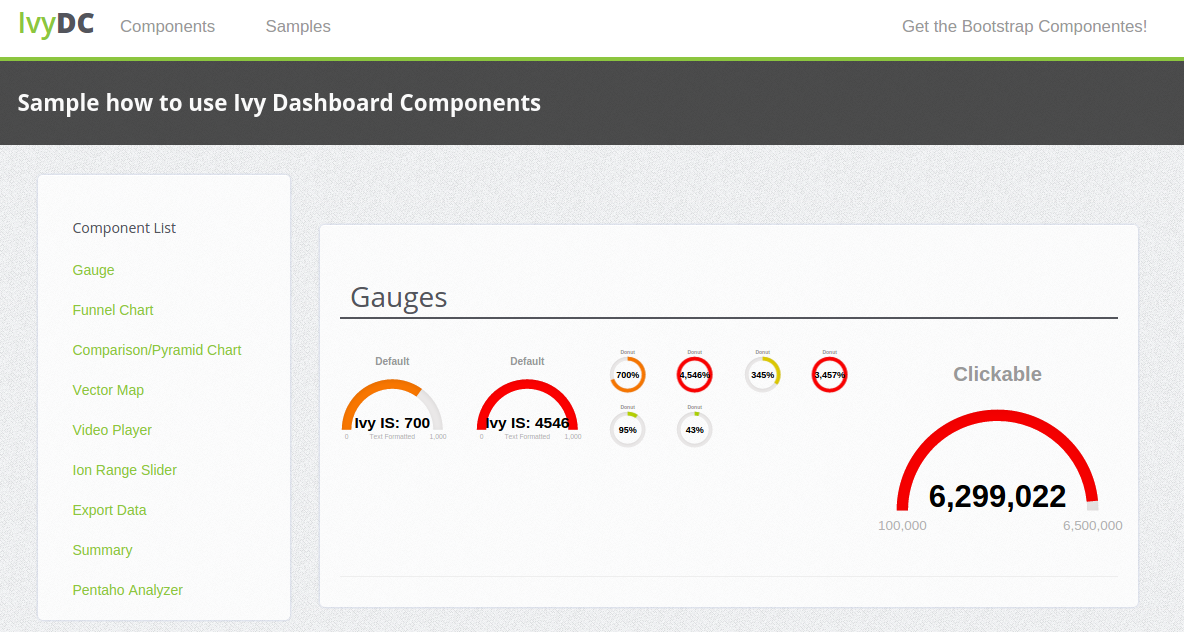
#IvyDC - Ivy Dashboard Components
This is a plugin for Pentaho platform with custom CDE Components to use in your dashboards.
#Some of the features in this 0.0.6 release:
- bugs fixed
#What is the road map for the next version? *
We dare you to improve this plugin with ideias, stars, pull request, ...
#Old Realeases
###0.0.5 releaseease:
- Features and bugs fixed on others components
###0.0.4 releaseease:
- Comparison / Pyramid Chart
- Funnel Chart
- Features and bugs fixed on others components
###0.0.3 release:
- Summary Component
- Export Data
- Features and bugs fixed on others components
###0.0.2 release:
- Pentaho Analyzer Component
- Ion Range Slider Component
###0.0.1
- JustGage Component
- Vectormap Component
- Videoplayer Component
- Samples
- Documentation


