A plotting library available in many programming languages. Goals of this library are to
- Have a single library for plotting that is stable accross programming languages and over time.
- Is easy to build in any programming language and to include in any project.
- Is easy to use.
The library is developed using progsbase, a technology for writing timeless code. As a consequence, it will be available in many programming languages.


- Java - 5+
- C - 99+ | Video Tutorial
- C++ - 98+ | Video Tutorial
- JavaScript - 5+
- TypeScript
- PHP - 5+
- C# - 6+
- Python - 2+
- Visual Basic - 9+
- Ruby - 2+
The library has the same interface in all supported languages. The example below is in Java with links to complete examples in all supported programming languages.
Complete example available in the following languages:
Java | C | C++ | JavaScript | TypeScript | PHP | C# | Python | Visual Basic | Ruby
RGBABitmapImageReference imageReference = CreateRGBABitmapImageReference();
StringReference errorMessage = new StringReference();
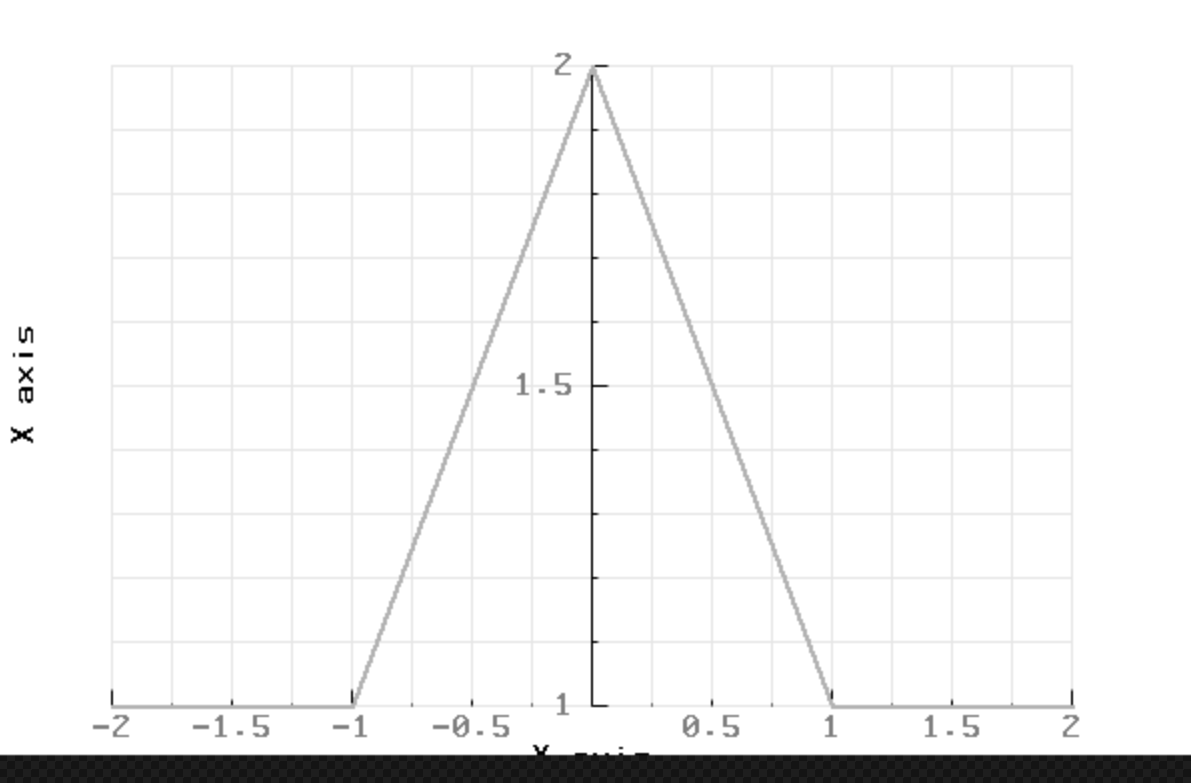
double [] xs = {-2, -1, 0, 1, 2};
double [] ys = {2, -1, -2, -1, 2};
boolean success = DrawScatterPlot(imageReference, 600, 400, xs, ys, errorMessage);
This code produces the following graph. The boundaries are automatically calculated. The plot is linearly interpolated and drawn in black, one pixel wide.

Complete example available in the following languages:
Java | C | C++ | JavaScript | TypeScript | PHP | C# | Python | Visual Basic | Ruby
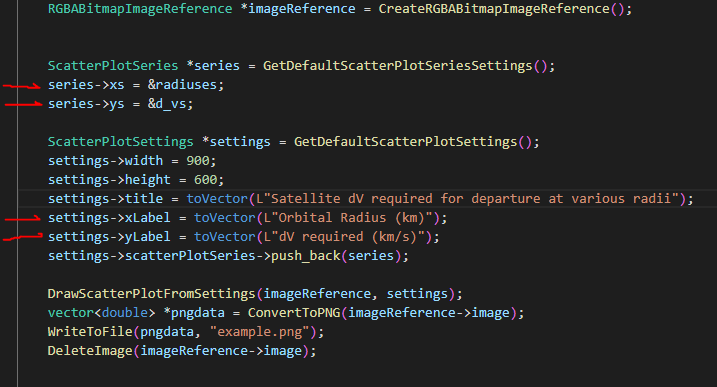
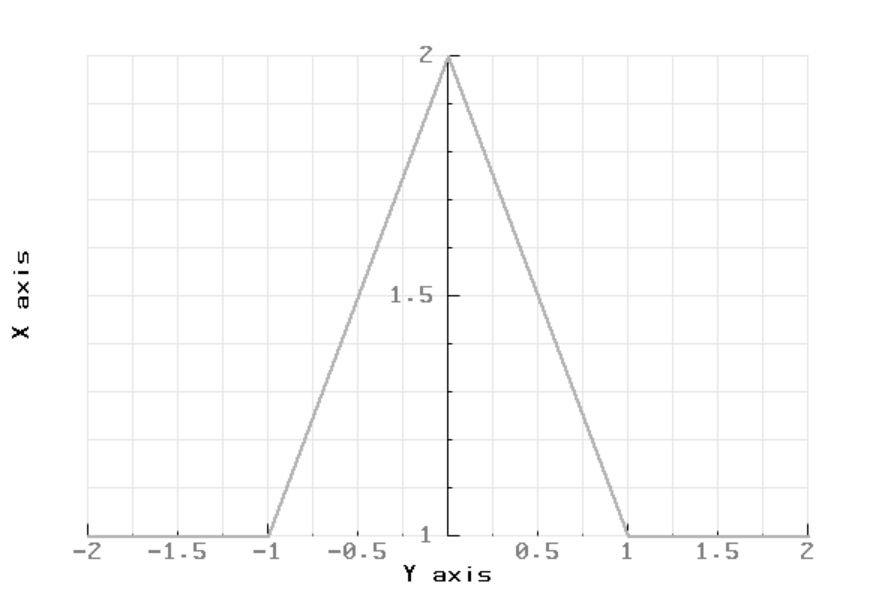
ScatterPlotSeries series = GetDefaultScatterPlotSeriesSettings();
series.xs = new double [] {-2, -1, 0, 1, 2};
series.ys = new double [] {2, -1, -2, -1, 2};
series.linearInterpolation = true;
series.lineType = "dashed".toCharArray();
series.lineThickness = 2d;
series.color = GetGray(0.3);

ScatterPlotSettings settings = GetDefaultScatterPlotSettings();
settings.width = 600;
settings.height = 400;
settings.autoBoundaries = true;
settings.autoPadding = true;
settings.title = "x^2 - 2".toCharArray();
settings.xLabel = "X axis".toCharArray();
settings.yLabel = "Y axis".toCharArray();
settings.scatterPlotSeries = new ScatterPlotSeries [] {series};

RGBABitmapImageReference imageReference = CreateRGBABitmapImageReference();
boolean success;
StringReference errorMessage = new StringReference();
success = DrawScatterPlotFromSettings(imageReference, settings, errorMessage);
This code produces the following plot. In this plot the line is changed to dashed, 2 pixels wide, light gray. A title has been added and labels for each axis.

Convert to PNG and write to file:
if(success){
  double[] pngdata = ConvertToPNG(imageReference.image);
  WriteToFile(pngdata, "plot.png");
  DeleteImage(imageReference.image);
}
1: "dotted", 2: "dashed", 3: "dotdash", 4: "longdash", "solid" (not shown)

1: "triangles", 2: "dots", 3: "crosses", 4: "circles", 5: "filled triangles" (see blow), 6: "pixels" (see blow)


- CreateRGBColor(red, green, blue) - where red, green, blue are the percentages (0-1) of red, green and blue.
- CreateRGBAColor(red, green, blue, alpha) - where alpha is the percentage of opaqueness (0-1).
ScatterPlotSettings
- width - RGBABitmapImage - The width in pixels of the image with the plot.
- height - RGBABitmapImage - The height in pixels of the image with the plot.
- title - String - The title on the top of the plot.
- yLabel, xLabel - String - The labels for the y and x axis, respectively.
- scatterPlotSeries - (See below) - The series to plot.
- autoBoundaries - boolean - If on, automatically calculate the boundaries of the plot.
- xMax, xMin, yMax, yMin - If autoBoundaries are off, these specify the boundaries of the plot.
- autoPadding - If on, automatically calculate the padding.
- xPadding, yPadding - Number of pixels - If autoPadding is off, use these paddings.
- showGrid - boolean - If on, show the grid.
- gridColor - RGBA - Color of the grid, if shown.
ScatterPlotSeries
- linearInterpolation - boolean - Whether to use linear interpolation to draw the plot.
- pointType - String - If linearInterpolation is off, the type of point. Alternatives: "crosses", "circles", "dots", "triangles", "filled triangles", "pixels"
- lineType - String - "solid", "dotted", "dashed", "dotdash", "longdash"
- lineThickness - Number of pixels - Thickness of line in pixels.
- xs, ys - Array of numbers - The x and y coordinates of points in plot.
- color - RGBA - Color of the points or line.
RGBABitmapImageReference canvasReference1 = CreateRGBABitmapImageReference();
RGBABitmapImageReference canvasReference2 = CreateRGBABitmapImageReference();
RGBABitmapImageReference canvasReference3 = CreateRGBABitmapImageReference();
RGBABitmapImageReference canvasReference4 = CreateRGBABitmapImageReference();
RGBABitmapImage combined = CreateImage(250*2, 200*2, GetWhite());
RGBABitmapImage image1, image2, image3, image4;

double [] xs = {-2, -1, 0, 1, 2};

double [] ys1 = {2, -1, -2, -1, 2};
double [] ys2 = {-2, 1, 2, 1, -2};
double [] ys3 = {0, 1, 2, 3, 4};
double [] ys4 = {0, -1, -2, -3, -4};

boolean success;
success = DrawScatterPlot(canvasReference1, 250, 200, xs, ys1);
success = success && DrawScatterPlot(canvasReference2, 250, 200, xs, ys2);
success = success && DrawScatterPlot(canvasReference3, 250, 200, xs, ys3);
success = success && DrawScatterPlot(canvasReference4, 250, 200, xs, ys4);

if(success){
  image1 = canvasReference1.image;
  image2 = canvasReference2.image;
  image3 = canvasReference3.image;
  image4 = canvasReference4.image;

  DrawImageOnImage(combined, image1, 0, 0);
  DrawImageOnImage(combined, image2, 0, 200);
  DrawImageOnImage(combined, image3, 250, 0);
  DrawImageOnImage(combined, image4, 250, 200);
}

This code maps coordinates in the plot (x, y) to pixel coordinates on the image (xPixels, yPixels). This mapping is based on the automatically generated plot settings given an image image and an array of numbers xs or ys.
xPixels = MapXCoordinateAutoSettings(xPlot, image, xs);
yPixels = MapYCoordinateAutoSettings(yPlot, image, ys);
When using 'DrawScatterPlotFromSettings' use 'MapXCoordinateBasedOnSettings' and 'MapYCoordinateBasedOnSettings' instead, as it will take into account all settings when mapping the coordinate.
xPixels = MapXCoordinateBasedOnSettings(xPlot, settings);
yPixels = MapYCoordinateBasedOnSettings(yPlot, settings);
The following code draws a line from (0, 0) to (1, 1) in the plot's coordinate system. The coordinates must be mapped to pixel coordinates before drawing. The mapping is based on the automatic settings calculated from the image dimensions and plot data.
RGBABitmapImageReference canvasReference = CreateRGBABitmapImageReference();

double [] xs = {-2, -1, 0, 1, 2};
double [] ys = {-2, 1, 2, 1, -2};

boolean success;
StringReference errorMessage = new StringReference();
success = DrawScatterPlot(canvasReference, 600, 400, xs, ys, errorMessage);

if(success){
  double x1 = MapXCoordinateAutoSettings(0, canvasReference.image, xs);
  double y1 = MapYCoordinateAutoSettings(0, canvasReference.image, ys);

  double x2 = MapXCoordinateAutoSettings(1, canvasReference.image, xs);
  double y2 = MapYCoordinateAutoSettings(1, canvasReference.image, ys);

  DrawLine(canvasReference.image, x1, y1, x2, y2, 2, GetGray(0.3));
}
This will produce the following plot.

Other custom drawing tools available:
- DrawLine - Draws a line from point
(x1, y1)to(x2, y2). - DrawPixel - Draws a pixel on point
(x, y). - DrawRectangle1px, DrawFilledRectangle - Draws a rectangle with upper-left corner at
(x, y)with a widthwand heighh. - DrawCircle, DrawFilledCircle - Draws a circle with center
(x, y)and radiusr. - DrawTriangle, DrawFilledTriangle - Draws an equilateral triangle with center
(x, y)and distance from center to the cornersh. - DrawText - Draws text with the upper-left point at
(x, y). - DrawTextUpwards - Draws text upwards with the upper-left point at
(x, y). - DrawQuadraticBezierCurve - Draws a quadratic Bézier curve from
(x0, y0)to(x1, y1)with control point(cx, cy). - DrawCubicBezierCurve - Draws a cubic Bézier curve from
(x0, y0)to(x1, y1)with control points(c0x, c0y)and(c1x, c1y).