Monitor your Heimdall, Bor and Virtual machine node with Prometheus and Grafana
Pre-Requesite: You need to make sure that you Matic Node is setup, including Heimdall and Bor nodes.
Step 1:
By default these changes should have already been made as part of your node setup but incase they're not, you can follow the steps below
You will need to change prometheus flag to true in the config.toml.
To access the config.toml here:
vi ~/.heimdalld/config/config.toml
Make sure that you keep the formatting intact.
Step 2:
Once you have made the changes in the config.toml you will need to stop Heimdall service and restart it. Note that you only need to restart Heimdall service if you have made changes to it.
To stop heimdall service:
sudo service heimdalld stop
To restart heimdall service:
sudo service heimdalld start
Step 3:
You will make changes in the Bor service file. To access the bor.service file you can run this command:
nano /home/ubuntu/node/bor/start.sh
There would be multiple entries. By default the following parameters should be automatically added, but if they're not added then you can the parameters from below.
Now in this you would see multiple paramaters in a list format. Add this in the following format. You can add it anywhere, for example, you can add it after --maxpeers 150
--metrics \
--pprof --pprofport 7071 --pprofaddr '0.0.0.0' \
Note that these parameters should already be added as part of your setup. You only need to add these parameters if they're not already present in the start.sh file.
You need to make sure that the spaces and formatting are intact.
Now you will notice that your bor will stop because we made changes to the service file. You will need to stop the bor service and restart it.
To Stop Bor service:
sudo service bor stop
Note: When you stop the service of Bor you may encounter a warning asking you run systemctl daemon-reload to reload units.
You will need to run this as sudo systemctl daemon-reload. Once this is successfull you can proceed with starting the Bor service.
To Restart Bor service:
sudo service bor start
Step 4:
Clone the Prometheus repository to your remote machine
git clone https://github.com/maticnetwork/node-prometheus.git
And then switch to the Prometheus directory.
Then install Docker by running the following command:
sudo apt install docker-compose
Once Docker is installed then you run docker by running the following command to start Prometheus: sudo docker-compose up -d
Note: If you're getting an error after running docker-compose up -d please run the following commands on your remote machine
sudo usermod -aG docker ubuntu
newgrp docker
And then you can run docker-compose up -d again.
Step 5:
Open Grafana at following URL:
http://host_ip:3000
Note: Ports of 3000 and 9090 need to open on your cloud firewall.
Creating a Proxy Tunnel
This is an optional step.
If you're running your Node on a Cloud service then you can also create a proxy tunnel on your local machine to your Cloud Machine
You can run this command ssh -N -L 3000:0.0.0.0:3000 ubuntu@<your ip address>. There would not be any output for this, however you can then check in your browser and access this URL: :3000
You should be able to login to Grafana dashboard. Else you can always use http://localhost:3000
These login credentials can be changed according to user preferences once logged in:
username: admin
password: admin
Grafana uses web based APIs to connect to prometheus server for indexed data. For that, it needs prometheus host name.
-
Open grafana at url: http://host_ip:3000. Hover on the setting icon in the left pane and selet Data Sources:
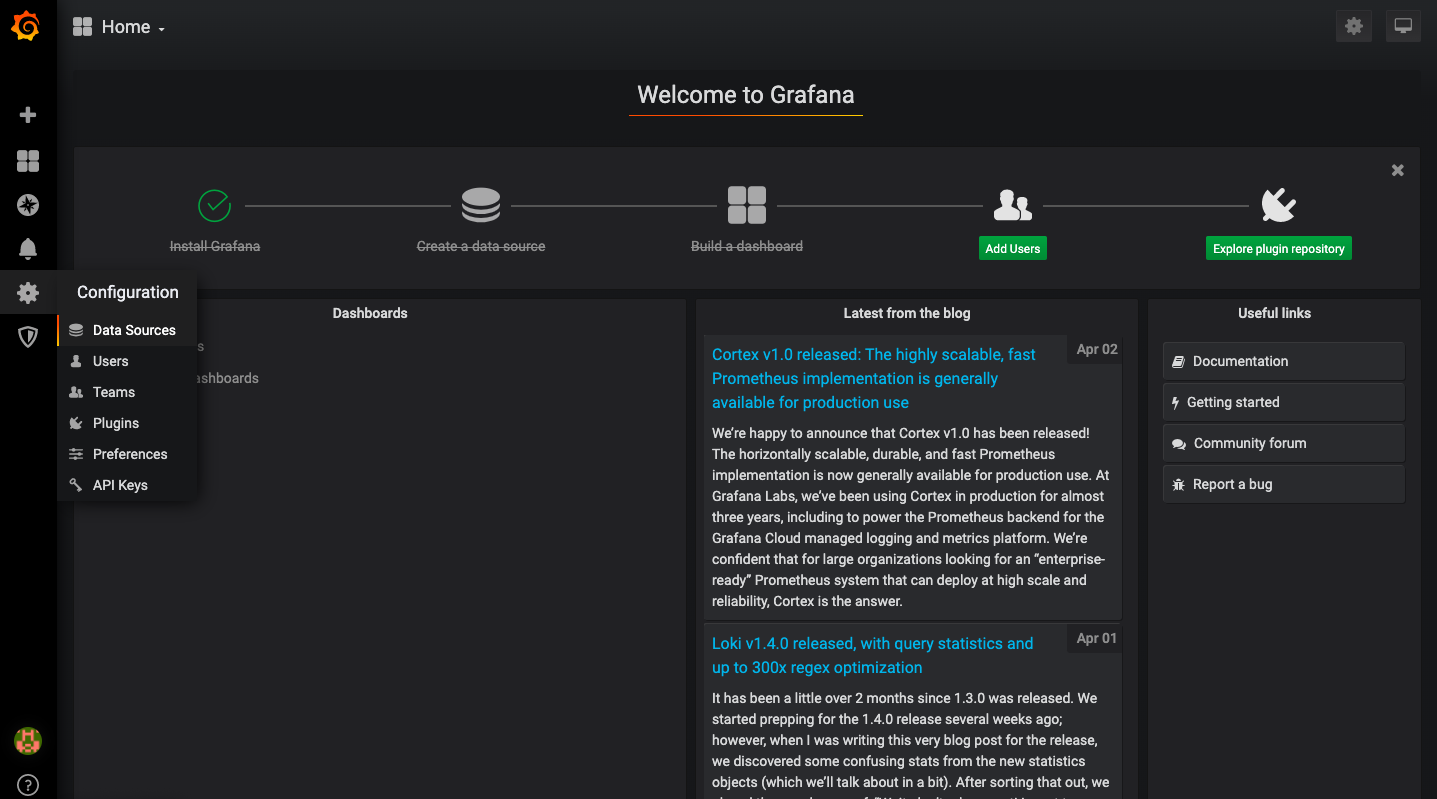
-
Notice that Prometheus sample datasource is added and click on the same:
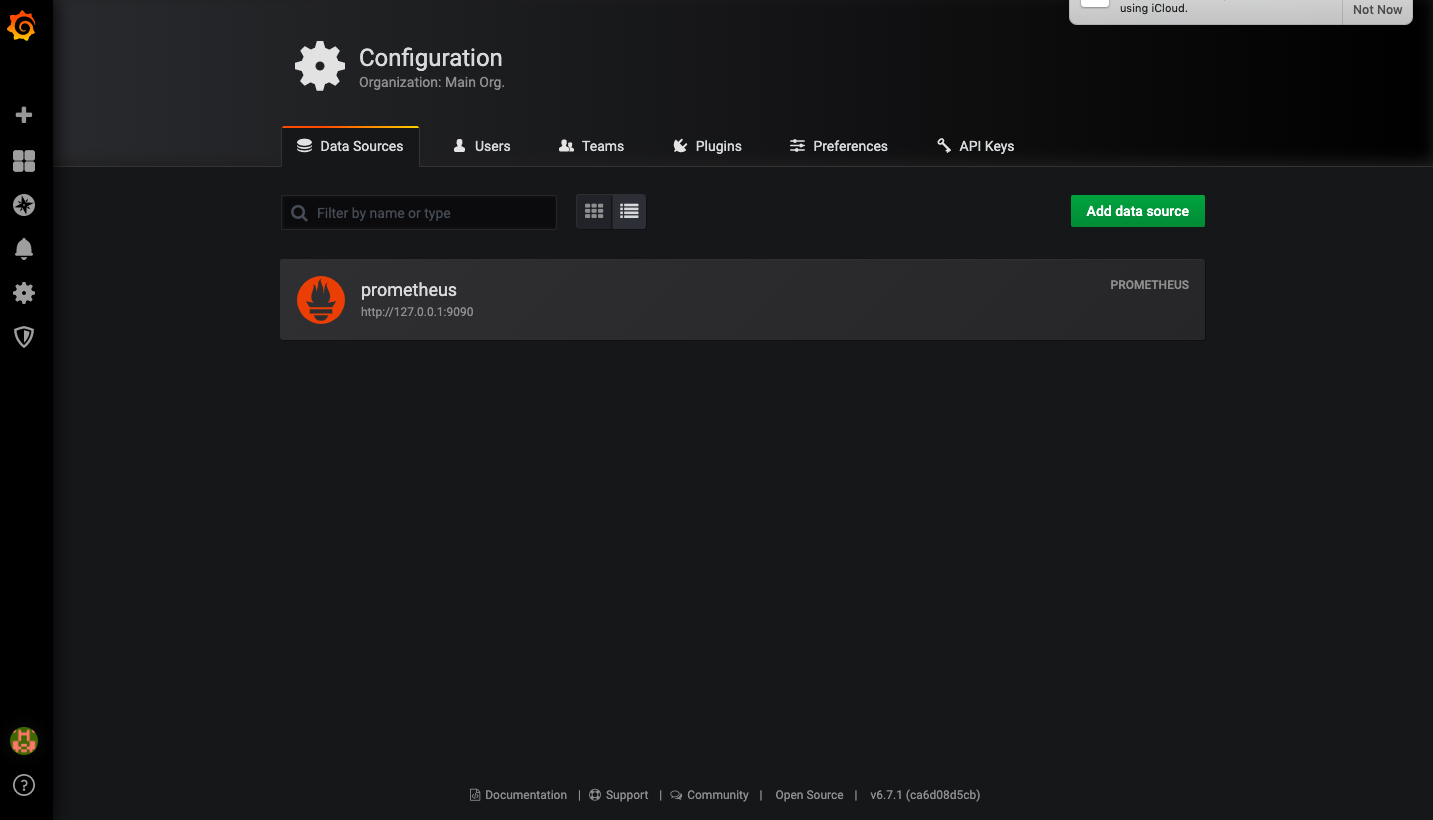
-
Change the HTTP url to http://host_ip:9090 and save. Make sure
9090port is open. Click onSave and Testbutton to chek if the connection is a success. After the success message, go to Grafana home: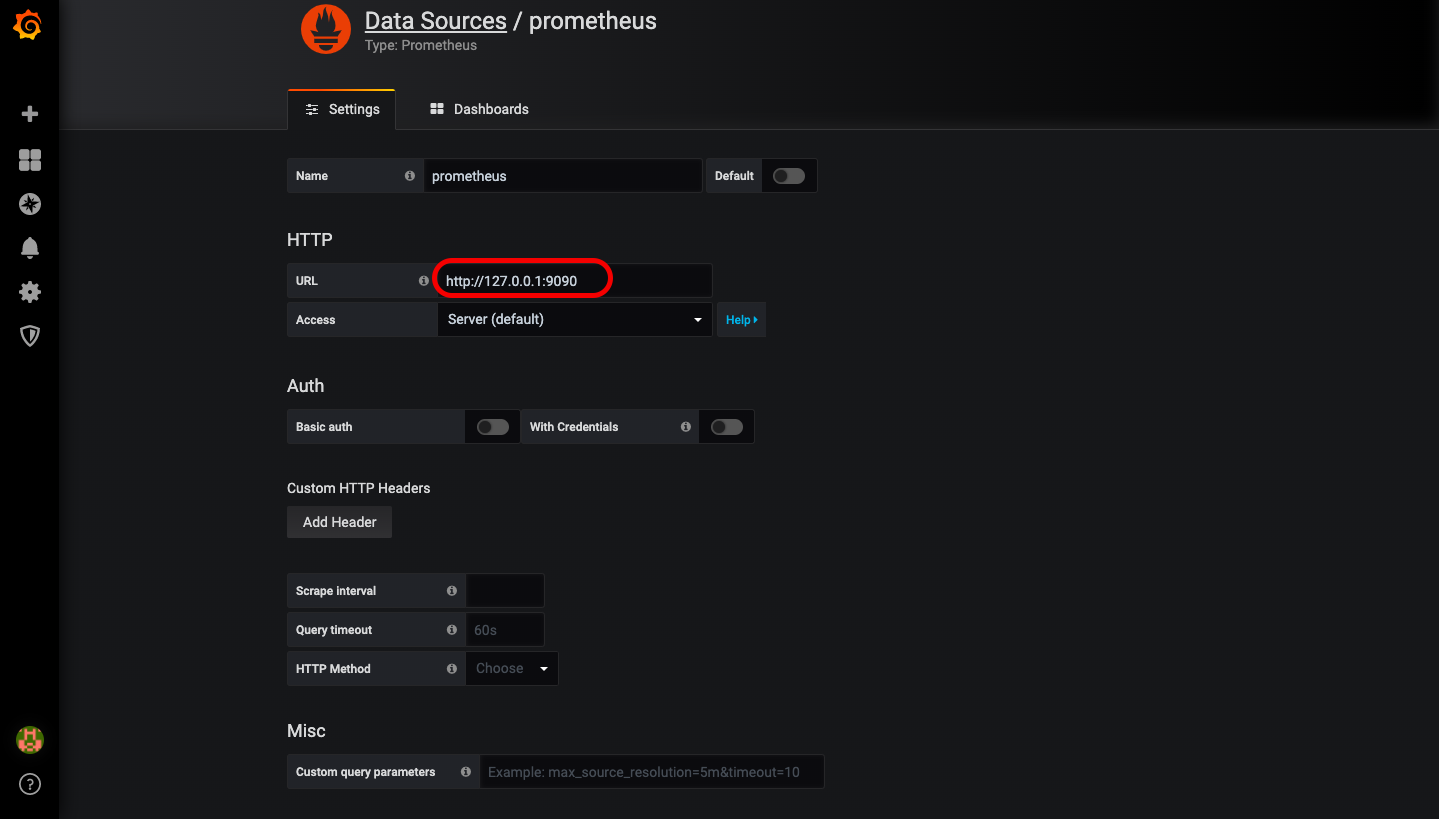
-
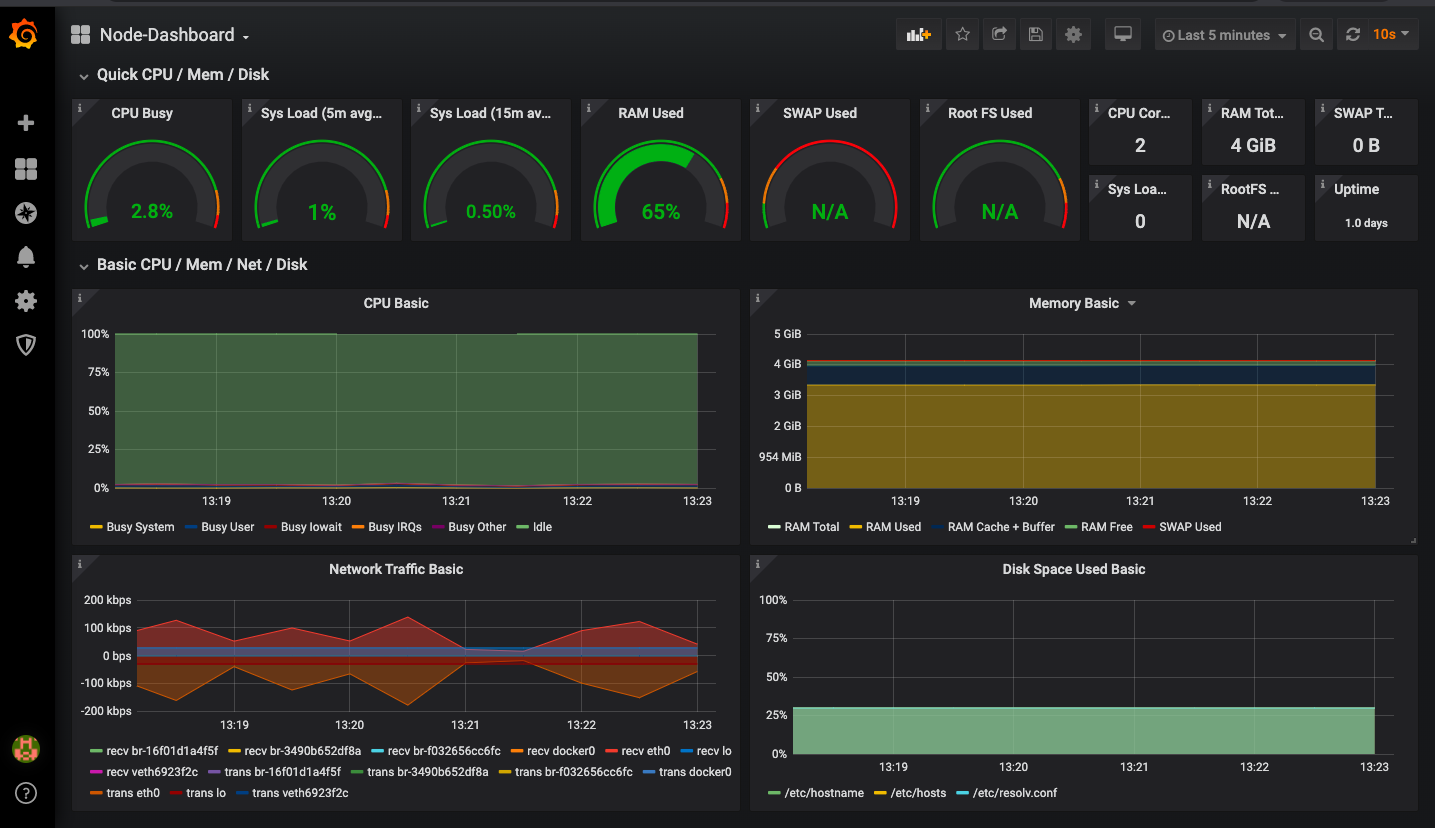
Click on the Home button on the left top and select the required option (Heimdall-Dashboard/Bor-Dashboard/Node-Dashboard) to view the respective metrics.
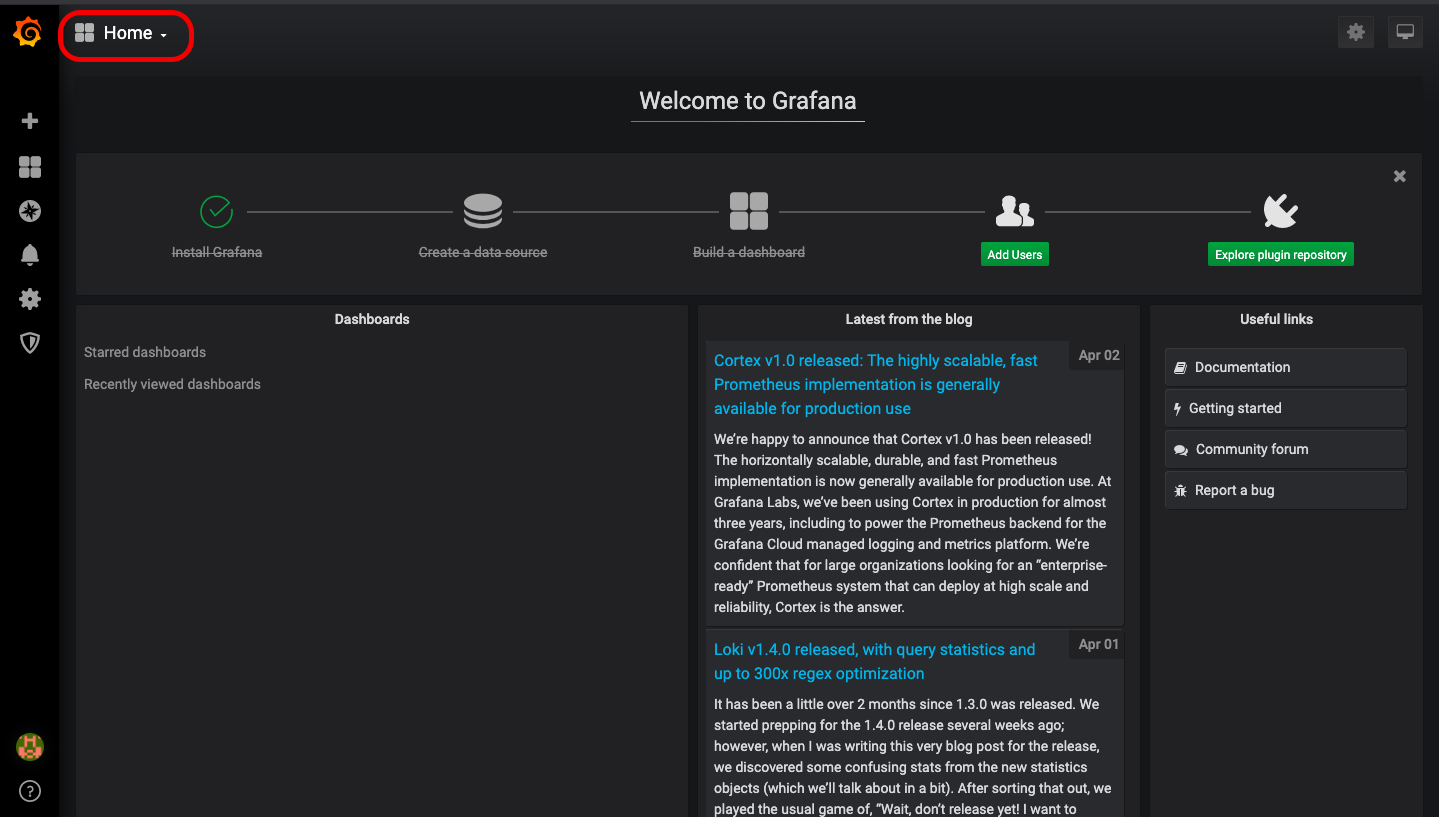
-
Notice Heimdall-Dashboard loaded as below
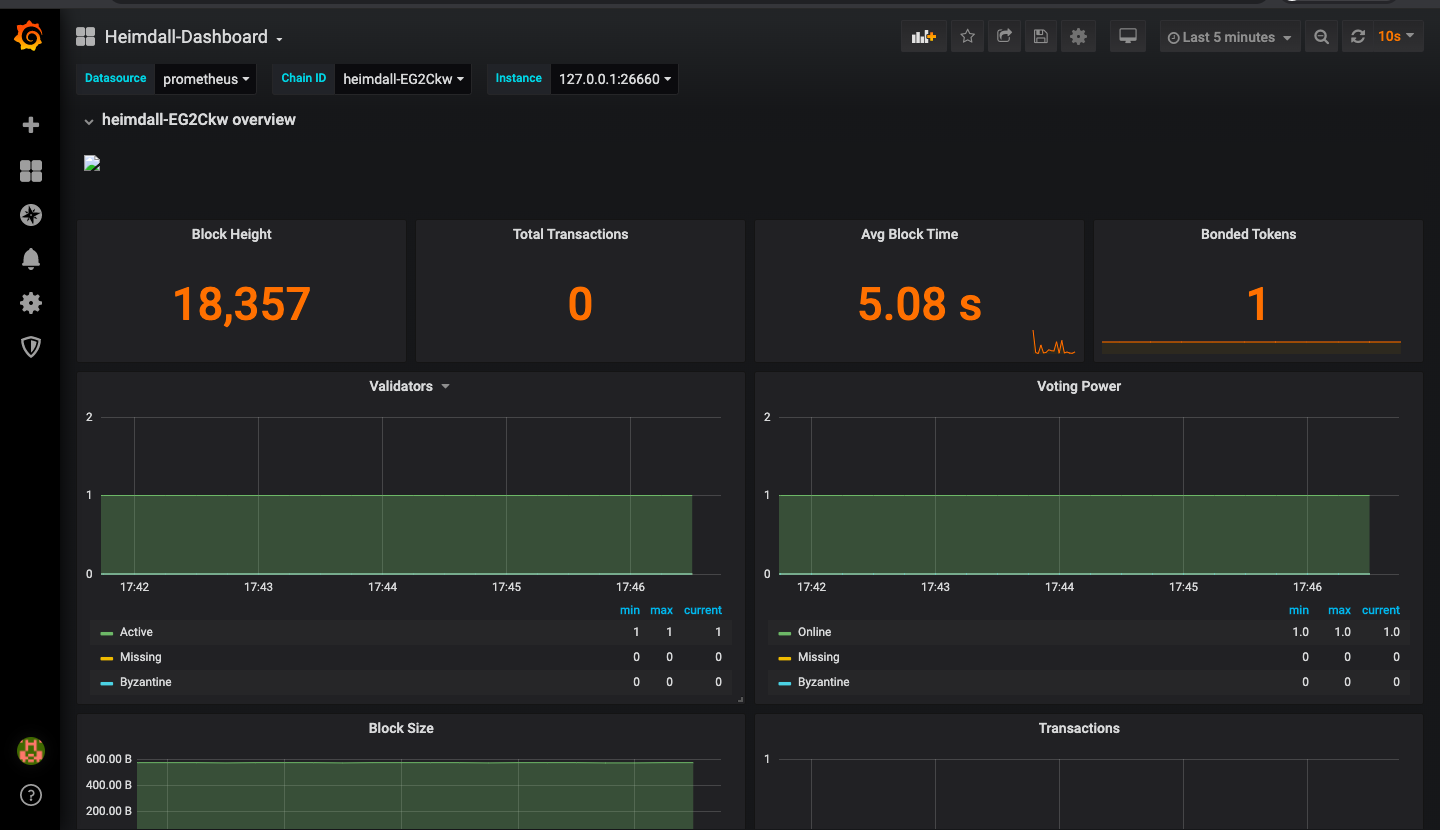
-
Notice Bor-Dashboard loaded as below
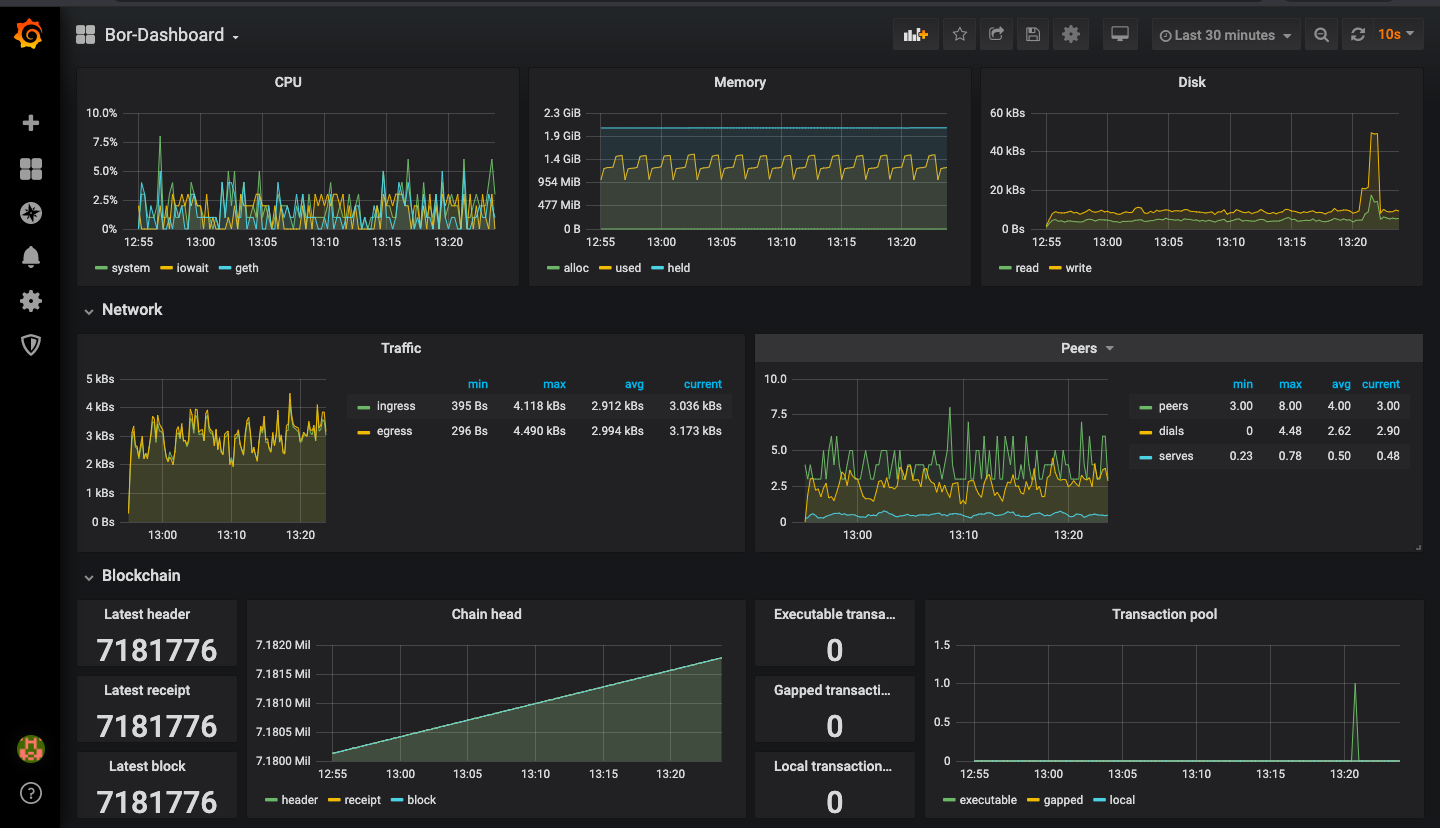
-
Notice Node-Dashboard loaded as below