Giter Club home page Giter Club logo

colorcet's Introduction


Colorcet: Collection of perceptually uniform colormaps

Build Status Linux/MacOS Build Status
Coverage codecov
Latest dev release Github tag dev-site
Latest release Github release PyPI version colorcet version conda-forge version defaults version
Python Python support
Docs gh-pages site

What is it?

Colorcet is a collection of perceptually uniform colormaps for use with Python plotting programs like bokeh, matplotlib, holoviews, and datashader based on the set of perceptually uniform colormaps created by Peter Kovesi at the Center for Exploration Targeting.

Installation

Colorcet supports Python 3.7 and greater on Linux, Windows, or Mac and can be installed with conda:

conda install colorcet

or with pip:

python -m pip install colorcet

To work with JupyterLab you will also need the PyViz JupyterLab extension:

conda install -c conda-forge jupyterlab
jupyter labextension install @pyviz/jupyterlab_pyviz

Once you have installed JupyterLab and the extension launch it with:

jupyter-lab

If you want to try out the latest features between releases, you can get the latest dev release by installing:

conda install -c pyviz/label/dev colorcet

For more information take a look at Getting Started.

Learning more

You can see all the details about the methods used to create these colormaps in Peter Kovesi's 2015 arXiv paper. Other useful background is available in a 1996 paper from IBM.

The Matplotlib project also has a number of relevant resources, including an excellent 2015 SciPy talk, the viscm tool for creating maps like the four in mpl, the cmocean site collecting a set of maps created by viscm, and the discussion of how the mpl maps were created.

Samples

Some of the Colorcet colormaps that have short, memorable names (which are probably the most useful ones) are visible here:

But the complete set of 100+ is shown in the User Guide.

colorcet's People

Contributors

casyfill avatar ceball avatar djsutherland avatar droumis avatar hoxbro avatar jbednar avatar jlstevens avatar jsignell avatar jthetzel avatar kcpevey avatar kebowen730 avatar kianmeng avatar maximlt avatar randallpittman avatar timw6n avatar

Stargazers

 avatar  avatar  avatar  avatar  avatar  avatar  avatar  avatar  avatar  avatar  avatar  avatar  avatar  avatar  avatar  avatar  avatar  avatar  avatar  avatar  avatar  avatar  avatar  avatar  avatar  avatar  avatar  avatar  avatar  avatar  avatar  avatar  avatar  avatar  avatar  avatar  avatar  avatar  avatar  avatar  avatar  avatar  avatar  avatar  avatar  avatar  avatar  avatar  avatar  avatar  avatar  avatar  avatar  avatar  avatar  avatar  avatar  avatar  avatar  avatar  avatar  avatar  avatar  avatar  avatar  avatar  avatar  avatar  avatar  avatar  avatar  avatar  avatar  avatar  avatar  avatar  avatar  avatar  avatar  avatar  avatar  avatar  avatar  avatar  avatar  avatar  avatar  avatar  avatar  avatar  avatar  avatar  avatar  avatar  avatar  avatar  avatar  avatar  avatar  avatar

Watchers

 avatar  avatar  avatar  avatar  avatar  avatar  avatar  avatar  avatar  avatar  avatar  avatar  avatar  avatar  avatar  avatar

colorcet's Issues

swatch() needs docstring

Thanks for contacting us! Please read and follow these instructions carefully, then delete this introductory text to keep your issue easy to read. Note that the issue tracker is NOT the place for usage questions and technical assistance; post those at Discourse instead. Issues without the required information below may be closed immediately.

ALL software version info

Python 3.7.7 (default, Apr 15 2020, 05:09:04) [MSC v.1916 64 bit (AMD64)]
IPython 7.16.1 -- An enhanced Interactive Python.
cc.version
Out[98]: '1.0.0'
matplotlib.version
Out[101]: '3.2.2'

Description of expected behavior and the observed behavior

I wanted to use swatch() to quickly plot a bunch of custom colormaps, like https://colorcet.holoviz.org/user_guide/index.html but it's not documented how to use it. I was able to plot them by making name="" and cmap=colormap_function().

tab-completion for interactivity?

This is a usability question. It looks to me like all the colormaps are available via the cc.cm dictionary. However, there is no auto-complete for dictionaries in jupyter notebook, so I either need to remember the name exactly and type it out, or call cm.keys(), search for the colormap, and copy and paste the string.

Maybe there's an easier way that I don't see?

If I could use jupyters auto-complete to find the right color map, that would be much easier given your naming schemes. One way to achieve that would be to make cm be a bunch object, so that the items can be obtained with __get_attr__. If you define __dir__ right, that allows tab-completion.
You could also define a sub-module that has instances of the colormaps with appropriate names (I think that's what matplotlib does?)

Thanks for these great colormaps!

[Improvement] Asymmetric colormaps

Hello,

Would be very useful to have a built in function that returns asymmetric colormaps. Something that would take a min, a max, and a center, and would return a colormap that conforms to that. This would be useful when the aim is for the colormap to be centered about 0.

Update colorcet to upstream, especially new Gouldian Parula replacement

Changes in upstream CSVs:

New

  • C3 - Cyclic: white - red - black - blue
  • C6 - "Six colour cyclic with primaries and secondaries matched in lightness"
  • C7 - Cyclic Yellow - Magenta - Cyan - Green - Yellow
  • L20 - Parula replacement "Gouldian"
  • R4 - Rainbow colour map from blue to red

Changed

  • D1-D9, L1-L9 renamed to D01-D09, L01-L09
  • Floats have higher precision

There actually look to be even more in colorcet.m, I guess that's the ultimate canonical source?

I'm a bit unsure how to integrate these changes into CET_to_py.py, especially the D01-D09 and L01-09 stuff. Or maybe this project keeps the original CSV names?

[DOCS] Explain matplotlib get_cmap function

Would it make sense to implement a get_cmap function as colorcet.cm.get_cmap that could override Matplotlib's so that external libraries using MPL's get_cmap could just replace it with Colorcet's get_cmap if Colorcet is available at runtime? This would make interfaceing with Colorcet super easy for other libraries already leveraging MPL's colormaps.

I'm thinking that this function would have the same arguments and behavior as MPL's get_cmap but it would also grab Colorcet colormaps by name and default to Colorcet if MPL has a similarly named colormap.

matplotlib.cm.get_cmap returns a copy in 3.6.0

ALL software version info

colorcet 39af94a; Python 3.11; Matplotlib 3.6.0rc1

Description of expected behavior and the observed behavior

As noted in the get_cmap docstring, it will return a copy in 3.6. This has taken effect in 3.6.0rc1, and is causing tests that assume that to break. See test downstream build in Fedora.

Stack traceback and/or browser JavaScript console output

_______________ test_get_cm[diverging_isoluminant_cjm_75_c23-v0] _______________

k = 'diverging_isoluminant_cjm_75_c23'
v = <matplotlib.colors.LinearSegmentedColormap object at 0x7f7592dcfa50>

    @pytest.mark.parametrize('k,v', list(cc.cm.items()))
    def test_get_cm(k, v):
        import matplotlib.cm as mcm
>       assert mcm.get_cmap('cet_' + k) is v
E       AssertionError: assert <matplotlib.colors.LinearSegmentedColormap object at 0x7f7591932e50> is <matplotlib.colors.LinearSegmentedColormap object at 0x7f7592dcfa50>
E        +  where <matplotlib.colors.LinearSegmentedColormap object at 0x7f7591932e50> = <function _get_cmap at 0x7f75934dcae0>(('cet_' + 'diverging_isoluminant_cjm_75_c23'))
E        +    where <function _get_cmap at 0x7f75934dcae0> = <module 'matplotlib.cm' from '/usr/lib64/python3.11/site-packages/matplotlib/cm.py'>.get_cmap

../../BUILDROOT/python-colorcet-3.0.0^20211128git39af94a-3.fc38.x86_64/usr/lib/python3.11/site-packages/colorcet/tests/test_matplotlib.py:48: AssertionError

etc. for each parametrization of test_get_cm.

PS, there are also pending deprecation warnings for register_cmap and get_cmap, but these are non-fatal as they are pending.

Add glasbey_tableau10?

Is your feature request related to a problem? Please describe.
I sometimes want to plot lots of colors but I want them to look nice

Describe the solution you'd like
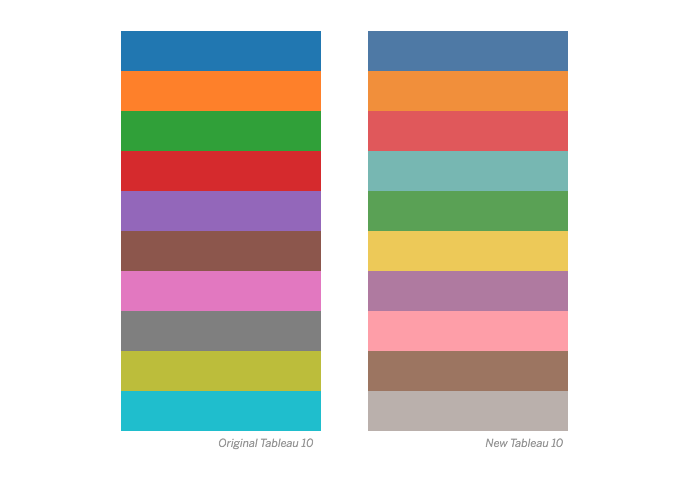
Similar to #11, could you add a Glasbey color list that starts with the (new) Tableau 10 series?

4e79a7
f28e2c
e15759
76b7b2
59a14f
edc949
af7aa1
ff9da7
9c755f
bab0ab

License in repository is CC-BY, but website says BSD

I was doing due diligence for the packages I'm planning to install by default in my software, and I noticed that the LICENSE.txt file and about.rst state that colorcet is licensed under CC-BY 3.0 whereas the About page of colorcet.holoviz.org states BSD. It would be good if this divergence was resolved, perhaps a documentation build job just needs to be run or similar? I'm mainly a GitLab user, so I'm not entirely sure.

Add named_palettes

Widget-based applications very often need to provide a list of colormaps/palettes for the user to select via a widget. The complete list of colorcet palettes is unwieldy for such a purpose, and the names are obscure, but there is a subset that has readable names that is probably also the most commonly needed set. Should add some code like the following to easily provide a list of useful colormaps, with a useful default at the front:

def odict_to_front(odict,key):
    """Given an OrderedDict, move the item with the given key to the front."""
    front_item = [(key,odict[key])]
    other_items = [(k,v) for k,v in odict.items() if k is not key]
    return OrderedDict(front_item+other_items)

from colorcet import palette
default_palette = "fire"
named_palettes = {k:p for k,p in palette.items() if not '_' in k}
sorted_palettes = OrderedDict(sorted(named_palettes.items()))
typical_palettes = odict_to_front(sorted_palettes,default_palette)

license of color scales

Hi, I think these color scales are great and would love to have them available to the Julia community. What license are they released under? I would like to copy the scales to the Julia package PlotUtils, which is under the MIT license. A reference to this repo would appear in the source file and in the documentation (at juliaplots.github.io).
Thanks!

Build breaks: ImportError: cannot import name '__version__' from 'param._version'

ALL software version info

Version: 3.0.1
Python-3.9
param-2.0.1
setuptools-63.1.0_1
FreeBSD 14.0

Description of expected behavior and the observed behavior

* Getting build dependencies for wheel...
Traceback (most recent call last):
  File "/usr/local/lib/python3.9/site-packages/param/__init__.py", line 89, in <module>
    raise FileNotFoundError
FileNotFoundError

During handling of the above exception, another exception occurred:

Traceback (most recent call last):
  File "/usr/local/lib/python3.9/site-packages/pyproject_hooks/_in_process/_in_process.py", line 353, in <module>
    main()
  File "/usr/local/lib/python3.9/site-packages/pyproject_hooks/_in_process/_in_process.py", line 335, in main
    json_out['return_val'] = hook(**hook_input['kwargs'])
  File "/usr/local/lib/python3.9/site-packages/pyproject_hooks/_in_process/_in_process.py", line 118, in get_requires_for_build_wheel
    return hook(config_settings)
  File "/usr/local/lib/python3.9/site-packages/setuptools/build_meta.py", line 177, in get_requires_for_build_wheel
    return self._get_build_requires(
  File "/usr/local/lib/python3.9/site-packages/setuptools/build_meta.py", line 159, in _get_build_requires
    self.run_setup()
  File "/usr/local/lib/python3.9/site-packages/setuptools/build_meta.py", line 281, in run_setup
    super(_BuildMetaLegacyBackend,
  File "/usr/local/lib/python3.9/site-packages/setuptools/build_meta.py", line 174, in run_setup
    exec(compile(code, __file__, 'exec'), locals())
  File "setup.py", line 6, in <module>
    import pyct.build
  File "/usr/local/lib/python3.9/site-packages/pyct/__init__.py", line 1, in <module>
    import param
  File "/usr/local/lib/python3.9/site-packages/param/__init__.py", line 93, in <module>
    from ._version import __version__
ImportError: cannot import name '__version__' from 'param._version' (/usr/local/lib/python3.9/site-packages/param/_version.py)

ERROR Backend subprocess exited when trying to invoke get_requires_for_build_wheel
*** Error code 1

Complete, minimal, self-contained example code that reproduces the issue

n/a - build breaks.

Can't Load 'colourmaptest.npy'

I was hoping to test some of my colormaps with the sine grating test, replicating what the User Guide did, but have run into this problem. I've downloaded the file from the repo to my local drive, and am attempting to load it as such:

import numpy as np

sine = np.load('colourmaptest.npy')

which produces the error:

UnpicklingError                           Traceback (most recent call last)
~/anaconda3/lib/python3.6/site-packages/numpy/lib/npyio.py in load(file, mmap_mode, allow_pickle, fix_imports, encoding)
    427             try:
--> 428                 return pickle.load(fid, **pickle_kwargs)
    429             except Exception:

UnpicklingError: invalid load key, '\x0a'.

Is there something wrong with the file? Am I doing anything wrong?

Colorblind-safe categorical map?

Describe the solution you'd like

It would be nice to have a categorical colormap similar to the glasbey maps, but that is colorblind-safe.

Additional context

The pair cc.b_glasbey_category10[2] (#2ba02b) and cc.b_glasbey_category10[3] (#d62628) are not colorblind-safe.

Support Python 3.12

Python 3.12 is out. I am using colorcet successfully, but it would be great if the package could declare its support, e.g., via the README, PyPI metadata, or tests in GitHub actions.

image

image

image

Add Glasbey colors?

Colorcet currently includes only continuous color spaces, but it was created while working on Datashader, which uses both continuous and categorical sets of colors. For rendering categorical data, Datashader requires having a distinct color per category, and it includes some ad-hoc collections of colors to try to get enough distinct colors to deal with complex datasets.

A principled approach for designing arbitrarily large sets of mutually distinct colors was presented in:

Glasbey, Chris; van der Heijden, Gerie & Toh, Vivian F. K. et al. (2007), "Colour displays for categorical images", Color Research & Application 32.4: 304-309.

"Glasbey" colors are available in ImageJ and for R, and there is a Python implementation of the method. Generating the colors with the Python code is time consuming, so it would be convenient to generate one or more large sets of Glasbey colors and distribute them in colorcet.

Here's an example of generating 257 colors, which took about 5 minutes to run:

pip install colorspacious
git clone https://github.com/taketwo/glasbey.git
cd glasbey
python glasbey.py --view 257 --format float output.csv

image

You can click on the image to see it in more detail. The resulting list of color triples can easily be added to colorcet:

1.000000,1.000000,1.000000
0.000000,0.000000,0.000000
0.843137,0.000000,0.000000
0.549020,0.235294,1.000000
...
0.462745,0.160784,0.286275
0.741176,0.898039,0.000000

Building own colormaps based on 2-3 input colors

Is it possible to build own colormaps that are perceptually uniform colormaps? E.g. simply defining 3 colors (blue, yellow, brown) and having a function which computes some colormaps samples?

ValueError: A colormap named "cet_gray" is already registered

ALL software version info

colorcet 3.0.1 arviz 0.12.1 python 3.10/8 matplotlib 3.6.0/1
afaik introduced with recent colorcet/matplotlib release

Description of expected behavior and the observed behavior

When multiple libraries use mpl.colormaps.register(cmap, name=cmap_name) with the same cmap_name, a ValueError: A colormap named "cet_gray" is already registered. is raised. This happens e.g. for colorcet + arviz, both of which define cet_gray (see here for arviz).

What is the desired behavior -- does colorcet want to assume control of that color name, preventing others from accidentally overriding it (in which case arviz, which intends to duplicate the colorcet color, would be responsible)? Or should simultaneous overriding of the global variable be allowed.

Complete, minimal, self-contained example code that reproduces the issue

import arviz
import colorcet

or

import colorcet
import arviz

This prohibits the use of both simultaneously.

Stack traceback and/or browser JavaScript console output

Traceback (most recent call last):
 File "<string>", line 1, in <module>
 File "/home/yannik/env/env/lib/python3.10/site-packages/arviz/__init__.py", line 320, in <module>
   _mpl_cm("gray", _linear_grey_10_95_c0)
 File "/home/yannik/env/env/lib/python3.10/site-packages/arviz/__init__.py", line 317, in _mpl_cm
   register_cmap("cet_" + name, cmap=cmap)
 File "/home/yannik/env/env/lib/python3.10/site-packages/matplotlib/_api/deprecation.py", line 200, in wrapper
   return func(*args, **kwargs)
 File "/home/yannik/env/env/lib/python3.10/site-packages/matplotlib/cm.py", line 248, in register_cmap
   _colormaps.register(cmap, name=name, force=override_builtin)
 File "/home/yannik/env/env/lib/python3.10/site-packages/matplotlib/cm.py", line 149, in register
   raise ValueError(
ValueError: A colormap named "cet_gray" is already registered.

Deprecation warning from matplotlib register_cmap

Seeing a ton of these in HoloViews and Panel test suites:

panel/tests/pane/test_holoviews.py::test_holoviews_pane_mpl_renderer
  /usr/share/miniconda3/envs/test-environment/lib/python3.8/site-packages/colorcet/__init__.py:6862: PendingDeprecationWarning: The register_cmap function will be deprecated in a future version. Use ``matplotlib.colormaps.register(name)`` instead.
    register_cmap('cet_CET_R2_r',m_rainbow_bgyr_35_85_c72_r)

pyct dependency used inside setup.py

The pyct.build package is imported and used before setup is called and so a build from a fresh python environment fails because it can't import pyct.build as it hasn't yet been installed as a build dependency.

Allow more aliases

colorcet.m (essentially the "canonical" upstream, though created by cmap.m) offers more aliases for colorcet maps than are possible via CET_to_py.py, since the aliases dict is a one-to-one mapping of descriptor name to alias (e.g. linear_kryw_0-100_c71_n256: 'fire')

Describe the solution you'd like

Change aliases in CET_to_py.py to a dict of lists where each descriptorname can have multiple aliases. Rework uses of aliases to handle a list of values returned for each key.

Many colormaps not working with matplotlib

I tried many colormaps with matplotlib.pyplot, but most of them give similar errors. Here is an example for a grey colormap.

import colorcet as cc
import matplotlib.pyplot as plt

# Neither of the following work
plt.set_cmap(cc.m_linear_grey_0_100_c0)
plt.set_cmap("cet_linear_grey_0_100_c0")
plt.set_cmap(cc.cm["linear_grey_0_100_c0"])

plt.imshow(arr)

ValueError: Colormap linear_grey_0_100_c0 is not recognized. Possible values are: Accent, Accent_r, Blues, Blues_r, BrBG, BrBG_r, BuGn, BuGn_r, BuPu, BuPu_r, CMRmap, CMRmap_r, Dark2, Dark2_r, GnBu, GnBu_r, Greens, Greens_r, Greys, Greys_r, OrRd, OrRd_r, Oranges, Oranges_r, PRGn, PRGn_r, Paired, Paired_r, Pastel1, Pastel1_r, Pastel2, Pastel2_r, PiYG, PiYG_r, PuBu, PuBuGn, PuBuGn_r, PuBu_r, PuOr, PuOr_r, PuRd, PuRd_r, Purples, Purples_r, RdBu, RdBu_r, RdGy, RdGy_r, RdPu, RdPu_r, RdYlBu, RdYlBu_r, RdYlGn, RdYlGn_r, Reds, Reds_r, Set1, Set1_r, Set2, Set2_r, Set3, Set3_r, Spectral, Spectral_r, Vega10, Vega10_r, Vega20, Vega20_r, Vega20b, Vega20b_r, Vega20c, Vega20c_r, Wistia, Wistia_r, YlGn, YlGnBu, YlGnBu_r, YlGn_r, YlOrBr, YlOrBr_r, YlOrRd, YlOrRd_r, afmhot, afmhot_r, autumn, autumn_r, binary, binary_r, bone, bone_r, brg, brg_r, bwr, bwr_r, cet_bgy, cet_bgy_r, cet_bgyw, cet_bgyw_r, cet_bjy, cet_bjy_r, cet_bkr, cet_bkr_r, cet_bky, cet_bky_r, cet_blues, cet_blues_r, cet_bmw, cet_bmw_r, cet_bmy, cet_bmy_r, cet_colorwheel, cet_colorwheel_r, cet_coolwarm, cet_coolwarm_r, cet_cyclic_grey_15_85_c0, cet_cyclic_grey_15_85_c0_r, cet_cyclic_grey_15_85_c0_s25, cet_cyclic_grey_15_85_c0_s25_r, cet_cyclic_mrybm_35_75_c68, cet_cyclic_mrybm_35_75_c68_r, cet_cyclic_mrybm_35_75_c68_s25, cet_cyclic_mrybm_35_75_c68_s25_r, cet_cyclic_mygbm_30_95_c78, cet_cyclic_mygbm_30_95_c78_r, cet_cyclic_mygbm_30_95_c78_s25, cet_cyclic_mygbm_30_95_c78_s25_r, cet_cyclic_wrwbw_40_90_c42, cet_cyclic_wrwbw_40_90_c42_r, cet_cyclic_wrwbw_40_90_c42_s25, cet_cyclic_wrwbw_40_90_c42_s25_r, cet_dimgray, cet_dimgray_r, cet_diverging_bkr_55_10_c35, cet_diverging_bkr_55_10_c35_r, cet_diverging_bky_60_10_c30, cet_diverging_bky_60_10_c30_r, cet_diverging_bwr_40_95_c42, cet_diverging_bwr_40_95_c42_r, cet_diverging_bwr_55_98_c37, cet_diverging_bwr_55_98_c37_r, cet_diverging_cwm_80_100_c22, cet_diverging_cwm_80_100_c22_r, cet_diverging_gkr_60_10_c40, cet_diverging_gkr_60_10_c40_r, cet_diverging_gwr_55_95_c38, cet_diverging_gwr_55_95_c38_r, cet_diverging_gwv_55_95_c39, cet_diverging_gwv_55_95_c39_r, cet_diverging_isoluminant_cjm_75_c23, cet_diverging_isoluminant_cjm_75_c23_r, cet_diverging_isoluminant_cjm_75_c24, cet_diverging_isoluminant_cjm_75_c24_r, cet_diverging_isoluminant_cjo_70_c25, cet_diverging_isoluminant_cjo_70_c25_r, cet_diverging_linear_bjr_30_55_c53, cet_diverging_linear_bjr_30_55_c53_r, cet_diverging_linear_bjy_30_90_c45, cet_diverging_linear_bjy_30_90_c45_r, cet_diverging_rainbow_bgymr_45_85_c67, cet_diverging_rainbow_bgymr_45_85_c67_r, cet_fire, cet_fire_r, cet_gray, cet_gray_r, cet_gwv, cet_gwv_r, cet_isolum, cet_isolum_r, cet_isoluminant_cgo_70_c39, cet_isoluminant_cgo_70_c39_r, cet_isoluminant_cgo_80_c38, cet_isoluminant_cgo_80_c38_r, cet_isoluminant_cm_70_c39, cet_isoluminant_cm_70_c39_r, cet_kb, cet_kb_r, cet_kbc, cet_kbc_r, cet_kg, cet_kg_r, cet_kgy, cet_kgy_r, cet_kr, cet_kr_r, cet_linear_bgy_10_95_c74, cet_linear_bgy_10_95_c74_r, cet_linear_bgyw_15_100_c67, cet_linear_bgyw_15_100_c67_r, cet_linear_bgyw_15_100_c68, cet_linear_bgyw_15_100_c68_r, cet_linear_blue_5_95_c73, cet_linear_blue_5_95_c73_r, cet_linear_blue_95_50_c20, cet_linear_blue_95_50_c20_r, cet_linear_bmw_5_95_c86, cet_linear_bmw_5_95_c86_r, cet_linear_bmw_5_95_c89, cet_linear_bmw_5_95_c89_r, cet_linear_bmy_10_95_c71, cet_linear_bmy_10_95_c71_r, cet_linear_bmy_10_95_c78, cet_linear_bmy_10_95_c78_r, cet_linear_gow_60_85_c27, cet_linear_gow_60_85_c27_r, cet_linear_gow_65_90_c35, cet_linear_gow_65_90_c35_r, cet_linear_green_5_95_c69, cet_linear_green_5_95_c69_r, cet_linear_grey_0_100_c0, cet_linear_grey_0_100_c0_r, cet_linear_grey_10_95_c0, cet_linear_grey_10_95_c0_r, cet_linear_kry_5_95_c72, cet_linear_kry_5_95_c72_r, cet_linear_kry_5_98_c75, cet_linear_kry_5_98_c75_r, cet_linear_kryw_0_100_c71, cet_linear_kryw_0_100_c71_r, cet_linear_kryw_5_100_c64, cet_linear_kryw_5_100_c64_r, cet_linear_kryw_5_100_c67, cet_linear_kryw_5_100_c67_r, cet_linear_ternary_blue_0_44_c57, cet_linear_ternary_blue_0_44_c57_r, cet_linear_ternary_green_0_46_c42, cet_linear_ternary_green_0_46_c42_r, cet_linear_ternary_red_0_50_c52, cet_linear_ternary_red_0_50_c52_r, cet_rainbow, cet_rainbow_bgyr_35_85_c72, cet_rainbow_bgyr_35_85_c72_r, cet_rainbow_bgyr_35_85_c73, cet_rainbow_bgyr_35_85_c73_r, cet_rainbow_bgyrm_35_85_c69, cet_rainbow_bgyrm_35_85_c69_r, cet_rainbow_bgyrm_35_85_c71, cet_rainbow_bgyrm_35_85_c71_r, cet_rainbow_r, cool, cool_r, coolwarm, coolwarm_r, copper, copper_r, cubehelix, cubehelix_r, flag, flag_r, gist_earth, gist_earth_r, gist_gray, gist_gray_r, gist_heat, gist_heat_r, gist_ncar, gist_ncar_r, gist_rainbow, gist_rainbow_r, gist_stern, gist_stern_r, gist_yarg, gist_yarg_r, gnuplot, gnuplot2, gnuplot2_r, gnuplot_r, gray, gray_r, hot, hot_r, hsv, hsv_r, inferno, inferno_r, jet, jet_r, magma, magma_r, nipy_spectral, nipy_spectral_r, ocean, ocean_r, pink, pink_r, plasma, plasma_r, prism, prism_r, rainbow, rainbow_r, seismic, seismic_r, spectral, spectral_r, spring, spring_r, summer, summer_r, tab10, tab10_r, tab20, tab20_r, tab20b, tab20b_r, tab20c, tab20c_r, terrain, terrain_r, viridis, viridis_r, winter, winter_r

ECCN number for colorcet

hi Team,
could you p[lease help us with the ECCN number of the software colorcet version.
If you do not have your software classified with an ECCN, please kindly answer the following questions so that we may self-assess:

  NO YES
Does the Software perform any encryption or utilize any encryption processes?    
If the answer is YES to the above, please indicate if the encryption is coded into the application or separately called (such as using SSL)    
If the answer is YES to the above, please indicate what function(s) the cryptography/encryption serves    
A,  Copyright protection purposes (Includes using a license key/code)    
B, User authentication purposes    
C, A core part of the functionality such as to encrypt databases   D, To encrypt communications between the software and a host system    
D, To encrypt communications between the software and a host system?

Regards,
Kriti Bhatnagar
Software analyst
New Products & Complex Team
EMIT | IT OPS | CES | WDS | SAM

HCL Technologies Limited
(CIN: L74140DL1991PLC046369)
10th Floor, ODC-IV, Software Tower 6, Sector 126
Noida SEZ, Uttar Pradesh – 201301, India
Phone: +1-4088093746 (ext.4144395)
Email:- [email protected]
for

ExxonMobil Global Services Company
22777 Springwoods Village Parkway
Spring, TX 77389
United States of America

Some categorical colormaps are given as list of numerical RGB instead of list of hex strings

colorcet 2.0.6

The colorcet user guide specifically mentions that it provides 'Bokeh-style' palettes as lists of hex strings, which is handy when working with Bokeh.

However, I realised this was not the case for some of the categorical palettes, including cc.glasbey_bw and cc.glasbey_hv. These return lists of RGB triplets which don't work with Bokeh.

Accessing these palettes by string name (e.g. cc.palette['glasbey_hv']) does yield a list of hex strings... so this is only an issue with regard to consistency.

Slow import on Python 3.12

ALL software version info

colorcet==3.1.0, Windows 11 23H2, Python 3.12.2 vs. 3.11.8

Description of expected behavior and the observed behavior

import colorcet should be fast, but is slow. In numbers:

  • Python 3.11 imports in ~0.03s, while Python 3.12 imports in ~0.3s, which is an order of magnitude slower.
  • Even worse, with debugpy attached, the difference is 0.3s (Python 3.11) vs. 15s (python 3.12), see microsoft/debugpy#1496

I am not 100% sure the two issues are related, but it might make sense to fix the latter and see if it also fixes the former.

It seems one fix for the latter is to reduce the numbers of lines, as proposed in explosion/spaCy#13266 (comment) and apparently employed successfully in https://github.com/carpedm20/emoji/releases/tag/v2.10.1 (they now have a 2.4-MB line of code in their https://github.com/carpedm20/emoji/blob/645331c9474aaad7362ccb1d81279724514050fa/emoji/unicode_codes/data_dict.py).

Complete, minimal, self-contained example code that reproduces the issue

bug.py

import timeit
print(timeit.timeit("import colorcet", number=1))

remove pyct / param dependency

in #84 explicit param dependency was removed, but since pyct is still a dependency, which requires param, there is still a param reliance.

it seems that pyct is only being used for command-line use, so maybe it can be moved to optional dependencies

color palette name is not recognized

Thanks for contacting us! Please read and follow these instructions carefully, then delete this introductory text to keep your issue easy to read. Note that the issue tracker is NOT the place for usage questions and technical assistance; post those at Discourse instead. Issues without the required information below may be closed immediately.

ALL software version info

(this library, plus any other relevant software, e.g. bokeh, python, notebook, OS, browser, etc)
python 3.6.5
matplotlib 3.2.2
colorcet 2.0.6

Description of expected behavior and the observed behavior

I want to generate a 3d scatter plot using a rainbow color palette from colorcet package

Complete, minimal, self-contained example code that reproduces the issue

< code to generate a 3d data set>

fig= plt.figure(figsize= (10,10))

ax= plt.axes(projection= '3d')

ax.grid(b = True, color ='grey', linestyle ='-.', linewidth = 0.3, alpha = 0.2)

map1= ax.scatter(clusterable_embedding[:,0], clusterable_embedding[:,1], clusterable_embedding[:,2],
c= num_points, cmap= cc.cm.rainbow_bgyr_35_85_c72, alpha= 0.7)

ax.set_title('n_neighbors 10 min_dist 0.1 spread 1.0 learning rate 1.0')

ax.set_xlabel('X-axis', fontweight ='bold')

ax.set_ylabel('Y-axis', fontweight ='bold')

ax.set_zlabel('Z-axis', fontweight ='bold')

fig.colorbar(map1, ax= ax, shrink= 0.5, aspect= 5)

plt.show()

# code goes here between backticks

Stack traceback and/or browser JavaScript console output

Traceback (most recent call last):
File "test_umap_hdbscan.py", line 130, in
c= num_points, cmap= cc.rainbow_bgyr_35_85_c72, alpha= 0.7)
File "C:\Temp\Python\Python3.6.5\lib\site-packages\mpl_toolkits\mplot3d\axes3d.py", line 2239, in scatter
patches = super().scatter(xs, ys, s=s, c=c, *args, **kwargs)
File "C:\Temp\Python\Python3.6.5\lib\site-packages\matplotlib_init_.py", line 1565, in inner
return func(ax, *map(sanitize_sequence, args), **kwargs)
File "C:\Temp\Python\Python3.6.5\lib\site-packages\matplotlib\cbook\deprecation.py", line 358, in wrapper
return func(*args, **kwargs)
File "C:\Temp\Python\Python3.6.5\lib\site-packages\matplotlib\axes_axes.py", line 4447, in scatter
collection.set_cmap(cmap)
File "C:\Temp\Python\Python3.6.5\lib\site-packages\matplotlib\cm.py", line 313, in set_cmap
cmap = get_cmap(cmap)
File "C:\Temp\Python\Python3.6.5\lib\site-packages\matplotlib\cm.py", line 134, in get_cmap
cbook.check_in_list(sorted(cmap_d), name=name)
File "C:\Temp\Python\Python3.6.5\lib\site-packages\matplotlib\cbook_init
.py", line 2145, in _check_in_list
.format(v, k, ', '.join(map(repr, values))))
ValueError: [[0, 0.20387, 0.96251], [0, 0.21524, 0.9514], [0, 0.22613, 0.94031], [0, 0.23654, 0.92923], [0, 0.24654, 0.91817], [0, 0.2562, 0.90712], [0, 0.26557, 0.89608], [0, 0.27465, 0.88506], [0, 0.28348, 0.87405], [0, 0.29209, 0.86305], [0, 0.30047, 0.85206], [0, 0.3087, 0.84109], [0, 0.31672, 0.83013], [0, 0.32458, 0.81917], [0, 0.33232, 0.80823], [0, 0.3399, 0.7973]
.....
is not a valid value for name; supported values are 'Accent', 'Accent_r', 'Blues', 'Blues_r', 'BrBG', 'BrBG_r', 'BuGn', 'BuGn_r', 'BuPu', 'BuPu_r', 'CMRmap', 'CMRmap_r',
....

Screenshots or screencasts of the bug in action

Note that I also tried this command:
map1= ax.scatter(clusterable_embedding[:,0], clusterable_embedding[:,1], clusterable_embedding[:,2],
c= num_points, cmap= cc.rainbow_bgyr_35_85_c72, alpha= 0.7)

and I still got the same problem

Many thanks,

Ivan

Recommend Projects

  • React photo React

    A declarative, efficient, and flexible JavaScript library for building user interfaces.

  • Vue.js photo Vue.js

    🖖 Vue.js is a progressive, incrementally-adoptable JavaScript framework for building UI on the web.

  • Typescript photo Typescript

    TypeScript is a superset of JavaScript that compiles to clean JavaScript output.

  • TensorFlow photo TensorFlow

    An Open Source Machine Learning Framework for Everyone

  • Django photo Django

    The Web framework for perfectionists with deadlines.

  • D3 photo D3

    Bring data to life with SVG, Canvas and HTML. 📊📈🎉

Recommend Topics

  • javascript

    JavaScript (JS) is a lightweight interpreted programming language with first-class functions.

  • web

    Some thing interesting about web. New door for the world.

  • server

    A server is a program made to process requests and deliver data to clients.

  • Machine learning

    Machine learning is a way of modeling and interpreting data that allows a piece of software to respond intelligently.

  • Game

    Some thing interesting about game, make everyone happy.

Recommend Org

  • Facebook photo Facebook

    We are working to build community through open source technology. NB: members must have two-factor auth.

  • Microsoft photo Microsoft

    Open source projects and samples from Microsoft.

  • Google photo Google

    Google ❤️ Open Source for everyone.

  • D3 photo D3

    Data-Driven Documents codes.