Giter Club home page Giter Club logo

leaflet.heightgraph's Introduction

Leaflet.Heightgraph

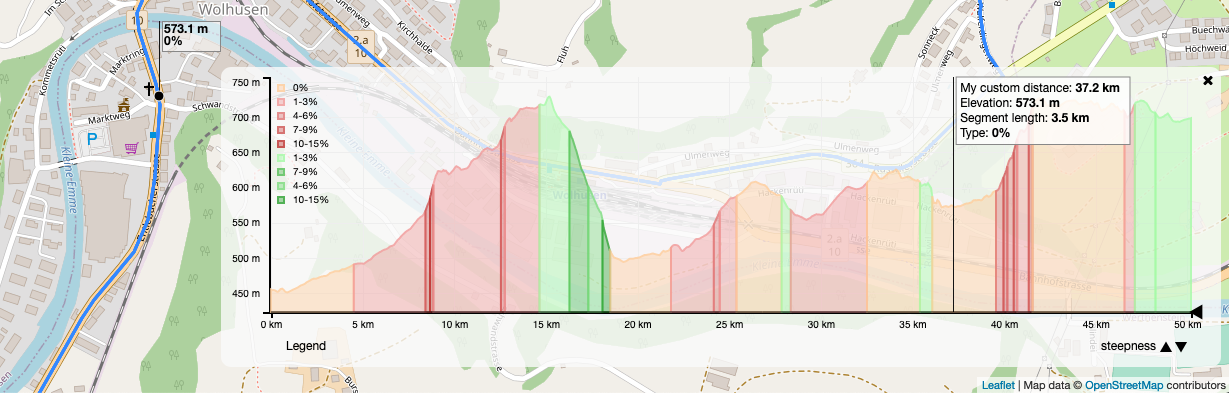
This plugin is inspired by MrMufflon/Leaflet.Elevation. You may use this plugin to view an interactive height profile of linestring segments using d3js. The input data may consist of different types of attributes you wish to display.

height_graph

Supported Browsers:

  • Chrome
  • Firefox
  • Opera

Demo

Installation

Prerequisite: node (version >=8) or use nvm to install specific node versions

Install Leaflet.Heightgraph and dependencies with npm.

npm install leaflet.heightgraph

Import

You can import the required libraries in the head of your index.html file

 <link rel="stylesheet" href="node_modules/leaflet/dist/leaflet.css" />
 <script src="node_modules/leaflet/dist/leaflet.js"></script>
 <link rel="stylesheet" href="src/L.Control.Heightgraph.css"/>
 <script type="text/javascript" src="src/L.Control.Heightgraph.js"></script>

When using NPM you can require all needed libraries like this.

require('leaflet');
require('leaflet.heightgraph');

After importing Leaflet correctly, ES 6 Module import is possible as well:

<script type="module">
    import 'leaflet.heightgraph'
</script>

The stylesheet can alternatively be imported in a style tag:

<style>
    @import "../node_modules/leaflet.heightgraph/dist/L.Control.Heightgraph.min.css";
</style>

Usage

Initialize the heightgraph, add it to your Leaflet map object and add your Data to the heightgraph object.

let hg = L.control.heightgraph();
hg.addTo(map);
hg.addData(geojson);
L.geoJson(geojson).addTo(map);

Supported data

Input data has to be of type GeoJSON-Format. This must consist of feature collection(s) corresponding to a certain attribute which could be e.g. surface or gradient information.

Each FeatureCollection comprises a certain attribute in its properties (e.g. 'summary': 'steepness') and has a list of LineString features. These should have coordinates including height values and the attributeType which corresponds to the certain type of attribute within this segment (in this case it could be an index of steepness) declared in its properties.

Notice that the list of coordinates has to start with the last coordinate of the previous LineString.

const FeatureCollections = [{
    "type": "FeatureCollection",
    "features": [{
        "type": "Feature",
        "geometry": {
            "type": "LineString",
            "coordinates": [
                [8.6865264, 49.3859188, 114.5],
                [8.6864108, 49.3868472, 114.3],
                [8.6860538, 49.3903808, 114.8]
            ]
        },
        "properties": {
            "attributeType": "3"
        }
    }, {
        "type": "Feature",
        "geometry": {
            "type": "LineString",
            "coordinates": [
                [8.6860538, 49.3903808, 114.8],
                [8.6857921, 49.3936309, 114.4],
                [8.6860124, 49.3936431, 114.3]
            ]
        },
        "properties": {
            "attributeType": "0"
        }
    }],
    "properties": {
        "Creator": "OpenRouteService.org",
        "records": 2,
        "summary": "Steepness"
    }
}];

Optional settings

These additional options can be set to customize your heightgraph. Use them by passing an options object to the heightgraph during creation e.g.:

let options = {
    position: "topleft"
}
let hg = L.control.heightgraph(options);

position

You can choose between "bottomright", "bottomleft", "topright" and "topleft" for the position on the map.

default: position: "bottomright"

width

The width of the expanded heightgraph display in pixels.

default: width: 800

height

The height of the expanded heightgraph display in pixels.

default: height: 280

margins

The margins define the distance between the border of the heightgraph and the actual graph inside. You are able to specify margins for top, right, bottom and left in pixels.

default:

margins: {
    top: 10,
    right: 30,
    bottom: 55,
    left: 50
}

expand

Boolean value that defines if the heightgraph should be expanded on creation.

default: true

expandControls

Boolean value that defines if the expand controls (i.e. toggle and close) should be visible. To be set to false when the heightgraph is embedded in another component and that controls when and how the heightgraph is expanded.

default: true

expandCallback

Function to be called if the heightgraph is expanded or reduced. The state of the heightgraph is passed as an argument. It is true when expanded and false when reduced.

default: undefined

example:

expandCallback: function(expanded){
    console.log("Expanded: " + expanded)
}

mappings

You may add a mappings object to customize the colors and labels in the height graph. Without adding custom mappings the segments and labels within the graph will be displayed in random colors. Each key of the object must correspond to the summary key in properties within the FeatureCollection.

default: undefined

Example:

colorMappings.Steepness = {
    '3': {
        text: '1-3%',
        color: '#F29898'
    },
    '0': {
        text: '4-6%',
        color: '#E07575'
    }
};

highlightStyle

You can customize the highlight style when using the horizontal line to find parts of the route above an elevation value. Use any Leaflet Path options as value of the highlightStyle parameter.

default: highlightStyle:{color: 'red'}

Example:

highlightStyle = {
   weight: 10,
   opacity: 0.8,
   color: 'orange'
 }

graphStyle

Allows customizing the style of the height graph. You may specify the element presentation attributes in the form of a JavaScript object. Note that in case of conflict the mappings attributes take precedence over the graphStyle attributes.

default: graphStyle: {}

Example:

graphStyle: {
    opacity: 0.8,
    'fill-opacity': 0.5,
    'stroke-width': '2px'
};

translation

You can change the labels of the heightgraph info field by passing translations for distance, elevation, segment_length, type and legend.

default:

translation: {
    distance: "Distance",
    elevation: "Elevation",
    segment_length: "Segment length",
    type: "Type",
    legend: "Legend"
    }

xTicks

Overwrite automatic tick handling for x axis and specify the tick frequency in the x axis of the graph. Corresponds approximately to 2 to the power of value ticks.

default: xTicks: 3

yTicks

Overwrite automatic tick handling for y axis and specify the tick frequency in the y axis of the graph. Corresponds approximately to 2 to the power of value ticks.

default: yTicks: 3

Methods

The following methods are available on a created L.control.heightgraph instance, represented by hg in the examples.

mapMousemoveHandler

Used together with mapMouseoutHandler. Takes a mousemove event as input hg.mapMousemoveHandler(event) to show the current position on the heightgraph when hovering over the respective geometry on the map. The marker on the map can be disabled by passing an object with properties showMapMarker:false as second argument. showMapMarker is true by default.

hg.mapMousemoveHandler(mousemoveEvent, {showMapMarker: false})

Check example.js for an implementation example.

mapMouseoutHandler

Used together with mapMousemoveHandler. Responsible for removing the created markers again. You can pass a timeout in milliseconds to delay the removal. The default timeout is 1000.

hg.mapMouseoutHandler(0)

Check example.js for an implementation example.

resize

Use this to resize the heightgraph container including the graph to the specified extent by passing an object including defined width and height properties in pixel values:

hg.resize({width: 1000, height: 300})

Development setup

# clone the repository
$ git clone https://github.com/GIScience/Leaflet.Heightgraph.git

# install dependencies using a node-version >= 8
$ npm install

# start development server
$ npm start

Configurations (WebStorm)

You can create run configurations for different tasks:

Starting development server

  • open Run -> Edit Configurations...
  • click + to add a new configuration and choose the npm template
  • give the Configuration a name e.g. Dev
  • choose start as command
  • press OK

Testing

Debug jasmine tests with karma in WebStorm

  • open Run -> Edit Configurations...
  • click + to add a new configuration and choose the karma template
  • give the Configuration a name e.g. Test
  • press OK

Coverage

Run karma with coverage

  • once you have a karma task configured just click the run with coverage button
  • analyse coverage in Webstorm or Browser (open ./coverage/html/index.html)

leaflet.heightgraph's People

Contributors

boldtrn avatar jaluebbe avatar mrubli avatar thegreatrefrigerator avatar timmccauley avatar

Stargazers

 avatar  avatar  avatar  avatar  avatar  avatar  avatar  avatar  avatar  avatar  avatar  avatar  avatar  avatar  avatar  avatar  avatar  avatar  avatar  avatar  avatar  avatar  avatar  avatar  avatar  avatar  avatar  avatar  avatar  avatar  avatar  avatar  avatar  avatar  avatar  avatar  avatar  avatar  avatar  avatar  avatar  avatar  avatar  avatar  avatar  avatar  avatar  avatar  avatar  avatar  avatar  avatar  avatar  avatar  avatar  avatar  avatar  avatar  avatar  avatar  avatar  avatar  avatar  avatar  avatar  avatar  avatar  avatar  avatar  avatar  avatar  avatar  avatar  avatar  avatar  avatar  avatar  avatar  avatar  avatar  avatar  avatar  avatar  avatar  avatar  avatar  avatar  avatar  avatar  avatar  avatar  avatar  avatar  avatar  avatar  avatar  avatar  avatar  avatar  avatar

Watchers

 avatar  avatar  avatar  avatar  avatar  avatar  avatar  avatar  avatar

leaflet.heightgraph's Issues

Style Changes

  • instead of 'km' and 'hm' above and under the graph, the numbers of each tick on the axes should get units (m / km)
  • use shortcuts in infobox (Dist. / Elev. / Val.)
  • infobox on the map: (Elev.:/ Val.:), border: dark grey and 1 px, fill: less transparency, font-size: increase
  • increase offset to x-Axis (15% of highest height)

Bounds not defined

In _resetDrag: function() at this._map.fitBounds(bounds);.

Steps to reproduce:

  • Select an area on the heightgraph by dragging the cursor horizontally
  • Close the HeightGraph

Fix security Issues

There are some vulnerabilities that need to be fixed.
You can see them in the Security tab if you have the rights or fork it and view them.
Security alerts have to be enabled in the repository settings.

Close Button has no Mouse Pointer

It would be nice to add a mouse pointer to the close button.

for example like this in css:

.heightgraph-close-icon {
   cursor: pointer
}

Generic usability

Processing of data should work with any kind of list object comprised of geojsons with the approriate properties. If color mappings are missing, random colors should be selected.

Horizontal section

Add an option to control a horizontal section (see image below).
The parts of a route which lie above or below the specified value (400m) are drawn in different colors.

image

Red lines / _markedSegments are not removable

When moving the horizontal slider, parts of the route/line can be highlighted in red.

These red highlights cannot be removed easily from the map.

In the onRemove method, the markedSegments should be removed.

Also it would be nice to offer a way to remove them when moving the slider. For example when moving the slider down to the bottom, the whole route is marked in red.

Probably it would be better to remove all red markers in this case.

Package on npm

I just wanted to try this package locally. I couldn't find it on npm. Is it named differently or is it simply missing from npm?

If it's missing, would you mind if I publish it? This would make using this plugin a lot easier :).

Do not repeat distance units in axis tick labels

I believe the axis tick labels should contain just numbers, while the measure units itself should be rather displayed aggregated below or next to it, for example as distance [km].

Current view
image

Proposed change
image

Add light transparency to background

Adding a light transparency to the background makes the container a bit less intrusive.

For example something like:

.heightgraph-container {
    background-color: rgba(250,250,250,.9);
}

margins get counted double

In this code:

this._width = this.options.width - this._margin.left - this._margin.right;
this._height = this.options.height - this._margin.top - this._margin.bottom;
this._mappings = this.options.mappings;
this._svgWidth = this._width - this._margin.left - this._margin.right;
this._svgHeight = this._height - this._margin.top - this._margin.bottom;
var svg = this._svg = d3.select(this._container)
    .append("svg")
    .attr("width", this._svgWidth + this._margin.left + this._margin.right)
    .attr("height", this._svgHeight + this._margin.top + this._margin.bottom)

the margin gets counted double. The resulting SVG element should have the width and height specified in the options, but instead _width has the margins subtracted from options.width, and then _svgWidth has then subtracted a second time (and they get then added again).

_width and _height should be set to whatever is set in the options, without subtracting the margins.

A workaround is to increase width and height in the specified options by adding the margin to them.

Replace Data

Is there a way to replace the data shown in the heightgraph?

Currently, my approach is to remove the heigthgraph and readd it to the map when the data changes.

With MrMufflon/Leaflet.Elevation there was the option to clear the data and then readd it. It's possible to call the addDatafunction several times with heightgraph, but with every call it will toggle the visibility/show state.

Use require to resolve dependencies

Currently, the dependencies need to be resolved by the developers including the plugin and are not resolved by NPM automatically. It would be nice to include them for example with:

require('d3-select')

Prefix class names

Currently many class names do have rather weak names, see #64.

I think it would be good to prefix all classes with leaflet-heightgraph-[classname] or something like that?

On Kurviger I just had a css conflict with Bootstrap, which is a common CSS framework.

Horizontal drag line snaps back to the bottom

Every time you want to move the horizontal drag line, it snaps down to the bottom,

How to reproduce.
Drag the horizontal drag line to a value. Now try to drag it to a different value, it snaps down to the bottom and you have to move it back from there.

Recommend Projects

  • React photo React

    A declarative, efficient, and flexible JavaScript library for building user interfaces.

  • Vue.js photo Vue.js

    ๐Ÿ–– Vue.js is a progressive, incrementally-adoptable JavaScript framework for building UI on the web.

  • Typescript photo Typescript

    TypeScript is a superset of JavaScript that compiles to clean JavaScript output.

  • TensorFlow photo TensorFlow

    An Open Source Machine Learning Framework for Everyone

  • Django photo Django

    The Web framework for perfectionists with deadlines.

  • D3 photo D3

    Bring data to life with SVG, Canvas and HTML. ๐Ÿ“Š๐Ÿ“ˆ๐ŸŽ‰

Recommend Topics

  • javascript

    JavaScript (JS) is a lightweight interpreted programming language with first-class functions.

  • web

    Some thing interesting about web. New door for the world.

  • server

    A server is a program made to process requests and deliver data to clients.

  • Machine learning

    Machine learning is a way of modeling and interpreting data that allows a piece of software to respond intelligently.

  • Game

    Some thing interesting about game, make everyone happy.

Recommend Org

  • Facebook photo Facebook

    We are working to build community through open source technology. NB: members must have two-factor auth.

  • Microsoft photo Microsoft

    Open source projects and samples from Microsoft.

  • Google photo Google

    Google โค๏ธ Open Source for everyone.

  • D3 photo D3

    Data-Driven Documents codes.