These implementations are based on the paper "Downsampling Time Series for Visual Representation" by Sveinn Steinarsson from the Faculty of Industrial Engineering, Mechanical Engineering and Computer Science University of Iceland (2013). You can read the paper here
The goal of Largest-Triangle downsampling algorithms for data visualization is to reduce the number of points in a number series without losing important visual features of the resulting graph. It is important to be aware that these algorithms are not numerically correct.
Latest version: 0.1.0
You can add this library into your Maven/Gradle/SBT/Leiningen project thanks to JitPack.io. Follow the instructions here.
Add this into your build.gradle file:
allprojects {
  repositories {
    maven { url 'https://jitpack.io' }
  }
}

dependencies {
  implementation 'com.github.ggalmazor:lt_downsampling_java8:0.1.0'
}This version of the algorithm groups numbers in same sized buckets and then selects from each bucket the point that produces the largest area with points on neighbour buckets.
You can produce a downsampled version of an input series with:
List<Point> input = Arrays.asList(...);
int numberOfBuckets = 200;

List<Point> output = LTThreeBuckets.ofSorted(input, numberOfBuckets);
First and last points of the original series are always in the output. Then, the rest are grouped into the defined amount of buckets and the algorithm chooses the best point from each bucket, resulting in a list of 202 elements.
- This library requires to provide lists of instances of the
Pointsupertype. - It also provides and uses internally the
DoublePointsubtype, which can also be used to feed data to the library. - However, users are free to create implementations of
Pointthat best fit their Domain.
Not yet implemented
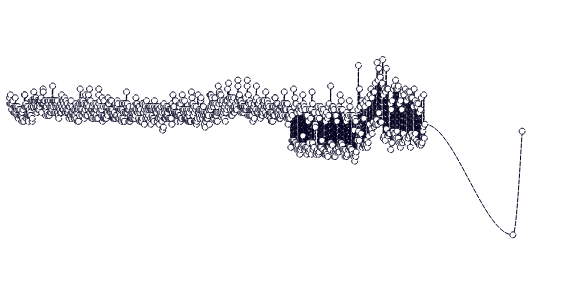
This is how a raw timeseries with ~5000 data points and downsampled versions (2000, 500, and 250 buckets) look like (graphed by AirTable)


These are closeups for 250, 500, 1000, and 2000 buckets with raw data in the back:


![dependabot[bot] avatar](https://avatars.githubusercontent.com/in/29110?v=4 "dependabot[bot]")

![github-actions[bot] avatar](https://avatars.githubusercontent.com/in/15368?v=4 "github-actions[bot]")