Giter Club home page Giter Club logo

geosci-labs's Introduction

GeoSci Labs

binder pypi License SimPEG

This is a repository of code used to power the notebooks and interactive examples for https://em.geosci.xyz and https://gpg.geosci.xyz.

The examples are based on code available in SimPEG.

Why

Interactive visualizations are a powerful way to interrogate mathematical equations. The goal of this repository is to be the home for code that can be plugged into jupyter notebooks so that we can play with the governing equations of geophysical electromagnetics.

Scope

The repository contains the python code to run the ipython-widget style apps in http://github.com/geoscixyz/geosci-labs. These are mainly plotting code and some simple analytics. More complex numerical simulations depend on SimPEG

Usage

The notebooks can be run online through Binder, or downloaded and run locally.

Binder

Binder

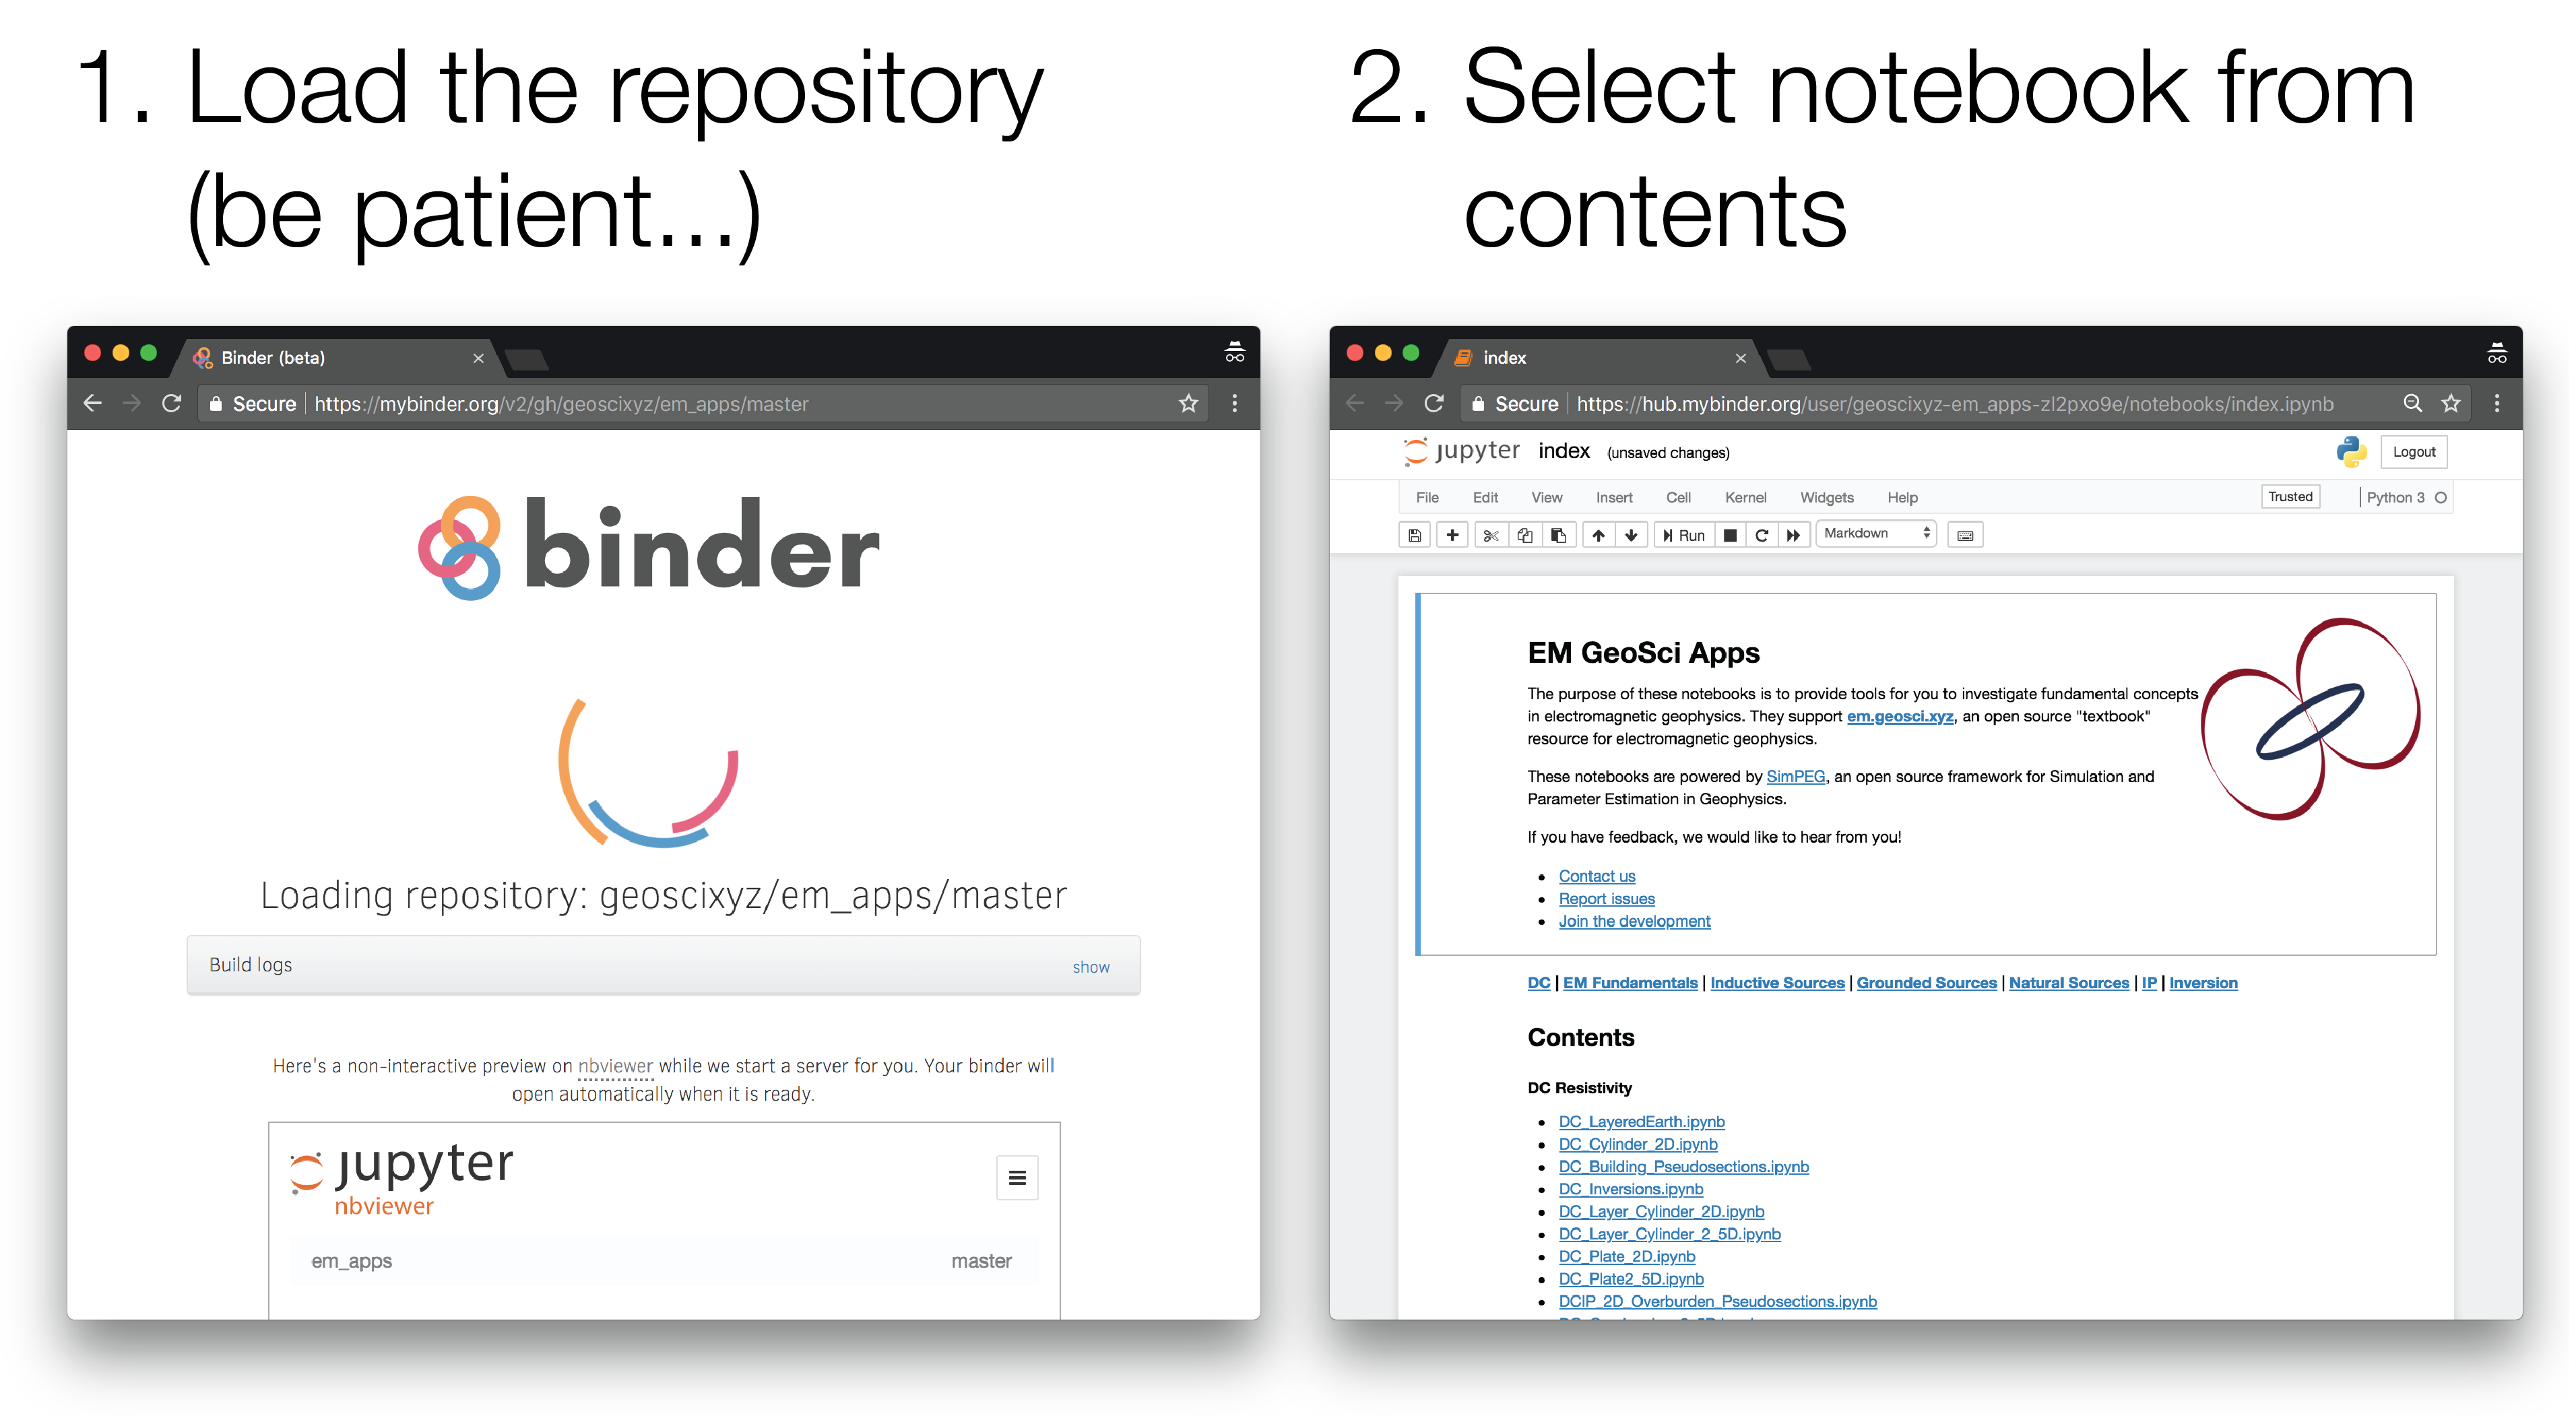
  1. Launch the binder by clicking on the badge above or going to: https://mybinder.org/v2/gh/geoscixyz/geosci-labs/main?filepath=notebooks%2Findex.ipynb. This can sometimes take a couple minutes, so be patient...

  2. Select the notebook of interest from the contents

  3. Run the Jupyter notebook

Binder-steps

Locally

To run them locally, you will need to have python installed, preferably through anaconda.

You can then clone this reposiroty. From a command line, run

git clone https://github.com/geoscixyz/geosci-labs.git

Then cd into geosci-labs

cd geosci-labs

To setup your software environment, we recommend you use the provided conda environment

conda env create -f environment.yml
conda activate geosci-labs

alternatively, you can install dependencies through pypi

pip install -r requirements.txt

You can then launch Jupyter

jupyter notebook

Jupyter will then launch in your web-browser.

Running the notebooks

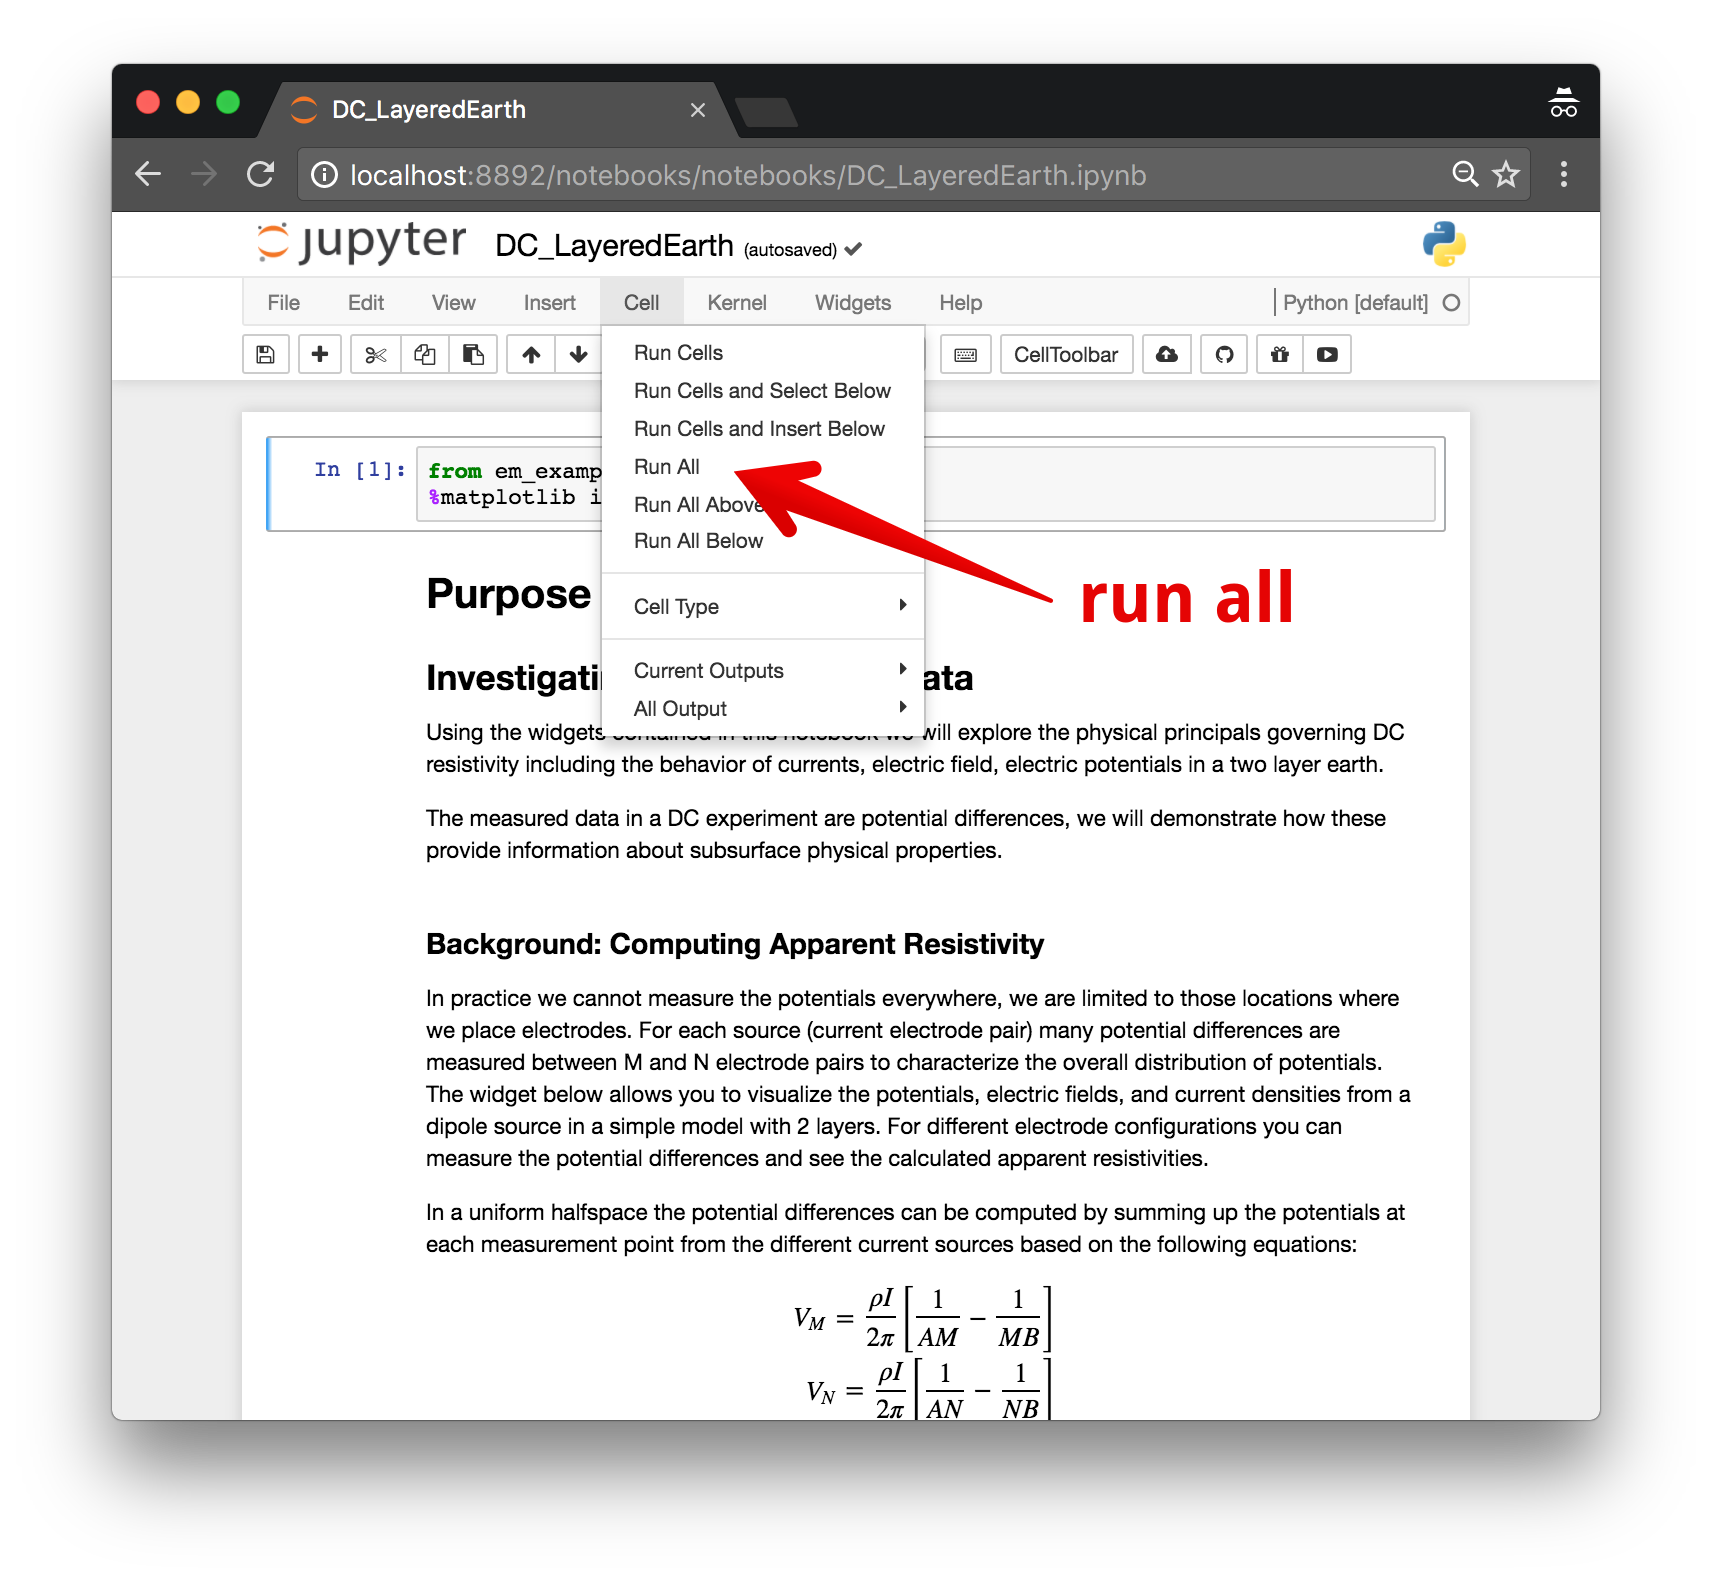
Each cell of code can be run with shift + enter or you can run the entire notebook by selecting cell, Run All in the toolbar.

cell-run-all

For more information on running Jupyter notebooks, see the Jupyter Documentation

Using in a course

Issues

If you run into problems or bugs, please let us know by creating an issue in this repository.

For Contributors

We are glad you are interested in contributing! Please check out the contributing guide for ideas of how to get involved.

geosci-labs's People

Contributors

anna1963 avatar dccowan avatar dougoldenburg avatar fourndo avatar jcapriot avatar jkutt avatar jlalvis avatar johnweis0480 avatar kaicglee avatar lheagy avatar micmitch avatar pbellive avatar rowanc1 avatar santisoler avatar sdevriese avatar sgkang avatar thast avatar thibaut-kobold avatar yangdikun avatar

Stargazers

 avatar  avatar  avatar  avatar  avatar  avatar  avatar  avatar  avatar  avatar  avatar  avatar  avatar  avatar  avatar  avatar  avatar  avatar  avatar  avatar  avatar  avatar  avatar  avatar  avatar  avatar  avatar  avatar  avatar  avatar  avatar  avatar  avatar  avatar  avatar  avatar  avatar  avatar  avatar  avatar  avatar  avatar  avatar  avatar  avatar  avatar  avatar  avatar  avatar  avatar

Watchers

 avatar  avatar  avatar  avatar  avatar  avatar  avatar  avatar  avatar  avatar

geosci-labs's Issues

magnetic dipole app updates

  • we should make an update to the app so that the dipole moment is either lower-case m or moment . Having it be upper-case M might cause confusion with magnetization
  • we should set a smaller default data spacing and line-length. The examples that we use in EOSC 350 are primarily motivated by near-surface examples (the range can still be large to simulate other examples, but the defaults can start smaller)

App structure

In order to have consistent structure to the apps, I think we should try to agree on a common skeleton for all of the apps (note that not all will be formatted correctly yet...). For the em-apps, we had agreed on:

  • Title
  • Purpose : Motivation and key concepts addressed by the notebook
  • Setup : Overview of the relevant parameters in the problem
  • Questions : Guiding questions related to the purpose
  • App : interactive visualizations
  • Explore : further questions that can be explored with the app
  • (Additional material: supporting derivations, links to related case studies, ...)

However, in practice, we tended to move the "questions" and the "explore" to the gpg, em-geosci, or the lab / assignments. In order for the apps to remain a bit more general and applicable across multiple courses, we might want to consider continuing this practice, in which-case, what do you think of the following structure

  • Title
  • Purpose : Motivation and key concepts addressed by the notebook. Includes links to relevant background material / extra questions in em geosci / gpg
  • Setup : Overview of the relevant parameters in the problem
  • App : interactive visualizations
  • (Additional material: supporting derivations, links to related case studies, ...)

Thoughts? cc @yangdikun, @dougoldenburg, @jiajiasun

Deploy geoscilabs to pypi

  • deploy geoscilabs to pypi.
  • once this is done, make a note on em_examples that em_examples is no longer maintained and that users should come here instead.

A bug in MagneticPrismApplet.ipynb?

For a positive inclination (north hemisphere), I think the negative lobe should be on the northern side and the big positive peak on the southern side?
@sgkang did you know anything? I saw you updated the notebook.

PS: I made another program to calculate the same thing and found my result and this app are always off (say 10%) by a small amount. Not sure why.

image

rename "master" to "main"

Similar to simpeg/simpeg#980, we will update the name of our main branch to "main" in our geosci repos

  • geosci-labs
  • gpg
  • gpgLabs
  • em
  • website (including courses, disc, etc)
  • toolkit

to get these changes locally, you will need to run

git branch -m master main
git fetch origin
git branch -u origin/main main
git remote set-head origin -a

Checklist for reviewers

PR #12 is the perfect occasion to set the expectations for any PR. We need to create a checklist for reviewers for what is needed in any PR. Here is a first pass:

  • in the PR:
    • Detailed PR and releases notes
  • in the .py:
    • descriptive variables name
    • Reasonably commented codes
    • style (checked by travis)
  • in the notebook:
    • Introduction
    • Purpose
    • Variables description
    • Sketch of the setup

testing

we don't need to be testing on all versions of python from 3.7 to 3.10. We could test just the lowest / highest that we support. It would be nice to also break the tests so that we can be running some of the notebook tests in parallel

Kernel Shutdowns

DCIP
-Cylinder_2D
-Layer_Cylinder_2_5D
-SurveyDataInversion-
-Overburden_Pseudosections
-Plate_2D
-Plate2_5D
-Overburden_2_5D
-Layer_Cylinder_2D

EM
-VMD
-TDEM_HorizontalLoop

Problems in Importing Some Modules When Using the Binder

Screenshot 2021-10-06 20 06 02
Dear Geoscixyz Developers,

Hello, I am Jaewook Lee, a teaching assistant at UT Dallas.
I'd like to use your geosci-labs materials for educational purposes in my Applied Geophysics course.
I tried to run some Notebooks via Binder, but I failed to do it with the following error:


ImportError Traceback (most recent call last)
/tmp/ipykernel_157/141298955.py in
1 import numpy as np
----> 2 from geoscilabs.mag import Mag, Simulator
3 from SimPEG.potential_fields import magnetics as mag
4 from SimPEG import utils, data
5 from discretize import TensorMesh

/srv/conda/envs/notebook/lib/python3.8/site-packages/geoscilabs/mag/init.py in
----> 1 from . import Mag
2 from . import Simulator
3 from . import MagDipole
4 from . import MagDipoleApp

/srv/conda/envs/notebook/lib/python3.8/site-packages/geoscilabs/mag/Mag.py in
3 import re
4 import numpy as np
----> 5 from SimPEG import utils, data
6 from SimPEG.potential_fields import magnetics as mag
7

/srv/conda/envs/notebook/lib/python3.8/site-packages/SimPEG/init.py in
6 from discretize import tests
7
----> 8 from .data import Data, SyntheticData
9 from . import data_misfit
10 from . import directives

/srv/conda/envs/notebook/lib/python3.8/site-packages/SimPEG/data.py in
4 import warnings
5
----> 6 from .survey import BaseSurvey
7 from . import survey
8 from .utils import mkvc

/srv/conda/envs/notebook/lib/python3.8/site-packages/SimPEG/survey.py in
4 import properties
5 import warnings
----> 6 from .utils.code_utils import deprecate_property, deprecate_class, deprecate_method
7
8 from .utils import mkvc, Counter

/srv/conda/envs/notebook/lib/python3.8/site-packages/SimPEG/utils/init.py in
57 from .plot_utils import plot2Ddata, plotLayer, plot_1d_layer_model
58 from .io_utils import download
---> 59 from .pgi_utils import (
60 make_SimplePGI_regularization,
61 make_PGI_regularization,

/srv/conda/envs/notebook/lib/python3.8/site-packages/SimPEG/utils/pgi_utils.py in
20 _check_shape,
21 )
---> 22 from sklearn.mixture._base import _check_X, check_random_state, ConvergenceWarning
23 import warnings
24 from .mat_utils import mkvc

ImportError: cannot import name '_check_X' from 'sklearn.mixture._base' (/srv/conda/envs/notebook/lib/python3.8/site-packages/sklearn/mixture/_base.py)

Attached is the screenshot showing the error message on my web browser.
Thank you in advance.

Best regards,
Jaewook Lee

em_examples missing in environment.yml

After a fresh install, the GPR_Attenuation.ipynb failed because it was missing pip install em_examples. I would have added it to the yml-file, but I am not sure if you just want to to pip install em_examples, or a pip install git_https://github.com/????.

download urls

previously, we had some download items stored on google cloud. Instead, we should do all downloads from the assets directory in this repository. This way, the material is versioned and can be more easily updated if need-be.

Plot unbroken lines for E and J fields

Currently some DC widgets plot broken lines for the E and J fields:

image

This plots could be misleading. Since lines density relates to the magnitude of the fields, having broken lines appearing and disappearing could lead to wrong interpretations of the values of the field in different regions. For example, in this image, the fields lines are less denser around the sources than in deeper regions.

We should pass broken_streamlines=False to matplotlib.pyplot.streamplot when plotting field lines.

This option was introduced in matplotlib 3.6, therefore the pinned version of matplotlib should be changed so we can make this change. Is there any reason why matplotlib is pinned to <3.5 on environment.yml? It was pinned in #45

Problem in importing modules for DCIP Notebooks in Jupyterlab

Dear Developers,

I would like to used the Notebooks for educational purposes in some geophysical courses. Thuy, I try to implement the Notebooks into the university's JupyterLab. I managed to build up the environment by usig the .txt file in this Repo. However, the DC Notebooks cannot import their packages. I always get the following error:

cannot import name 'Pardiso' from 'pymatsolver'

However, on my local Laptop, it works without problems. Have you ever had a similar issue for example in Binder which appears to be similar in terms of setup?

Best regards

New/re-make magnetic dipole app

I am going to make a new magnetic dipole app or re-make Mag_Dipole.ipynb.

Two years ago, I made Mag_Dipole.ipynb as it had some new functionalities:
(1) It models the magnetic field of a dipole as superposition of two opposite monopoles, so can be used to model both short dipoles and long dipoles.
(2) The orientation of dipole can be arbitrary (not necessarily the inducing geomagnetic direction).
(3) It plots the following in 3D: field lines, data grid on surface, coloured map of magnetic data on surface, two profiles in x and y directions.

Reasons of modification: The 3D plots was based on "mpl_toolkits.mplot3d", which didn't work very well (run the notebook to see how ugly and sometimes confusing...).

Goal:
(1) Re-organize the codes by following the geosci-labs style
(2) Use another plotting package for a better visualization
(3) Users can choose what are displayed

image

Add gravity apps

I am about to create a new module - gravity.

The first app is forward modeling of gravititional anomaly due to a sphere.
Assuming surface measurement, there are three parameters:
z: depth to the center of sphere
a: radius of the sphere
delta_rho: density contrast

The interface uses sliders to control the three parameters; when click "plot", the g anomaly along a profile over the sphere is plotted, as well as a contour map on the surface.

Does this sound ok?

explicit names rather than acronyms

To help ease navigation (mostly for students, but probably for ourselves too :) ), I suggest we favor spelling out names over using acronyms for directories of notebooks, e.g.

  • dcip --> dcip (I feel like spelling this out is overkill?)
  • em --> electromagnetics
  • gpr --> ground_penetrating_radar
  • mag --> magnetics

thoughts?

DC_Layer_Cylinder_2_5D

There seems to be something we are sensitive to with the location of the M, N electrodes in the 2.5D app

Using the setup in this image
image

I get the following error

---------------------------------------------------------------------------
ValueError                                Traceback (most recent call last)
File ~/opt/miniconda3/envs/geosci/lib/python3.10/site-packages/ipywidgets/widgets/interaction.py:239, in interactive.update(self, *args)
    237     value = widget.get_interact_value()
    238     self.kwargs[widget._kwarg] = value
--> 239 self.result = self.f(**self.kwargs)
    240 show_inline_matplotlib_plots()
    241 if self.auto_display and self.result is not None:

File ~/git/geosci/geosci-labs/geoscilabs/dcip/DCWidgetResLayer2_5D.py:474, in PLOT(survey, A, B, M, N, zcLayer, dzLayer, xc, zc, r, rhohalf, rholayer, rhoTarget, Field, Type, Scale)
    471     ax[0].annotate("%2.1e" % (VM), xy=xytextM, xytext=xytextM, fontsize=labelsize)
    473 else:
--> 474     ax[0].plot(M, VM, "o", color="k")
    475     ax[0].plot(N, VN, "o", color="k")
    477     xytextM = (M + 0.5, max(min(VM, ylim.max()), ylim.min()) + 10)

File ~/opt/miniconda3/envs/geosci/lib/python3.10/site-packages/matplotlib/axes/_axes.py:1605, in Axes.plot(self, scalex, scaley, data, *args, **kwargs)
   1363 """
   1364 Plot y versus x as lines and/or markers.
   1365 
   (...)
   1602 (``'green'``) or hex strings (``'#008000'``).
   1603 """
   1604 kwargs = cbook.normalize_kwargs(kwargs, mlines.Line2D)
-> 1605 lines = [*self._get_lines(*args, data=data, **kwargs)]
   1606 for line in lines:
   1607     self.add_line(line)

File ~/opt/miniconda3/envs/geosci/lib/python3.10/site-packages/matplotlib/axes/_base.py:315, in _process_plot_var_args.__call__(self, data, *args, **kwargs)
    313     this += args[0],
    314     args = args[1:]
--> 315 yield from self._plot_args(this, kwargs)

File ~/opt/miniconda3/envs/geosci/lib/python3.10/site-packages/matplotlib/axes/_base.py:501, in _process_plot_var_args._plot_args(self, tup, kwargs, return_kwargs)
    498     self.axes.yaxis.update_units(y)
    500 if x.shape[0] != y.shape[0]:
--> 501     raise ValueError(f"x and y must have same first dimension, but "
    502                      f"have shapes {x.shape} and {y.shape}")
    503 if x.ndim > 2 or y.ndim > 2:
    504     raise ValueError(f"x and y can be no greater than 2D, but have "
    505                      f"shapes {x.shape} and {y.shape}")

ValueError: x and y must have same first dimension, but have shapes (1,) and (0, 1)

Recommend Projects

  • React photo React

    A declarative, efficient, and flexible JavaScript library for building user interfaces.

  • Vue.js photo Vue.js

    ๐Ÿ–– Vue.js is a progressive, incrementally-adoptable JavaScript framework for building UI on the web.

  • Typescript photo Typescript

    TypeScript is a superset of JavaScript that compiles to clean JavaScript output.

  • TensorFlow photo TensorFlow

    An Open Source Machine Learning Framework for Everyone

  • Django photo Django

    The Web framework for perfectionists with deadlines.

  • D3 photo D3

    Bring data to life with SVG, Canvas and HTML. ๐Ÿ“Š๐Ÿ“ˆ๐ŸŽ‰

Recommend Topics

  • javascript

    JavaScript (JS) is a lightweight interpreted programming language with first-class functions.

  • web

    Some thing interesting about web. New door for the world.

  • server

    A server is a program made to process requests and deliver data to clients.

  • Machine learning

    Machine learning is a way of modeling and interpreting data that allows a piece of software to respond intelligently.

  • Game

    Some thing interesting about game, make everyone happy.

Recommend Org

  • Facebook photo Facebook

    We are working to build community through open source technology. NB: members must have two-factor auth.

  • Microsoft photo Microsoft

    Open source projects and samples from Microsoft.

  • Google photo Google

    Google โค๏ธ Open Source for everyone.

  • D3 photo D3

    Data-Driven Documents codes.