As a consequence of the current capabilities of collecting and storing data, a data set of many attributes frequently reflects more than one phenomenon. Understanding the role of attribute subsets and their impact on the organization and structure of a data set under study is paramount to many exploratory and analytical tasks. Example applications range from medicine to financial markets, whereby one wishes to locate subsets of variables that impact the prediction of target categorical attributes. The user is essential in this context since automated techniques are not currently capable of embedding user knowledge in attribute selections. In this work, we propose an approach to deal with the analysis and selection of attributes in a data set based on three principles: firstly, we center the analysis of the relationships on categorical attributes or labels, because they usually summarize important state variables in the application; secondly, we express the relationship between target attributes and all others in the data set within a single visualization, providing understanding of a large number of correlations in the same visual frame; thirdly, we propose an interactive dual-visual approach whereby changes and selections in attribute space reflect visually on the configuration of data layouts, conceived to support immediate analysis of the impact of selected subsets of attributes in the organization of the data set. We validate our approach by means of a number of case studies, illustrating distinct scenarios of knowledge acquisition and feature selection.
Erasmo Artur (USP)
Rosane Minghim (USP)
- Download this project and unzip in a local directory
- Open the HTML file in a browser (tested in Chrome, Firefox, and Edge)
- Rendering the first view:
- Go to Left panel->CSV File->Choose file to pick a CSV file.
- Then choose a target attribute from Left panel->Target Attribute.
- Starting the second view:
- Go to Right Panel->Instance identifier and choose an attribute to label the instances inside the view
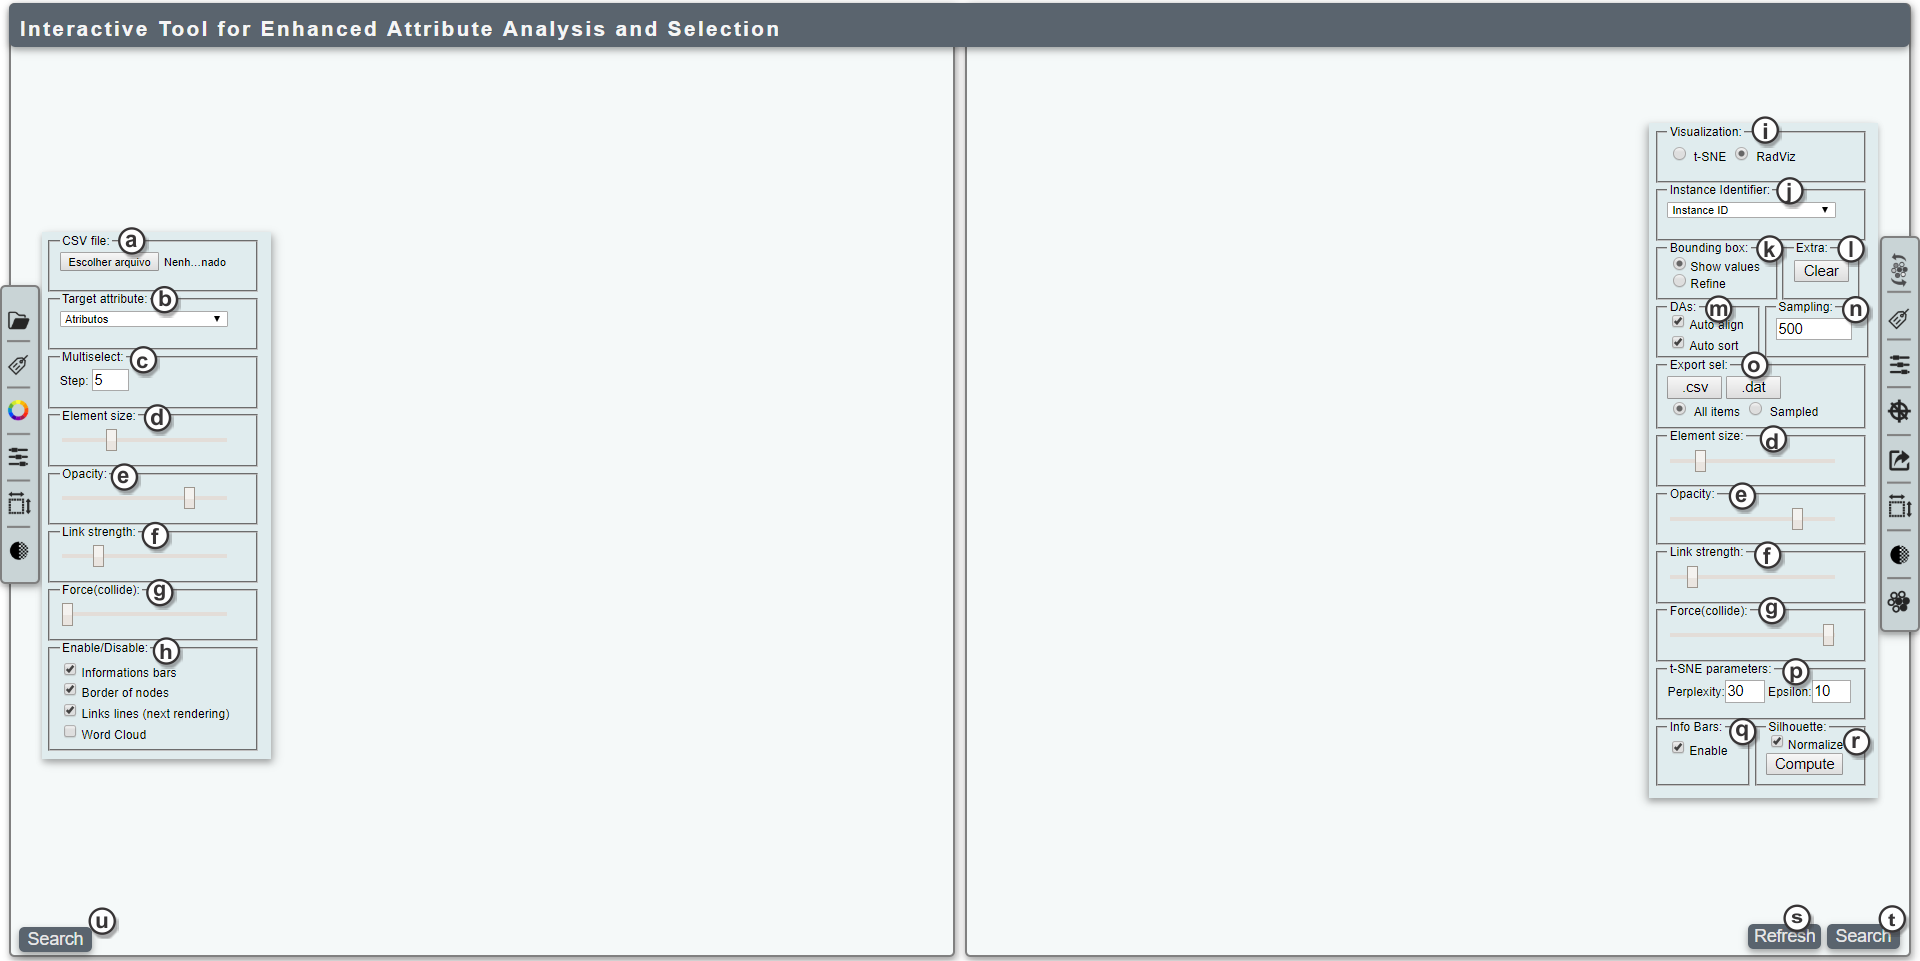
- (a) File opener
- (b) Target attribute selection
- (c) Define the number of top correlated attributes simultaneously selected when right-clicking over a DA
- (d) Adjust the size of the elements
- (e) Adjust the opacity of the elements
- (f) Adjust the strength of RadViz links
- (g) Adjust the repelling force of the elements (to avoid overlapping)
- (h) Enable/disable visual widgets of the tool (can increase performance)
- (i) Choose the visualization technique for the second view
- (j) Choose an identifier to name the elements in the second view
- (k) Choose the bound box action in the second view:
- Show values: Show a table with all values of the selected items
- Refine: Rebuilds the correlation matrix with only the selected items
- (l) Restart the view
- (m) Enable/disable auto ordering and auto-align
- (n) Define the sample size for the view
- (o) Define the options to export the current selection
- (p) Define the t-SNE parameters
- (q) Enable/disable the bars in the second view
- (r) Show the silhouette values for:
- Original data
- Selected data
- Selected and projected (RadViz) data
- (u) Search attributes by name
- (s) Refresh the second view
- (t) Search items by name
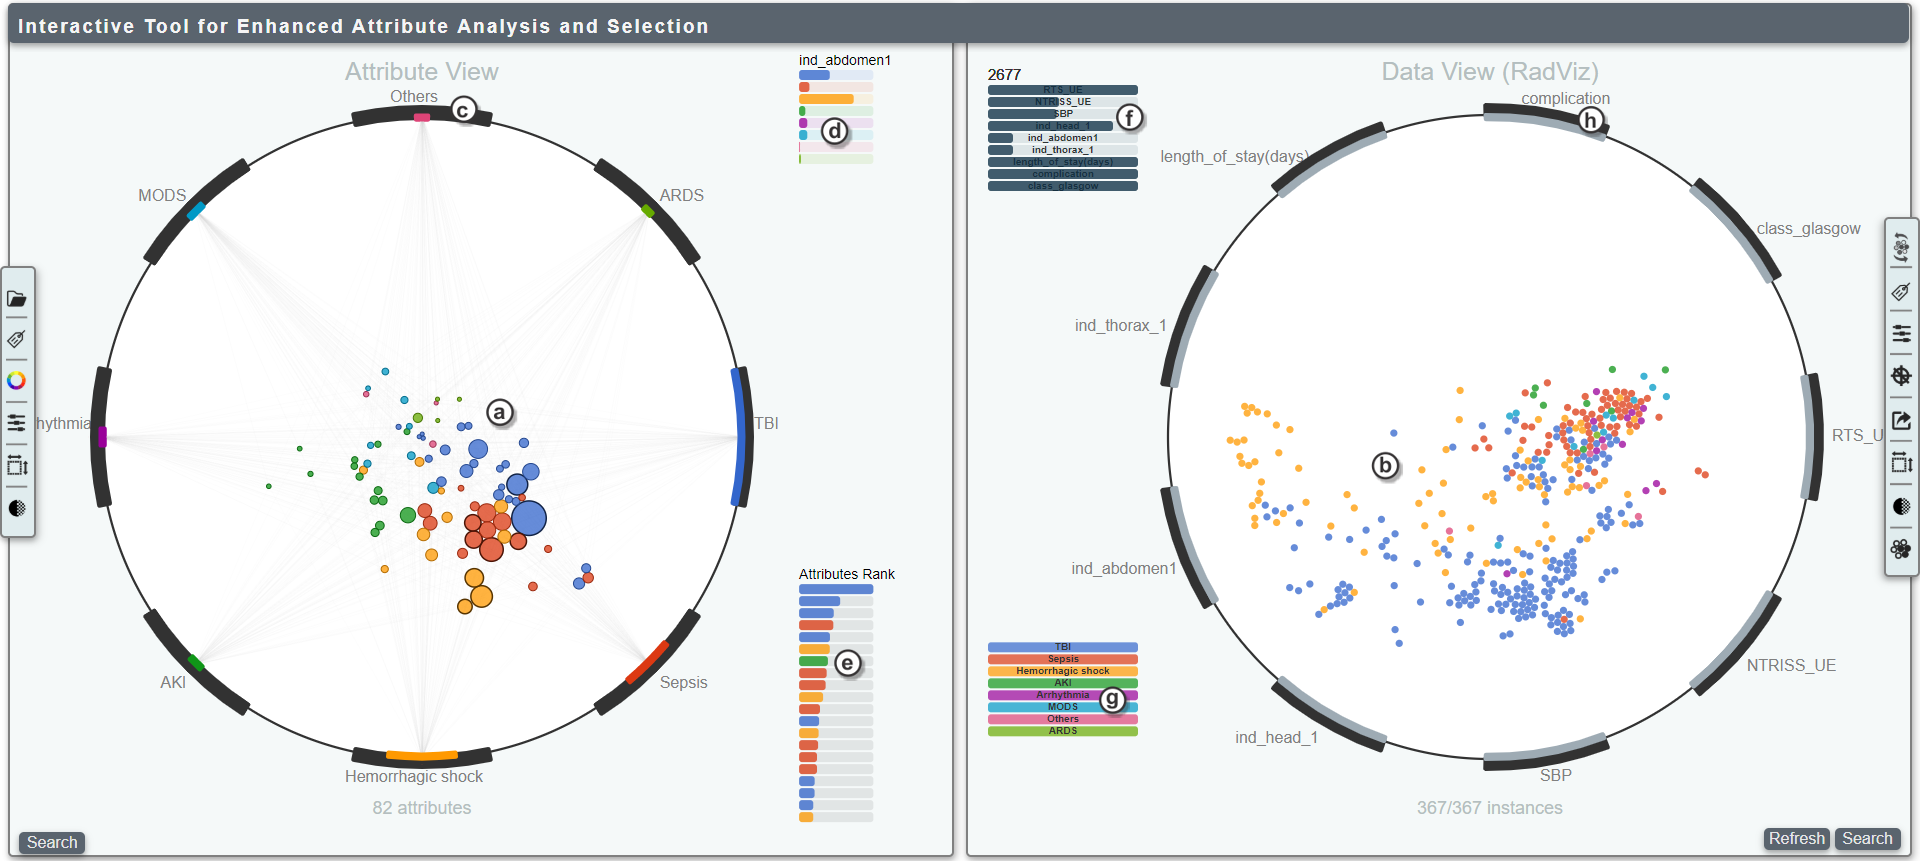
- (a) Mapped attributes; their size and position are indicative of correlation levels with labels
- (b) Mapped items in a classic RadViz conpecpt
- (c) Dimensional anchor of the attribute view
- (d) Correlation set of the last hovered attribute
- (e) Attribute rank of the last hovered dimensional anchor (label)
- (f) Values of the last hovered item (hover over them to see the precise value)
- (g) Legend of label values
- (h) Dimensional anchor of the item view
-
You can freely manipulate the DAs in both views.
-
By hovering the pointer over DAs in the attribute view, the correlation data between attributes and the current DA-label is encoded in element sizes, returning to regular sizes when removing the pointer.
-
Correlation information between a particular attribute and all data labels is exposed by hovering the pointer over this attribute inside the attribute view. This information arises from arcs of DAs, information bars and influence lines.
-
You can remove label values by dragging out DAs. Thus, the correlation matrix will be recalculated containing only the remaining label values. This mechanism is particularly useful when users notice some already segregated label value (observing the second view); hence, you could remove this label to focus on interesting attributes of the remaining label values.
-
If you want to select a large number of attributes, you can use two distinct multi-selection mechanisms. The first one is the bounding box, which allows multiple selections inside the unit circle. The second is the multi-select click, where you right-click on a DA-label and the P strongest correlated attributes (not yet selected) are included. The P value is defined in the control panel.
-
To start the second view, you must choose an attribute in the right panel to identify the items.
-
You can choose the visualization method between RadViz and t-SNE. Selecting RadViz, when hovering the pointer over the elements, arcs and information bars expose the actual data values of the selected item proportionally.
-
By hovering the pointer over DAs, the values of the attribute represented by that DA encodes new sizes of elements in the projection. It is possible to do this also by hovering over attributes in the attribute view, providing coordination between views during analysis. This could give the user a sense of how each attribute affects the labels and items.
-
Every attribute selected in the attribute view or in the list of attributes is added to the second view.
We have included three sample data sets that can help you to get started within the tool. Feel free to analyze and select attributes until you be able to play with your own data sets. The data sets are:
-
- Content: Animal characteristics
- 18 attributes; 101 items
- Suggested target attribute: class_type
-
- Content: Extracted image features
- 150 attributes; 1000 items
- Suggested target attribute: category
-
News-23 data set
- Content: RSS News Feeds
- 3731 attributes; 1771 items
- Suggested target attribute: class
- The tool uses localStorage of the browser to exchange data when utilizing the pruning tool. Selecting a large number of elements can exceed the quota and return an error. To prevent this, you can adjust the local storage quota of the web browser.
- Adjunting the quota in firefox:
- Go to about:config and search for "dom.storage.default_quota" and fill the value (in kilobytes).
- E. Artur and R. Minghim, A novel visual approach for enhanced attribute analysis and selection, Computers & Graphics, https://doi.org/10.1016/j.cag.2019.08.015
Erasmo Artur - [email protected]