foxglove / community Goto Github PK
View Code? Open in Web Editor NEWThis repo hosts our org-wide discussion board
This repo hosts our org-wide discussion board


Requested by Studio user @Balussery in Slack; visualizing this is currently possible in rviz.
Example:

The result is that you either cannot select the top-most position, and the bottom-most position ends up adding the new panel outside of the tab panel. It's ambiguous whether the user wanted to add the new panel inside or outside of the tab so I'm not sure what the solution is, but it makes rearranging panels inside of a tab difficult.
For the map display it is useful to have many different modes of displaying the tracks.
i) Display only the position at current time step (how things are at present in ROS2)
ii) Display the last n seconds of the track (useful for really long / repetitive tracks). Ofcourse this can be extended to show n seconds from the future as well in the case of bag files.
iii) Preload and display the entire track (Already exists for ROS1 bags, need this for ROS2 bags)
Another key need in the case of multi platforms or multiple navigation sources is the ability to select which among the many navsatfix messages to plot. This I beleive has alread been requested in issue 1615.
Markers in the 3d panel usually represent some underlying message. For example, a marker might represent a tracked object.
We would like to add the ability to link markers with their underlying message, and allow users to inspect the source message. For example, when clicking a marker in the 3d panel, I should be able (via a button or similar) to click through to open the Raw Messages panel showing the relevant topic (e.g. /tracked_objects{object.id==5980}).
The link from the marker to the underlying topic can be encoded in the marker. This will require extending the ROS Marker message which we currently use.
Description
Captured from a conversation with @2metres today. The .field.name[0]... portion of a valid input should have a different color from the topic name that precedes it.
Currently the 2d/3d button in 3d pannel only works for z axis.
Sometime the user would love to project along x, -x, y, -y.
Might be nice to provide some choice for the projection view.
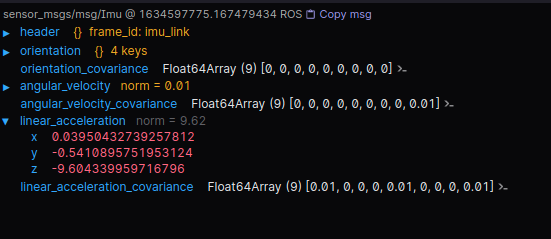
In the attached bag, using the Raw Message panel I can set the message path to /gps/fix.position_covariance[:] and see the list of all nine matrix cells. But if I use the topic only (/gps/fix) that field renders as
Float64Array(9) [0.011881, 0, 0, 0, 0.011881, 0, 0, 0, 0.009409]
With no ability to plot individual values. Since fixed arrays of length 3/4/9/16 are common in ROS for holding vectors and matrices, it would be nice if these showed up in a "more native" way in Studio vs the currently handling which seems more suited for large data buffers like image or point cloud data.


As which has been done in rqt_plot

via @jhurliman:
a feature i'd love to see that i think is low hanging fruit: a recording panel. allow each topic to be toggled on/off and renamed, write the stream coming out of the current player to a file on disk. it would double as both a live session recorder and a bag transformer
Similar to how vscode can work with a remote host over SSH, it would be nice if we supported connecting to ROS over an SSH tunnel. This would avoid many networking issues that come from all the various TCP connections ROS opens, and be more secure if robots are exposed on a public network.
It would also mean that rosbridge (websocket) connections are no longer necessary for desktop users. However, we may wish to keep websocket support for browser users.
It would be great if it were possible to export the current layout+data source as an mp4.
For example, if a bag is loaded, and you configure the panel, you could hit File -> Export video and we would render a smooth video at a desired resolution/framerate (rather than needing to use screen recording tech which would not result in a smooth framerate).
See also: Ability to export single frames as pngs (foxglove/studio#772).
I'd like to publish multiple images in one msg, but foxglove studio can only visualize the standard image msg type.
The custom msg may be like:
sensor_msgs/Image raw1
sensor_msgs/Image raw2
sensor_msgs/CompressedImage compressed1
sensor_msgs/CompressedImage compressed2
Currently Foxglove Studio supports rendering image frames using the sensor_msgs/Image and sensor_msgs/CompressedImage. The latter supports PNG or JPEG compression.
Several people have asked for the ability to render video data, most commonly in h264 format. Often, this data is recorded as a separate file alongside a ROS bag, but in theory the NAL units could be wrapped within a ROS or Protobuf message, or stored directly in MCAP.
Several methods to implement this have been discussed, from using native HTML video elements, to decoding the frames in WASM.
Currently we use RosDatatypes throughout the app. This data structure can include enum constants, but each message field is not annotated with a type indicating which set of constants it comes from. The __foxglove_enum hack can be used to add annotations to ROS msg fields matching them with a separate message containing only constants.
Protobuf, however, has native support for enums, so data sources using protobuf schemas will have information about which fields are associated with which enums. The type of datatypes and the enumValuesByDatatypeAndField will need to change to take full advantage of protobuf enums.
A common pattern in planning, perception, or controls is producing several candidate options (paths, trajectories, etc) at any time. These candidates may appear in a single message (as arrays of candidates). An engineer may want to visualize these different candidates against one another on a single plot.
The current plot panel allows a user to plot arbitrary x/y values from an array within a message using the current x-axis setting. This setting (like the accumulated) setting only allows the user to select 1 x-axis value and explicit multiple y-axis values.
We should provide a way to allow the user to select arrays of x/y values and plot each array of x/y values as a dataset.
Current Experience
When using Plot with a live connection, the plot internally seems to buffer data indefinitely, and the app eventually slows down. As soon as the plot panel is removed, the app gets faster again.
Desired Experience
Maybe some combination of:
Windows lost on restart.
Steps To Reproduce
Expected Behavior
Re-open all previously open windows
Actual Behavior
Observe that only the last open or last accessed window (unclear which one) reopens; the other windows are lost
Nice to have
Most multi-window tools like iTerm2, Chrome etc allow switching between windows using a Window menu. In Studio the best way to do this, that I found, is using the Dock menu. Would be nice to have a Window menu.
Studio is useful for creating dashboards that show real-time sensor information. However, in some circumstances it could be desirable to have the panel arrangement "locked," such as on system where non-expert users might be looking at data but should not be reconfiguring Studio.
I'm not suggesting anything super secure here. It would probably be enough to have a menu item for locking the layouts. Add an overlay element across the whole panel area that intercepts clicks, but allows mouseover.
In the raw message view, it calculates the norm of Vector3 fields
It would be very nice to have a syntax to put this into a plot panel.
via @jtbandes
Sample bags containing this topic
https://google-cartographer-ros.readthedocs.io/en/latest/demos.html
I would like to plot values from two topics on the same panel, with the same x-axis scale but separate y-axis scales.
It is possible with Chart.js: https://www.chartjs.org/docs/latest/samples/line/multi-axis.html (Note this isn't a great example because you cannot tell which y-axis is used for which dataset.)
Effectively you would need to be able to configure zoom extents for both the left and right y axes, and then associate each topic with one axis or the other.
(from cruise-automation/webviz#548)
hello
i am building (really planning on building I just need to make a few more design tweaks first) very sophisticated a cappella (VOICES ONLY) robots. i have attached prototype designs for these robots below (PLEASE DO NOT TAKE THIS IDEA)

anyways the robot has audio and right now i dont see a way to play audio from foxglove. it would be nice to hear my acabots sing in foxglove. i didnt see an audio ticket so i made this one.
thx
(Saw your Show HN post! Hope you all are doing well :D)
via @defunctzombie:
https://github.com/GoogleChromeLabs/comlink#typescript
Supports better type information for the receiver. And one less thing to maintain with strange edge cases.
via @jhurliman:
We can detect when the robot has been torn down and restarted (vs a network disconnect/reconnect) by monitoring the /run_id parameter in Ros1Player. When this changes, all panel state should be cleared so the user doesn't see a mixture of old and new session state in panels like the watchdog monitor, timeline chart, 3D view markers, etc.
Requested by Studio user @Balussery in Slack; visualizing this is currently possible in rviz.
Example:

In the topic graph, it would be nice to be able to hide the topics and services common to every node (e.g. rosout and parameter_events).
Having both of these visualised creates a lot of on-screen clutter and hides the important topics.
Currently we always open with our default size regardless of what the user previously configured
Consider also remembering position and full screen status.
The Parameter panel does not appear to support dynamic_reconfigure. This would be useful for tuning parameters for live systems.
The Parameter panel does show params that are "managed" by dynamic_reconfigure because it reflects them to the parameter server. But, when they are updated in Studio, it does not trigger the reconfigure callback to allow the node to react to the new value.
Also, dynamic_reconfigure gives information like documentation strings and min and max ranges which might be useful for presenting a UI as rqt_reconfigure does.
via @jhurliman:
We can use the raw message panel as a reference. UInt8Array values can be rendered as (${length}) [${first20Values}, …] while long string values can be truncated with ellipses.
In both cases it would be nice to have a save to disk button.
The theora_image_transport package provides the only image_transport plug-in that uses a video codec (Theora) to drastically reduce the size of consecutive frames, which has an immense impact on rosbag file size -- in a recent test, it reduced the size of a rosbag by 99.7%.
However this comes with usability tradeoffs because tooling is not able to decode the Theora stream. This includes Foxglove, which cannot display Theora frames in an Image panel.
Essentially, you would need to scan backwards from the current time to find the previous keyframe, then decode all frames between the keyframe and the current frame. You may need to find the initial header packets, as well.
You could possibly use ogv.js. If Foxglove is based on Chromium, Theora may be supported already.
Consider using a dark tile set such as https://openmaptiles.org/styles/#dark-matter
It should be possible to overlay 3D markers (currently rendered only in the 3D panel) onto a 2D image in the Image panel.
Would be nice to discover and call services like you can do in rqt
Blocked by:
Related: Hide/show services in Topic Graph panel (#768)
Tracking some well-known message types which we could consider adding built-in Studio panels/visualizations for.
https://docs.ros.org/en/melodic/api/sensor_msgs/html/index-msg.html
https://github.com/luxonis/depthai-ros/tree/noetic-devel/depthai_ros_msgs/msg
https://github.com/ANYbotics/grid_map/blob/master/grid_map_msgs/msg/GridMap.msg
https://github.com/uos/mesh_tools / https://www.researchgate.net/publication/336627583_Tools_for_Visualizing_Annotating_and_Storing_Triangle_Meshes_in_ROS_and_RViz
A major hurdle for using this with articulated robots is the difficulty to add multiple joint state plots together.
This has to be done one after the other and is tedious for 6+ dof arms, especially when you want to have separate plots for position, velocity and acceleration.
Ideally you would select multiple joints by name (not by index) and drag them into the plot together.
PlotJuggler managed to simplify this use a lot and it's worth going for a similar approach in my opinion.
Currently, there are no panel options for the State Transitions panel, and the X range is constantly getting larger making it hard to see new state transitions in real time. It would be great if you could set a fixed X range exactly like you can do with the Plot panel.
Bellow I am using foxglove to monitor some vehicle systems in real time, the State Transitions panel is great for being able to watch for state changes, however the longer I'm connected to the system, the larger the X scale becomes and the harder it gets to see state transitions as they happen. As you can see bellow, the left side of the scale stays fixed and I will constantly have to scroll in and out, then reset view to try to get it to fix at a different point so I can see new states.
I have implemented a Theora video decoder (#537) as a separate panel, but since it is not derived from the Image panel, it lacks pan, zoom, marker overlays, hotkeys, etc. It would be useful to have a way to extend the Image panel so that I get these features.
Consider an API through which a plugin could specify the message types handled and a hook that returns a ImageBitmapSource to be displayed.
It would also be useful to extend beyond simple 2D point markers to other kinds of layers. For example, if you were using object detection, you might have a bounding box and confidence level text label for each detected object.
We should support clicking on the image panel, and publishing these clicks on a topic.
Open questions:
geometry_msgs/Point.For example, if someone ran rosbag record with --split, they would end up with a bunch of bag files in a folder. It would be nice if we could load them all (or a subset) at once.
From public discussion in ROS discord:

Similar to http://wiki.ros.org/rqt_tf_tree it is helpful to have a panel where you can view the TF tree for your robot. This helps in debugging linkage configuration issues.
Our linux app does not have in-app auto-updates. We do have an apt repo setup but users are not always updating their apt packages. We should notify users that a new version is available.
Here is an example of how vscode handles this notification on linux.

We should officially support Safari, at least the latest version (currently 15.1). This applies to both macOS and iOS/iPadOS.
Note that supporting Safari doesn't automatically mean Studio will work well on touch devices, our interface is currently heavily optimized for mouse interaction and we have no immediate plans to improve that.
This ticket can be closed when we remove the browser warning on Safari.
Blockers:
Use case: An engineering team records data from their robot. Later, they rerun some of the recorded data against an updated codebase (new algorithms / models), and record the results. In some cases, they may replay the same recorded data against several new alternative versions of the code, and record the results.
Then they would like to compare the output from the original recording with the new recording, in the same studio instance. For example, overlaying the new behavior visualization on top of the old behavior.
This feature was partially supported in original Webviz code, but was removed due to being hard coded to Cruise conventions in many places and not flexible.
Workaround: It is possible to achieve this today by rewriting the newer bag using a topic prefix. I'm not sure if existing CLI tools can do so, but a very short python script using the rosbag library would achieve it.
Foxglove should support live monitoring of Behavior Trees execution live during navigation of many robots, as a custom panel or extension (similar to Groot and Nav2 stack, but with adequate continuous support for debugging and new features).
Shortly: Since ROS Humble there will be no option to see BT during execution of the BT Navigator from Nav2 stack (ZeroMQ bugs for multirobot systems, it was described in some issue and in "Migration from ROS Galactic to Humble" notes)
I see that an option to view in real-time execution of 1+ BT will be an awesome new feature in Foxglove, because since next year and Humble there will be no clear candidate for this.
Best,
Łukasz Janiec
Currently the app provides no way to "find" instances of messages on a certain topic other than by seeking back/forward until the desired message is displayed. If the messages on the desired topic are very high-frequency (such as /tf) it can be very difficult to find and display the desired message in the app.
The app could support a "breakpoints" feature where playback would automatically stop when some kind of event occurs. Such an event could be:
header.frame_id="parent" AND child_frame_id="child")via @jhurliman:
In the parameter panel, as you type in a new param value every keystroke becomes a setParameter() call that writes to the rosparam server. Instead, modified values should be marked as dirty and show save and clear buttons inline. This should handle the case of starting to modify a value, receiving a remote update for that parameter (which does not overwrite the current user input), then showing the new remote value if the user presses Clear.
e.g. "check for updates" button, some kind of popup when an update is requires a restart (chrome/linear style), etc
When I make the help sidebar narrow, the title wraps, but remains vertically centered so it goes off the top of the screen. Ideally its alignment to the top of the screen would remain fixed, so the text remains fully visible even when wrapped.
A declarative, efficient, and flexible JavaScript library for building user interfaces.
🖖 Vue.js is a progressive, incrementally-adoptable JavaScript framework for building UI on the web.
TypeScript is a superset of JavaScript that compiles to clean JavaScript output.
An Open Source Machine Learning Framework for Everyone
The Web framework for perfectionists with deadlines.
A PHP framework for web artisans
Bring data to life with SVG, Canvas and HTML. 📊📈🎉
JavaScript (JS) is a lightweight interpreted programming language with first-class functions.
Some thing interesting about web. New door for the world.
A server is a program made to process requests and deliver data to clients.
Machine learning is a way of modeling and interpreting data that allows a piece of software to respond intelligently.
Some thing interesting about visualization, use data art
Some thing interesting about game, make everyone happy.
We are working to build community through open source technology. NB: members must have two-factor auth.
Open source projects and samples from Microsoft.
Google ❤️ Open Source for everyone.
Alibaba Open Source for everyone
Data-Driven Documents codes.
China tencent open source team.
